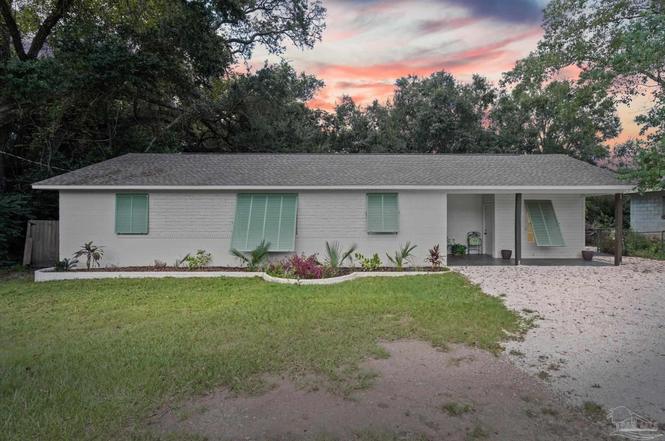
5120 W Fairfield Dr · Myrtle Grove, FL
Flood risk 1/10 · Minimal
- FEMA flood zone
- X (unshaded)
- Chance of flooding over 30 yrs
- 0.0%
- Est. flood insurance / yr
- $507 – $1,088
Fire risk 3/10 · Minor
- Est. fire insurance / yr
- $947 – $1,759
Heat risk 10/10 · Severe
- Hot days now (above 105°F)
- 7 days/yr
- Hot days in 30 yrs
- 23 days/yr
Wind risk 9/10 · Severe
- Chance of severe wind over 30 yrs
- 99.0%
Air-quality risk 1/10 · Minimal
- Unhealthy air days now
- 0 days/yr
- Unhealthy air days in 30 yrs
- 0 days/yr
Risk factors via First Street. Map © Google.
Why this score? — see what drove the C grade
The composite is a weighted blend of 9 inputs, each scored 0–100. Each bar is that input's sub-score; the figure is the points it added to the 100-point composite (weight × sub-score).
- Cash flow +19.6/30.0
- ARV discount +12.2/15.0
- DSCR +6.2/10.0
- 1% rule +4.5/10.0
- Schools +3.6/10.0
- Rent growth +3.5/5.0
- Livability +3.2/5.0
- Condition / age +2.5/5.0
- Appreciation +0.0/10.0
$194,500
🖨 Deal sheet (PDF) 📄 Offer letter ✓ Due diligence
Listing remarks
Beautifully Updated 4-Bedroom Home in West Pensacola! Welcome to this charming four-bedroom, two-bath home in the heart of West Pensacola, where modern updates meet everyday comfort. The open-concept living and dining area creates the perfect space for hosting guests and making lasting memories. The kitchen is a true centerpiece, featuring granite and butcher block countertops, sleek stainless steel appliances, and plenty of room for culinary creativity. Four spacious bedrooms provide flexibility for family, guests, or a home office. The primary suite offers its own private bath for convenience and privacy, while a separate entrance opens the door for work-from-home options or other creati
Key facts
- Separate entrance
- Private bath
- Storage shed
Tags
Property features AI
Finance
- Other: Public/County maintained road access; Approximately 0.35 acre lot
- HOA & community: No association
Exterior
- Parking: Two total parking spaces; Two covered spaces; Two-car carport
- Security: Smoke detector(s)
- Utilities: Public water; Public sewer; Electric service with circuit breakers
- Home design: Single-story block and concrete construction; Slab foundation; One level; Resale property; Detached (not attached to other properties)
- Construction: Built with block and concrete; Shingle roof; Slab foundation; One-story
- Exterior features: Back yard fencing; Chain link fence; Other fence type; Yard building (additional structure); Shingle roof; Interior lot
Interior
- Kitchen: Updated kitchen with granite counters; Dishwasher; Disposal; Electric water heater (ENERGY STAR qualified water heater)
- Bedrooms: Master bedroom on the first floor (approx. 12 x 15); Bedroom on the first floor (approx. 11 x 11); Bedroom on the first floor (approx. 10 x 12); Bedroom on the first floor (approx. 14 x 12)
- Flooring: Tile flooring
- Bathrooms: Two full bathrooms; Updated bathrooms (renovated within the last 1–5 years)
- Heating & cooling: Central heating (ENERGY STAR qualified equipment); Central air conditioning (ENERGY STAR qualified equipment); Ceiling fan(s)
- Interior features: Insulated doors; Double pane windows; Storm windows; Blinds; Smoke detector(s)
- Laundry & utility: Electric water heater
Neighborhood map
What this means for you Summary
Snapshot
- This is a 4-bed/2.0-bath single-family listed at $194k.
Deal economics
- At list price, monthly cash flow is $223 ($3k/yr) — positive.
- The deal already cash-flows at list — no discount required.
- To meet the 1% rule (rent ≥ 1% of price), the offer needs to be $184k (5.2% below list).
- Recommended offer: $171k (12.0% below list) — sets the bar for market timing.
- Cap rate 7.7% vs local median 5.1% in Myrtle Grove — top-decile yield for the area; either an underpriced asset or a hidden risk that comps aren't pricing in. Stress-test before assuming the spread holds.
Location & tenants
- Location reads 64/100 on livability (#701 in FL) — a middle-class / working-renter tenant base. Strengths: cost of living A+, housing A+, health & safety B+; Watch: schools D-, amenities F, commute F.
- Escambia (suburban): math 40% / reading 45% proficiency, ranked #56 of 73 in FL (top 77%) — families likely to look elsewhere, expect single-tenant / working-renter base with shorter leases.
- Market conditions: Rents rising (+3.9%/yr); 270 active listings in the ZIP; 9 comparable units currently listed for rent nearby; rentals at typical pace (median 25d on market — plan ~3-4 weeks tenant-placement turnaround); 1,479 units permitted in Escambia County in 2024 (0 in 5+ unit buildings).
- This rent runs 35% of the median local income ($62k/yr) — at the standard rent-burdened threshold; future hikes will face affordability resistance.
Forward outlook
- Local home prices are declining (-3.0%/yr); year-one equity from $1k of loan paydown is wiped out by about $6k of value loss. Plan a longer hold.
- Escambia County population projected at +13% by 2050 — modest demand growth; plan on rents tracking national, not racing it.
Negotiation context
- It's been on market 160 days — a 12% lower offer ($171k) is reasonable based on typical stale-listing flexibility.
- 11 sale attempts since 25y ago with the ask held roughly flat each time — persistent listings suggest the price (not the market) is what's stuck; bring a comps-based counter.
- Current owner paid $58k; list at $194k implies a 235% gain — meaningful room to come down on a strong offer.
Risks & watch-outs
- Climate carrying-cost: severe wind risk, 99% chance of damaging wind over 30y; extreme-heat days projected 7→23/yr by 2055 (HVAC capex compounding) — expect insurance premiums to compound above CPI over the hold.
Questions for the listing agent
- It's been on market 160 days. Have you received any prior offers? Is the seller open to a 12% concession, seller financing, or rate buy-down credit?
- Built in 1970 — when were the roof, HVAC, electrical panel, plumbing, and water heater last replaced?
- Why hasn't it sold? Are there any deal-killer items the seller is aware of (foundation, flood, title, zoning, code violations)?
- Is there a deadline driving the sale (1031 exchange, divorce, estate, relocation)? That informs how much negotiation room exists.
- Schools are D-rated, which usually means shorter tenancies and higher turnover. Who's the typical renter profile here, and what's been the actual vacancy rate?
- What's the average days-on-market for RENTAL listings here right now (not sales)? A rising rental-DOM trend means longer vacancies and softer asking-rent achievability than the comps imply.
- What's the recent tenant-quality profile in this submarket — average credit score on applications, eviction rate, late-payment / NSF rate, and stable-employment percentage? A property-management company in the area should have these aggregated.
- How much new for-sale + rental construction is in the pipeline within 1–3 miles? Heavy new supply typically softens prices + rents 12–24 months out; constrained supply supports both.
Investment metrics
- 1% rule
- 0.95% ✗
- Cap rate
- 7.67%
- Cash-on-cash
- 4.92%
- DSCR
- 1.22
- GRM
- 8.8
CMA / ARV
- ARV (on-the-fly)
- $216,954
- Comps found
- 12
Show comp detail 12 sales within ~0.75 mi
| Address | Dist | Beds/Ba | Sqft | Sold | Price | $/sf | Match |
|---|---|---|---|---|---|---|---|
| 310 Cherokee Trl | 0.37mi | 3/2.0 (-1) | 1,479 (+4%) | 2mo | $259,000 | $175 | 69 |
| 1402 N 57th Ave | 0.21mi | 3/2.0 (-1) | 1,290 (-9%) | 4mo | $247,500 | $192 | 67 |
| 29 Nottingham Way | 0.26mi | 3/2.0 (-1) | 1,500 (+6%) | 8mo | $220,000 | $147 | 66 |
| 110 Tomahawk Trl | 0.45mi | 3/2.0 (-1) | 1,376 (-3%) | 8mo | $151,000 | $110 | 62 |
| 4915 Tulip Dr | 0.32mi | 3/2.0 (-1) | 1,229 (-13%) | 1mo | $186,500 | $152 | 57 |
| 5911 Lillian Hwy | 0.61mi | 3/2.0 (-1) | 1,508 (+6%) | 1mo | $120,000 | $80 | 55 |
| 233 Tonawanda Dr | 0.50mi | 3/1.5 (-1) | 1,308 (-8%) | 4mo | $200,000 | $153 | 54 |
| 18 Besma Dr | 0.66mi | 4/1.0 | 1,342 (-5%) | 5mo | $95,000 | $71 | 52 |
| 2 Adkinson Dr | 0.51mi | 3/1.0 (-1) | 1,548 (+9%) | 1mo | $252,000 | $163 | 52 |
| 1904 N 61st Ave | 0.47mi | 3/2.0 (-1) | 1,612 (+14%) | 1mo | $275,000 | $171 | 50 |
| 104 Cherokee Trl | 0.59mi | 3/2.0 (-1) | 1,587 (+12%) | 4mo | $70,000 | $44 | 45 |
| 6400 Birkhead Dr | 0.60mi | 3/2.0 (-1) | 1,629 (+15%) | 10mo | $282,000 | $173 | 34 |
Match score weights: distance 35% · size 25% · config 20% · recency 20%. Top-matched comps best support the ARV.
Projected returns pro-forma
-3.0% appreciation · 3.85% rent growth · sell at horizon
- IRR
- -7.8%
- Equity multiple
- 0.71×
- Total profit
- $-15,759
- Equity at exit
- $29,001
- IRR
- 2.7%
- Equity multiple
- 1.20×
- Total profit
- $11,051
- Equity at exit
- $16,817
Cash invested: $54,460 (down + closing). Projections, not guarantees.
Landlord ↔ Tenant lean methodology
- Overall (STATE)
- 87 Strongly Landlord-Friendly
- State Florida
- 87 Strongly Landlord-Friendly · R+3
- County
- — inherits STATE
- City
- — inherits STATE
ZIP-level market 32506
- Home prices YoY
- -22.5%
- Rents YoY
- 3.9%
- Active inventory
- 270
- Price-to-rent
- 8.8×
Monthly cashflow live
- Estimated rent
- $1,845 high interval (Pro) →
- Mortgage (P&I)
- −$1,020
- Tax from tax record
- −$133 /mo · $1,597/yr
- Insurance
- −$81
- HOA
- −$0
- Vacancy / Maint / Mgmt
- −$387
- Net cashflow
- $223
Break-even live
Sensitivity live
| Price | -10% $333 | -5% $278 | +0% $223 | +5% $168 | +10% $113 |
|---|---|---|---|---|---|
| Rent | -10% $77 | -5% $150 | +0% $223 | +5% $296 | +10% $369 |
| Rate | -1.0pp $321 | -0.5pp $273 | base $223 | +0.5pp $173 | +1.0pp $121 |
UW: 25.0% down · 7.5% · 30yr · 1.5% tax · 5.0% vac · 8.0% maint · 8.0% mgmt
Financing live
Cash to close
- Down payment
- $48,625
- Closing costs
- $5,835
- Reserves months
- —
- Total cash needed
- —
Loan-product check · same deal, 3 products live
Conventional
25% down · 7.5% · 30yr
- Down + closing
- —
- Monthly P&I
- —
- Monthly cashflow
- —
- DSCR
- —
- Eligible?
- —
Personal DTI + credit; lowest rate.
DSCR
20% down · 8.5% · 30yr
- Down + closing
- —
- Monthly P&I
- —
- Monthly cashflow
- —
- DSCR
- —
- Eligible?
- —
No personal income docs; deal must DSCR.
Hard money
10% down · 12.0% · 12mo
- Down + closing
- —
- Monthly P&I
- —
- Monthly cashflow
- —
- DSCR
- —
- Eligible?
- —
Short-term bridge; refi at stabilization.
Rent comps 9 comps
| Address | Beds | Baths | Sqft | Rent | $/sqft | DOM | Units | Dist |
|---|---|---|---|---|---|---|---|---|
| 101 Vanderbilt Rd Pensacola, FL | 3.0 | 2.0 | 1104 | $1,850 | $1.68 | 22d | 1 | 0.57mi |
| 4519 Martha Ave Pensacola, FL | 3.0 | 1.0 | 1104 | $1,600 | $1.45 | 24d | 1 | 0.92mi |
| 221 Edison Dr Pensacola, FL | 3.0 | 1.0 | 1500 | $1,598 | $1.07 | 24d | 1 | 1.00mi |
| 3216 Two Sisters Way Pensacola, FL | 3.0 | 2.0 | 1117 | $1,700 | $1.52 | 24d | 1 | 1.13mi |
| 2702 Massachusetts Ave Pensacola, FL | 1.0–3.0 | 1.0–2.5 | 1150 | $1,745 | $1.52 | 14d | 9 | 1.15mi |
| 3296 Two Sisters Way Pensacola, FL | 4.0 | 2.5 | 1856 | $1,795 | $0.97 | 24d | 1 | 1.17mi |
| 5501 Mayfair Dr Pensacola, FL | 3.0 | 1.0 | 912 | $1,295 | $1.42 | 24d | 1 | 1.28mi |
| 1860 Broyhill Ln Pensacola, FL | 3.0 | 2.0 | 1561 | $1,600 | $1.02 | 24d | 1 | 1.32mi |
| 3230 Palmdale Ave Pensacola, FL | 3.0 | 2.0 | 1300 | $1,500 | $1.15 | 24d | 1 | 1.34mi |
Listing history 34 events
-
2026-05-13status Pending
-
2026-03-10status Active
-
2026-02-24status Pending
-
2026-02-18price $194,500
-
2025-12-08status Active
-
2025-10-20status Pending
-
2025-10-02$199,500 Active
-
2025-06-04historical
-
2025-05-13price $209,000
-
2025-05-13price $209,000
-
2025-03-31$219,000 Active
-
2025-03-31$219,000 Active
-
2024-09-12historical
-
2024-08-06price $165,000
-
2024-08-01price $165,000
-
2024-08-01price $165,000
-
2024-07-06price $175,000
-
2024-07-03price $175,000
-
2024-07-03price $175,000
-
2024-06-14price $189,000
-
2024-06-14price $189,000
-
2024-06-14price $189,000
-
2024-06-02$199,000 Active
-
2024-05-31$199,000 Active
-
2024-05-31$199,000 Active
-
2024-03-09historical
-
2023-10-31price $199,900
-
2023-09-30price $210,000
-
2023-09-08$220,000 Active
-
2011-06-03historical
-
2011-04-04$77,000
-
2004-12-29soldstatus $58,000
-
2002-05-28soldstatus $33,000
-
2001-12-21$34,900
ⓘ Source: listings_history table (triggers on properties + properties_extension) + one-shot
backfill from property_details.listing_events for pre-trigger history.
Tax reassessment forecast FL · Resets to sale price
- Current annual tax
- $1,597 · $133/mo
- Projected year-2 tax
- $1,614 · $135/mo
- Expected delta
- +$17/yr (+$1/mo · 1.1%)
ⓘ Screening estimate from a state-policy table — verify with the county assessor before closing.
Climate risk First Street
- Flood 1/10 Low FEMA zone X (unshaded) · 0% chance over 30 yrs
- Wildfire 3/10 Moderate
- Heat 10/10 Extreme 7 d/yr ≥105°F today · 23 d/yr by 30 yrs out
- Wind 9/10 Extreme 99% chance of damaging wind over 30 yrs
- Air quality 1/10 Low 0 unhealthy d/yr today · 0 by 30 yrs out
Nearby sold comps map
Loading sold comps map…
Walkable amenities ~0.75 mi
Loading nearby amenities…
Taxation est. · year 1
- Rental income
- $22,134
- − Mortgage interest
- −$10,895
- − Property taxes
- −$1,597
- − Insurance
- −$972
- − Repairs & maintenance
- −$1,771
- − Management
- −$1,771
- − Depreciation
- −$5,658
- Taxable loss
- −$530
- Est. tax savings @ 24.0%
- +$127
- After-tax cash flow
- $2,804/yr
For passive investors: Depreciation is non-cash, so a rental often shows a tax loss while cash-flowing — sheltering income. Rental losses are passive: they offset passive income freely, and up to $25,000/yr can offset ordinary (W-2) income if you actively participate and your MAGI is under $100k (phasing out to $0 by $150k); unused losses carry forward. On sale, claimed depreciation is recaptured at up to 25%, and gains may owe capital-gains tax (a 1031 exchange can defer both). Figures are a year-1 estimate at your 24.0% rate — not tax advice; consult a CPA.
Schools (NCES district)
- District
- Escambia
- NCES district ID
- 1200510
- Math proficiency
- 40% ▼ -9.00%
- Reading proficiency
- 45% ▼ -4.00%
- Median HH income
- $44,649
- Composite
- 36.04/100
- National rank
- #4773
- State rank
- #56 of 73 in FL
Livability — Myrtle Grove
- Score
- 64/100
- State rank
- #701
- US rank
- #14805
Category grades
Schools grade is shown separately in the Schools card above.
Census & demographics
- Census place
- Myrtle Grove, FL
- County
- Escambia County · 301,722 people
- City population
- 1,170
- Metro
- Pensacola-Ferry Pass-Brent, FL
- Population (ZIP)
- 34,549
- Household income
- $62,486
- Rent vs Own
- Severe rent burden
- 1359.0
Population outlook (Escambia County) Hauer SSP2
- Today (2025)
- 334,637 people
- By 2030
- 345,779 · +3.3%
- By 2040
- 364,828 · +9.0%
- By 2050
- 378,514 · +13.1%
- By 2075
- 403,220 · +20.5%
- By 2100
- 386,125 · +15.4%
Race, ethnicity, and origin ACS 2023
- Neighborhood character
- Diverse neighborhood (Simpson 0.60)
- Race & ethnicity
- White 60% Black 18% Two or more races 11% Hispanic / Latino 6% Asian 6%
- Hispanic origin (detail)
- Mexican 3%
- Common ancestry
- Lithuanian 4% Slovak 2% Italian 2%
- Foreign-born
- 9% · Canada, China, Vietnam
- Languages at home
- 89% English-only · Spanish 4% Tagalog/Filipino 2% Other Indo-European 1%
Political lean MEDSL · Escambia
- 2024 margin
- R (+19.5) · D 39.7% · R 59.2% · Other 1.1%
- 2008→2024 swing
- -0.2pp no change · 2008: -19.3pp · 2024: -19.5pp
- All cycles
- 2024: R+19.5 2020: R+15.1 2016: R+20.6 2012: R+20.6 2008: R+19.3
Not yet ingested
- Civics
- —
Market trends
- HPI YoY
- ▼ -71.86%
- Current HPI
- 247.6085
- Rent YoY
- ▲ 3.85%
- Metro
- Pensacola-Ferry Pass-Brent, FL
- State GDP YoY
- ▲ 3.28%
- F500 in state
- 36
Industry mix (Fortune 500 HQ in FL)
| Industry | F500 HQs | Revenue |
|---|---|---|
| Industrial Technology | 2 | $29B |
|
||
| Insurance | 2 | $17B |
|
||
| Retail | 1 | $60B |
|
||
| Technology Distribution | 1 | $58B |
|
||
| Homebuilding | 1 | $35B |
|
||
| Technology Manufacturing | 1 | $35B |
|
||
Price history
+457.3% since first listed34 events — show timeline
- 2026-05-13 Pending — PARMLS
- 2026-03-10 Relisted — PARMLS
- 2026-02-24 Pending — PARMLS
- 2026-02-18 Price Changed $194,500 PARMLS
- 2025-12-08 Relisted — PARMLS
- 2025-10-20 Pending — PARMLS
- 2025-10-02 Listed $199,500 PARMLS
- 2025-06-04 Listing Removed — PARMLS
- 2025-05-13 Price Changed $209,000 PARMLS
- 2025-05-13 Price Changed $209,000 BCAR
- 2025-03-31 Listed $219,000 BCAR
- 2025-03-31 Listed $219,000 PARMLS
- 2024-09-12 Listing Removed — PARMLS
- 2024-08-06 Price Changed $165,000 PARMLS
- 2024-08-01 Price Changed $165,000 ECAR
- 2024-08-01 Price Changed $165,000 CPARMLS
- 2024-07-06 Price Changed $175,000 PARMLS
- 2024-07-03 Price Changed $175,000 ECAR
- 2024-07-03 Price Changed $175,000 CPARMLS
- 2024-06-14 Price Changed $189,000 ECAR
- 2024-06-14 Price Changed $189,000 PARMLS
- 2024-06-14 Price Changed $189,000 CPARMLS
- 2024-06-02 Listed $199,000 ECAR
- 2024-05-31 Listed $199,000 PARMLS
- 2024-05-31 Listed $199,000 CPARMLS
- 2024-03-09 Listing Removed — PARMLS
- 2023-10-31 Price Changed $199,900 PARMLS
- 2023-09-30 Price Changed $210,000 PARMLS
- 2023-09-08 Listed $220,000 PARMLS
- 2011-06-03 Listing Removed — PARMLS
- 2011-04-04 Listed $77,000 PARMLS
- 2004-12-29 Sold (Public Records) $58,000 Public Records
- 2002-05-28 Sold (MLS) $33,000 PARMLS
- 2001-12-21 Listed $34,900 PARMLS
Property tax history
+12.6%/yrLatest (2025): $1,597 · +220.3% YoY. Source: county tax records.
Cash-flow waterfall
monthlySold comps — $/sqft
last 12 mo · ≤1 miLoading sold comps…