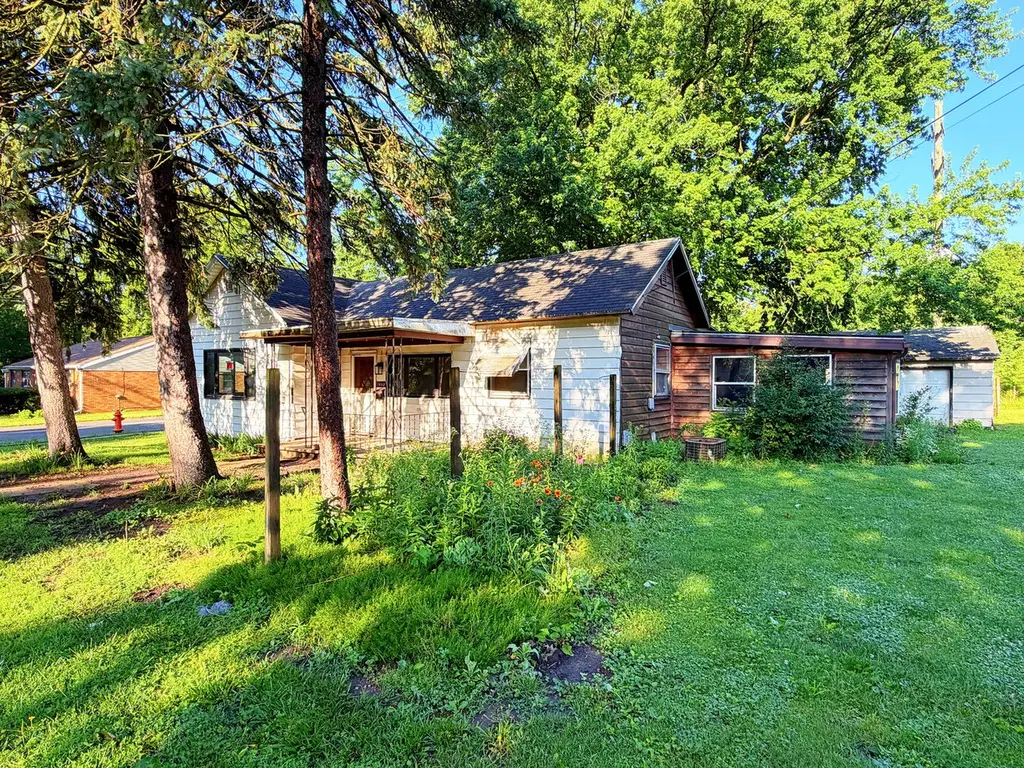
1402 N Sterling St · Streator, IL
Flood risk 1/10 · Minimal
- FEMA flood zone
- X (unshaded)
- Chance of flooding over 30 yrs
- 0.0%
- Est. flood insurance / yr
- $473 – $860
Fire risk 1/10 · Minimal
- Est. fire insurance / yr
- $804 – $1,492
Heat risk 3/10 · Minor
- Hot days now (above 104°F)
- 7 days/yr
- Hot days in 30 yrs
- 17 days/yr
Wind risk 2/10 · Minimal
- Chance of severe wind over 30 yrs
- 1.0%
Air-quality risk 2/10 · Minimal
- Unhealthy air days now
- 1 days/yr
- Unhealthy air days in 30 yrs
- 1 days/yr
Risk factors via First Street. Map © Google.
Why this score? — see what drove the B grade
The composite is a weighted blend of 9 inputs, each scored 0–100. Each bar is that input's sub-score; the figure is the points it added to the 100-point composite (weight × sub-score).
- Cash flow +30.0/30.0
- ARV discount +15.0/15.0
- 1% rule +10.0/10.0
- DSCR +10.0/10.0
- Livability +3.2/5.0
- Rent growth +2.5/5.0
- Condition / age +2.5/5.0
- Schools +1.3/10.0
- Appreciation +0.0/10.0
$94,900
🖨 Deal sheet 📄 Offer letter ✓ Due diligence
Listing remarks
Functional 2 bedroom, nearly 1,400 SF home filled with potential and standout amenities, highlighted by an impressive 5 car garage, heated sunroom, and desirable corner lot setting. Inside, you'll find a spacious living room filled with natural light from an abundance of windows. The roomy kitchen offers ample cabinet space, a pantry closet, and dining nook, while the formal dining room provides additional space for gatherings and everyday living. The spacious primary bedroom connects directly to a large heated sunroom, while a second bedroom and updated full bathroom complete the main level. The usable basement adds valuable storage space and functionality. Outside, enjoy the covered front
Key facts
- Covered front porch
- 5 car garage
- Heated sunroom
Tags
Property features AI
Finance
- Other: Ownership is fee simple; School bus service available
- HOA & community: No master association fee required; Community features include sidewalks, street lights, and paved streets
Exterior
- Parking: Detached garage (owned) with garage door opener; Tandem configuration; Asphalt parking; Total of 5 parking spaces (5 garage spaces)
- Utilities: Public water; Public sewer
- Home design: Detached single-family home; One-story
- Construction: Steel and wood siding; Asphalt roof; Brick/mortar foundation; Property is more than 100 years old; Built before 1978
- Exterior features: Patio; Corner lot
Interior
- Kitchen: Kitchen with eating area, pantry/closet
- Bedrooms: Two bedrooms (both on the main level); Master bedroom on the main level
- Flooring: Carpet in living room and dining room; Carpet in one bedroom; Wood laminate in master bedroom; Vinyl flooring in kitchen, eating area, and laundry; Heated sun room (flooring not specified)
- Bathrooms: One full bathroom
- Heating & cooling: Natural gas forced air heating; Central air conditioning
- Interior features: Seven total rooms; Basement is partial and unfinished; Separate dining room; Heated sun room (main level)
- Laundry & utility: Main-level laundry room
Neighborhood map
What this means for you Summary
Snapshot
- This is a 2-bed/1.0-bath single-family listed at $95k.
Deal economics
- At list price, monthly cash flow is $461 ($6k/yr) — positive.
- The deal already cash-flows at list — no discount required.
- Meets the 1% rule at list price ($2k rent vs $95k).
- Cap rate 12.1% vs local median 7.8% in Streator — top-decile yield for the area; either an underpriced asset or a hidden risk that comps aren't pricing in. Stress-test before assuming the spread holds.
Location & tenants
- Location reads 63/100 on livability (#752 in IL) — a middle-class / working-renter tenant base. Strengths: cost of living A+, health & safety A+, housing B+; Watch: amenities F, commute F, employment F.
- Streator Twp Hsd 40 (town): math 11% / reading 19% proficiency, ranked #513 of 620 in IL (top 83%) — low school quality limits family demand, transient renter base, plan for 1-2y turnover.
- Zoned schools: Streator Twp High School (math 11% / reading 19%, grade F, #462 of 693 statewide, top 68%, 809 students, 0% FRL).
- Market conditions: 87 active listings in the ZIP; 4 comparable units currently listed for rent nearby; rentals at typical pace (median 22d on market — plan ~3-4 weeks tenant-placement turnaround); 82 units permitted in LaSalle County in 2024 (0 in 5+ unit buildings).
- This rent runs 31% of the median local income ($59k/yr) — at the standard rent-burdened threshold; future hikes will face affordability resistance.
Forward outlook
- Local home prices are declining (-3.0%/yr); year-one equity from $656 of loan paydown is wiped out by about $3k of value loss. Plan a longer hold.
- LaSalle County population projected at -16% by 2050 — secular population decline; favor cash flow + early exit over multi-decade hold.
- At projected returns (-3.0% appreciation + 3.0% rent growth), your $27k cash investment doubles in ~6 years — after that, you're playing with house money.
Negotiation context
- Only 7 days on market — expect competitive offers; lowballing is unlikely to land.
- 2 sale attempts since 12y ago with the ask held roughly flat each time — persistent listings suggest the price (not the market) is what's stuck; bring a comps-based counter.
Risks & watch-outs
- Watch-outs: property tax is 2.5% of price; built in 1914 — expect roof / HVAC / electrical / plumbing capex.
Questions for the listing agent
- Built in 1914 — when were the roof, HVAC, electrical panel, plumbing, and water heater last replaced?
- Property tax is high relative to price — has the assessment been appealed recently, and will the sale trigger a re-assessment?
- Is there a deadline driving the sale (1031 exchange, divorce, estate, relocation)? That informs how much negotiation room exists.
- Schools are F-rated, which usually means shorter tenancies and higher turnover. Who's the typical renter profile here, and what's been the actual vacancy rate?
- What's the average days-on-market for RENTAL listings here right now (not sales)? A rising rental-DOM trend means longer vacancies and softer asking-rent achievability than the comps imply.
- What's the recent tenant-quality profile in this submarket — average credit score on applications, eviction rate, late-payment / NSF rate, and stable-employment percentage? A property-management company in the area should have these aggregated.
- How much new for-sale + rental construction is in the pipeline within 1–3 miles? Heavy new supply typically softens prices + rents 12–24 months out; constrained supply supports both.
Investment metrics
- 1% rule
- 1.60% ✓
- Cap rate
- 12.13%
- Cash-on-cash
- 20.83%
- DSCR
- 1.93
- GRM
- 5.2
CMA / ARV
- ARV (on-the-fly)
- $153,567
- Comps found
- 12
Show comp detail 12 sales within ~0.75 mi
| Address | Dist | Beds/Ba | Sqft | Sold | Price | $/sf | Match |
|---|---|---|---|---|---|---|---|
| 307 E Bronson St | 0.29mi | 2/1.0 | 1,236 (-9%) | 4mo | $5,000 | $4 | 68 |
| 1002 N Park St | 0.41mi | 3/1.5 (+1) | 1,454 (+7%) | 1mo | $155,000 | $107 | 62 |
| 908 N Park St | 0.44mi | 2/1.0 | 1,451 (+7%) | 10mo | $100,000 | $69 | 60 |
| 504 Elizabeth St | 0.48mi | 3/2.0 (+1) | 1,404 (+3%) | 5mo | $251,000 | $179 | 59 |
| 904 N Vermillion St | 0.41mi | 3/1.5 (+1) | 1,240 (-9%) | 6mo | $155,000 | $125 | 54 |
| 616 N Everett St | 0.62mi | 3/2.0 (+1) | 1,314 (-3%) | 7mo | $149,000 | $113 | 51 |
| 807 N Park St | 0.50mi | 2/1.0 | 1,160 (-15%) | 6mo | $104,000 | $90 | 48 |
| 914 Laura Ave | 0.45mi | 3/1.5 (+1) | 1,498 (+10%) | 11mo | $225,000 | $150 | 46 |
| 305 W 3rd St | 0.60mi | 3/1.0 (+1) | 1,205 (-11%) | 8mo | $150,000 | $124 | 42 |
| 1019 Polk St | 0.63mi | 2/1.0 | 1,190 (-12%) | 10mo | $78,000 | $66 | 41 |
| 703 Iowa Ave | 0.73mi | 3/1.5 (+1) | 1,215 (-11%) | 4mo | $148,000 | $122 | 38 |
| 305 W Grant St | 0.64mi | 3/1.0 (+1) | 1,172 (-14%) | 8mo | $105,000 | $90 | 36 |
Match score weights: distance 35% · size 25% · config 20% · recency 20%. Top-matched comps best support the ARV.
Projected returns pro-forma
-3.0% appreciation · 3.0% rent growth · sell at horizon
- IRR
- 13.3%
- Equity multiple
- 1.53×
- Total profit
- $14,071
- Equity at exit
- $14,150
- IRR
- 22.2%
- Equity multiple
- 2.90×
- Total profit
- $50,372
- Equity at exit
- $8,205
Cash invested: $26,572 (down + closing). Projections, not guarantees.
Landlord ↔ Tenant lean methodology
- Overall (STATE)
- 43 Moderately Tenant-Leaning
- State Illinois
- 43 Moderately Tenant-Leaning · D+7
- County
- — inherits STATE
- City
- — inherits STATE
ZIP-level market 61364
- Home prices YoY
- -31.1%
- Active inventory
- 87
- Price-to-rent
- 5.2×
Monthly cashflow live
- Estimated rent
- $1,514 medium interval (Pro) →
- Mortgage (P&I)
- −$498
- Tax from tax record
- −$198 /mo · $2,376/yr
- Insurance
- −$40
- HOA
- −$0
- Vacancy / Maint / Mgmt
- −$318
- Net cashflow
- $461
Break-even live
UW: 25.0% down · 7.5% · 30yr · 1.5% tax · 5.0% vac · 8.0% maint · 8.0% mgmt
Financing live
Cash to close
- Down payment
- $23,725
- Closing costs
- $2,847
- Reserves months
- —
- Total cash needed
- —
Loan-product check · same deal, 3 products live
Conventional
25% down · 7.5% · 30yr
- Down + closing
- —
- Monthly P&I
- —
- Monthly cashflow
- —
- DSCR
- —
- Eligible?
- —
Personal DTI + credit; lowest rate.
DSCR
20% down · 8.5% · 30yr
- Down + closing
- —
- Monthly P&I
- —
- Monthly cashflow
- —
- DSCR
- —
- Eligible?
- —
No personal income docs; deal must DSCR.
Hard money
10% down · 12.0% · 12mo
- Down + closing
- —
- Monthly P&I
- —
- Monthly cashflow
- —
- DSCR
- —
- Eligible?
- —
Short-term bridge; refi at stabilization.
Rent comps 4 comps
| Address | Beds | Baths | Sqft | Rent | $/sqft | DOM | Units | Dist |
|---|---|---|---|---|---|---|---|---|
| 1409 Kelly St Streator, IL | 3.0 | 1.0 | 1280 | $1,750 | $1.37 | 7d | 1 | 0.49mi |
| 402 S Illinois St Streator, IL | 2.0 | 1.0 | 1116 | $1,550 | $1.39 | 22d | 1 | 1.37mi |
| 514 Lundy St Streator, IL | 3.0 | 1.0 | 1174 | $1,700 | $1.45 | 4d | 1 | 1.41mi |
| 503 S Bloomington St Streator, IL | 3.0 | 1.0 | 1200 | $1,500 | $1.25 | 24d | 1 | 1.46mi |
Listing history 7 events
-
2026-06-19days on market $94,900 Active 7 DOM
-
2026-06-18days on market $94,900 Active 6 DOM
-
2026-06-17days on market $94,900 Active 5 DOM
-
2026-06-16days on market $94,900 Active 4 DOM
-
2026-06-15days on market $94,900 Active 3 DOM
-
2026-06-13remarks 699-char remark
-
2026-06-13$94,900 Active 1 DOM
ⓘ Source: listings_history table (triggers on properties + properties_extension) + one-shot
backfill from property_details.listing_events for pre-trigger history.
Tax reassessment forecast IL · Partial reset (capped growth)
- Current annual tax
- $2,376 · $198/mo
- Projected year-2 tax
- $2,376 · $198/mo
- Expected delta
- $0/yr ($0/mo · 0.0%)
ⓘ Screening estimate from a state-policy table — verify with the county assessor before closing.
Climate risk First Street
- Flood 1/10 Low FEMA zone X (unshaded) · 0% chance over 30 yrs
- Wildfire 1/10 Low
- Heat 3/10 Moderate 7 d/yr ≥104°F today · 17 d/yr by 30 yrs out
- Wind 2/10 Low 100% chance of damaging wind over 30 yrs
- Air quality 2/10 Low 1 unhealthy d/yr today · 1 by 30 yrs out
Nearby sold comps map
Loading sold comps map…
Walkable amenities ~0.75 mi
Loading nearby amenities…
Taxation est. · year 1
- Rental income
- $18,174
- − Mortgage interest
- −$5,316
- − Property taxes
- −$2,376
- − Insurance
- −$474
- − Repairs & maintenance
- −$1,454
- − Management
- −$1,454
- − Depreciation
- −$2,761
- Taxable income
- $4,339
- Est. tax owed @ 24.0%
- −$1,041
- After-tax cash flow
- $4,494/yr
For passive investors: Depreciation is non-cash, so a rental often shows a tax loss while cash-flowing — sheltering income. Rental losses are passive: they offset passive income freely, and up to $25,000/yr can offset ordinary (W-2) income if you actively participate and your MAGI is under $100k (phasing out to $0 by $150k); unused losses carry forward. On sale, claimed depreciation is recaptured at up to 25%, and gains may owe capital-gains tax (a 1031 exchange can defer both). Figures are a year-1 estimate at your 24.0% rate — not tax advice; consult a CPA.
Schools (NCES district)
- District
- Streator Twp Hsd 40
- NCES district ID
- 1738100
- Math proficiency
- 11% ▼ -4.00%
- Reading proficiency
- 19% ▼ -1.00%
- Median HH income
- $43,002
- Composite
- 13.07/100
- National rank
- #9561
- State rank
- #513 of 620 in IL
Livability — Streator
- Score
- 63/100
- State rank
- #752
- US rank
- #15266
Category grades
Schools grade is shown separately in the Schools card above.
Census & demographics
- Census place
- Streator, IL
- County
- La Salle County · 41,676 people
- City population
- 17,963
- Metro
- Ottawa, IL
- Population (ZIP)
- 17,963
- Household income
- $59,060
- Rent vs Own
- Severe rent burden
- 450.0
Population outlook (LaSalle County) Hauer SSP2
- Today (2025)
- 107,080 people
- By 2030
- 104,196 · -2.7%
- By 2040
- 97,413 · -9.0%
- By 2050
- 90,294 · -15.7%
- By 2075
- 76,252 · -28.8%
- By 2100
- 61,339 · -42.7%
Race, ethnicity, and origin ACS 2023
- Neighborhood character
- Predominantly White (83%)
- Race & ethnicity
- White 83% Hispanic / Latino 11% Two or more races 4% Black 3%
- Hispanic origin (detail)
- Mexican 10%
- Common ancestry
- Romanian 3% Lithuanian 2% Slovak 2%
- Foreign-born
- 3% · Canada
- Languages at home
- 93% English-only · Spanish 6%
Political lean MEDSL · LaSalle
- 2024 margin
- R (+18.5) · D 40.1% · R 58.6% · Other 1.3%
- 2008→2024 swing
- -29.6pp toward R · 2008: 11.1pp · 2024: -18.5pp
- All cycles
- 2024: R+18.5 2020: R+14.3 2016: R+14.4 2012: R+0.4 2008: D+11.1
Not yet ingested
- Civics
- —
Market trends
- HPI YoY
- ▼ -105.28%
- Current HPI
- 233.5533
- Rent YoY
- —
- Metro
- Ottawa, IL
- State GDP YoY
- ▲ 1.59%
- F500 in state
- 60
Industry mix (Fortune 500 HQ in IL)
| Industry | F500 HQs | Revenue |
|---|---|---|
| Insurance | 4 | $201B |
|
||
| Consumer Goods | 4 | $87B |
|
||
| Industrial Machinery | 3 | $64B |
|
||
| Healthcare | 2 | $55B |
|
||
| Retail / Pharmacy | 1 | $148B |
|
||
| Agriculture / Food | 1 | $86B |
|
||
Price history
3 events — show timeline
- 2026-06-12 Listed $94,900 MRED as Distributed by MLS Grid
- 2015-01-31 Listing Removed — MRED as Distributed by MLS Grid
- 2014-01-15 Listed — MRED as Distributed by MLS Grid
Property tax history
+4.1%/yrLatest (2024): $2,376 · +15.2% YoY. Source: county tax records.
Cash-flow waterfall
monthlySold comps — $/sqft
last 12 mo · ≤1 miLoading sold comps…