1713 E Tucker St · Fort Worth, TX
Flood risk 1/10 · Minimal
- FEMA flood zone
- X (unshaded)
- Chance of flooding over 30 yrs
- 0.0%
- Est. flood insurance / yr
- $507 – $1,088
Fire risk 1/10 · Minimal
- Est. fire insurance / yr
- $1,222 – $2,270
Heat risk 8/10 · Major
- Hot days now (above 109°F)
- 7 days/yr
- Hot days in 30 yrs
- 23 days/yr
Wind risk 4/10 · Minor
- Chance of severe wind over 30 yrs
- 24.0%
Air-quality risk 3/10 · Minor
- Unhealthy air days now
- 3 days/yr
- Unhealthy air days in 30 yrs
- 4 days/yr
Risk factors via First Street. Map © Google.
Why this score? — see what drove the B- grade
The composite is a weighted blend of 9 inputs, each scored 0–100. Each bar is that input's sub-score; the figure is the points it added to the 100-point composite (weight × sub-score).
- Cash flow +30.0/30.0
- 1% rule +10.0/10.0
- DSCR +10.0/10.0
- ARV discount +7.5/15.0
- Livability +4.0/5.0
- Rent growth +2.5/5.0
- Condition / age +2.5/5.0
- Schools +2.0/10.0
- Appreciation +0.0/10.0
$97,000
🖨 Deal sheet (PDF) 📄 Offer letter ✓ Due diligence
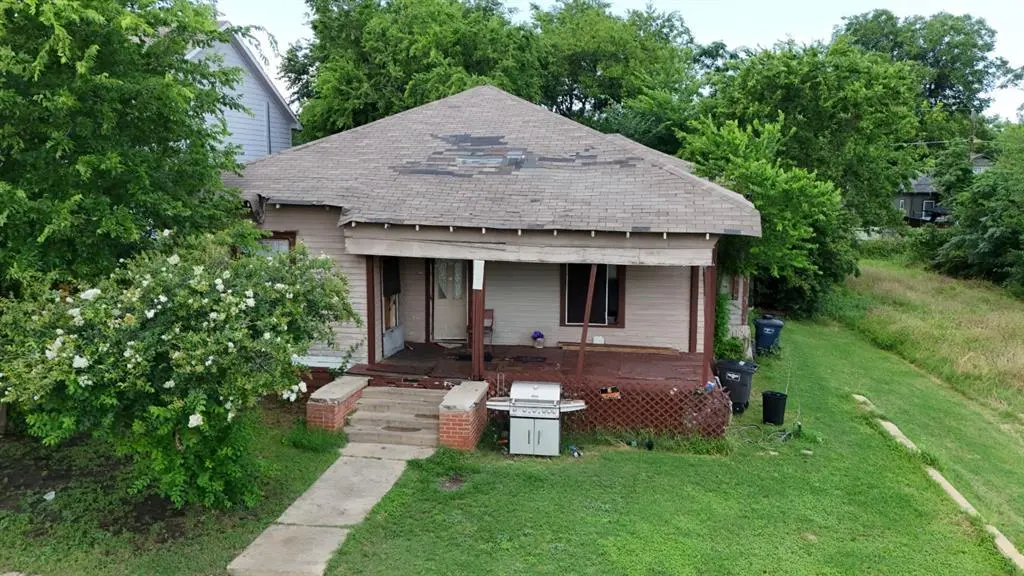
Listing remarks
Come make it what you are looking for, READY FOR A REMOVEL!!!!!!!! The house needs repair, the value is in the land and having utilities. The house allows a starting point with utilities in place. Be careful walking in the house. Some of the porch boards are soft and the condition of the house flooring is unknown.
Key facts
- 6,273 sq ft lot
- Built 1925
- Listed 13 days
Property features AI
Finance
- Financial info: Listing accepts Cash, Conventional, and 1031 Exchange
- HOA & community: No association
Exterior
- Parking: No garage; On-street parking; No carport
- Utilities: City water; City sewer; Not in a municipal utility district
- Home design: Single family residence; Residential property; Built in 1925; Pillar/post/pier foundation
- Construction: Siding exterior; Shingle roof
- Exterior features: Covered porch; Covered patio/porch
Interior
- Kitchen: No appliances included
- Bedrooms: 3 bedrooms (all on the main level)
- Flooring: Hardwood floors
- Bathrooms: 1 full bathroom
- Interior features: Natural woodwork; Paneling; One living area; One dining area; One level (single story)
- Laundry & utility: No laundry appliances listed
Neighborhood map
What this means for you Summary
Snapshot
- This is a 3-bed/1.0-bath single-family listed at $97k.
Deal economics
- At list price, monthly cash flow is $979 ($12k/yr) — positive.
- The deal already cash-flows at list — no discount required.
- Meets the 1% rule at list price ($2k rent vs $97k).
- Cap rate 18.4% vs local median 3.9% in Fort Worth — top-decile yield for the area; either an underpriced asset or a hidden risk that comps aren't pricing in. Stress-test before assuming the spread holds.
Location & tenants
- Location reads 80/100 on livability (#49 in TX, #1,954 nationally) — a professional / high-income tenant draw. Strengths: amenities A+, cost of living A+, housing A+; Watch: crime F.
- Fort Worth ISD (urban): math 18% / reading 28% proficiency, ranked #742 of 826 in TX (top 90%) — low school quality limits family demand, transient renter base, plan for 1-2y turnover; 73% free/reduced lunch — lower-income household profile, screen leases tightly.
- Zoned schools: Van Zandt-Guinn El (math 12% / reading 22%, grade F, #3,836 of 4,322 statewide, top 91%, 338 students, 97% FRL) — zoned schools average 97% FRL vs 73% district-wide (24 pts higher); higher-poverty schools than district average — tighter screening recommended.
- Market conditions: Rents flat; 176 active listings in the ZIP; 40 comparable units currently listed for rent nearby; rentals at typical pace (median 22d on market — plan ~3-4 weeks tenant-placement turnaround); 18,938 units permitted in Tarrant County in 2024 (8,336 in 5+ unit buildings).
- This rent runs 41% of the median local income ($62k/yr) — at the standard rent-burdened threshold; future hikes will face affordability resistance.
Forward outlook
- Local home prices are declining (-3.0%/yr); year-one equity from $671 of loan paydown is wiped out by about $3k of value loss. Plan a longer hold.
- Tarrant County population projected at +41% by 2050 — long-run rental-demand tailwind backs the buy-and-hold thesis.
- At projected returns (-3.0% appreciation + 0.1% rent growth), your $27k cash investment doubles in ~3 years — after that, you're playing with house money.
Negotiation context
- Only 13 days on market — expect competitive offers; lowballing is unlikely to land.
Risks & watch-outs
- Watch-outs: built in 1925 — expect roof / HVAC / electrical / plumbing capex.
- Climate carrying-cost: extreme-heat days projected 7→23/yr by 2055 (HVAC capex compounding) — expect insurance premiums to compound above CPI over the hold.
Questions for the listing agent
- Built in 1925 — when were the roof, HVAC, electrical panel, plumbing, and water heater last replaced?
- Is there a deadline driving the sale (1031 exchange, divorce, estate, relocation)? That informs how much negotiation room exists.
- Schools are D-rated, which usually means shorter tenancies and higher turnover. Who's the typical renter profile here, and what's been the actual vacancy rate?
- Crime grade is F in this area — have there been break-ins, vandalism, or insurance claims at this property in the last 3 years? What carrier currently insures it and at what premium?
- What's the average days-on-market for RENTAL listings here right now (not sales)? A rising rental-DOM trend means longer vacancies and softer asking-rent achievability than the comps imply.
- What's the recent tenant-quality profile in this submarket — average credit score on applications, eviction rate, late-payment / NSF rate, and stable-employment percentage? A property-management company in the area should have these aggregated.
- How much new for-sale + rental construction is in the pipeline within 1–3 miles? Heavy new supply typically softens prices + rents 12–24 months out; constrained supply supports both.
Investment metrics
- 1% rule
- 2.15% ✓
- Cap rate
- 18.40%
- Cash-on-cash
- 43.25%
- DSCR
- 2.92
- GRM
- 3.9
CMA / ARV
- ARV (on-the-fly)
- $274,512
- Comps found
- 12
Show comp detail 12 sales within ~0.75 mi
| Address | Dist | Beds/Ba | Sqft | Sold | Price | $/sf | Match |
|---|---|---|---|---|---|---|---|
| 928 Ash Crescent St | 0.39mi | 4/2.0 (+1) | 1,600 (+0%) | 1mo | $249,000 | $156 | 71 |
| 1411 E Terrell | 0.35mi | 4/2.0 (+1) | 1,585 (-1%) | 8mo | $285,000 | $180 | 66 |
| 1906 Avenue B | 0.37mi | 3/2.0 | 1,732 (+8%) | 3mo | $270,000 | $156 | 62 |
| 1237 E Terrell Ave | 0.45mi | 3/2.0 | 1,506 (-6%) | 5mo | $205,000 | $136 | 62 |
| 1125 E Humbolt St | 0.58mi | 4/2.0 (+1) | 1,630 (+2%) | 5mo | $299,000 | $183 | 57 |
| 1513 Irma St | 0.60mi | 3/2.0 | 1,534 (-4%) | 8mo | $225,000 | $147 | 54 |
| 1422 E Magnolia Ave | 0.72mi | 3/2.0 | 1,583 (-1%) | 10mo | $295,500 | $187 | 53 |
| 2908 Yellow Pine Ave | 0.56mi | 4/2.0 (+1) | 1,667 (+4%) | 9mo | $272,949 | $164 | 50 |
| 2916 Yellow Pine Ave | 0.56mi | 3/2.0 | 1,474 (-8%) | 10mo | $277,249 | $188 | 49 |
| 708 Mccurdy St | 0.38mi | 4/2.5 (+1) | 1,783 (+12%) | 8mo | $334,999 | $188 | 45 |
| 1209 E Annie St | 0.44mi | 4/2.0 (+1) | 1,800 (+13%) | 10mo | $300,000 | $167 | 41 |
| 1024 E Daggett Ave | 0.65mi | 3/2.5 | 1,451 (-9%) | 11mo | $249,000 | $172 | 39 |
Match score weights: distance 35% · size 25% · config 20% · recency 20%. Top-matched comps best support the ARV.
Projected returns pro-forma
-3.0% appreciation · 0.05% rent growth · sell at horizon
- IRR
- 36.7%
- Equity multiple
- 2.50×
- Total profit
- $40,654
- Equity at exit
- $14,463
- IRR
- 41.8%
- Equity multiple
- 4.41×
- Total profit
- $92,577
- Equity at exit
- $8,387
Cash invested: $27,160 (down + closing). Projections, not guarantees.
Landlord ↔ Tenant lean methodology
- Overall (STATE)
- 87 Strongly Landlord-Friendly
- State Texas
- 87 Strongly Landlord-Friendly · R+5
- County
- — inherits STATE
- City
- — inherits STATE
ZIP-level market 76104
- Home prices YoY
- -11.6%
- Rents YoY
- 0.1%
- Active inventory
- 176
- Price-to-rent
- 3.9×
Monthly cashflow live
- Estimated rent
- $2,082 high interval (Pro) →
- Mortgage (P&I)
- −$509
- Tax from tax record
- −$117 /mo · $1,401/yr
- Insurance
- −$40
- HOA
- −$0
- Vacancy / Maint / Mgmt
- −$437
- Net cashflow
- $979
Break-even live
Sensitivity live
| Price | -10% $1,034 | -5% $1,006 | +0% $979 | +5% $951 | +10% $924 |
|---|---|---|---|---|---|
| Rent | -10% $814 | -5% $897 | +0% $979 | +5% $1,061 | +10% $1,143 |
| Rate | -1.0pp $1,028 | -0.5pp $1,004 | base $979 | +0.5pp $954 | +1.0pp $928 |
UW: 25.0% down · 7.5% · 30yr · 1.5% tax · 5.0% vac · 8.0% maint · 8.0% mgmt
Financing live
Cash to close
- Down payment
- $24,250
- Closing costs
- $2,910
- Reserves months
- —
- Total cash needed
- —
Loan-product check · same deal, 3 products live
Conventional
25% down · 7.5% · 30yr
- Down + closing
- —
- Monthly P&I
- —
- Monthly cashflow
- —
- DSCR
- —
- Eligible?
- —
Personal DTI + credit; lowest rate.
DSCR
20% down · 8.5% · 30yr
- Down + closing
- —
- Monthly P&I
- —
- Monthly cashflow
- —
- DSCR
- —
- Eligible?
- —
No personal income docs; deal must DSCR.
Hard money
10% down · 12.0% · 12mo
- Down + closing
- —
- Monthly P&I
- —
- Monthly cashflow
- —
- DSCR
- —
- Eligible?
- —
Short-term bridge; refi at stabilization.
Rent comps 40 comps
| Address | Beds | Baths | Sqft | Rent | $/sqft | DOM | Units | Dist |
|---|---|---|---|---|---|---|---|---|
| 1521 E Cannon St Fort Worth, TX | 2.0 | 2.0 | 1140 | $1,600 | $1.40 | 45d | 1 | 0.27mi |
| 1601 E Leuda St Fort Worth, TX | 3.0 | 2.0 | 1197 | $1,750 | $1.46 | 45d | 1 | 0.28mi |
| 1228 E Leuda St Fort Worth, TX | 3.0 | 2.0 | 1388 | $2,100 | $1.51 | 45d | 1 | 0.47mi |
| 1501 Avenue E Fort Worth, TX | 4.0 | 2.5 | 1650 | $2,195 | $1.33 | 17d | 1 | 0.52mi |
| 1032 E Tucker St Fort Worth, TX | 3.0 | 2.0 | 1796 | $2,100 | $1.17 | 17d | 1 | 0.60mi |
| 2101 E Rosedale St Unit 201 Fort Worth, TX | 3.0 | 3.5 | 2159 | $3,399 | $1.57 | 45d | 1 | 0.65mi |
| 1017 E Humbolt St Fort Worth, TX | 2.0 | 2.0 | 1400 | $1,550 | $1.11 | 45d | 1 | 0.73mi |
| 1605 E Morphy St Fort Worth, TX | 3.0 | 2.0 | 1090 | $1,425 | $1.31 | 4d | 1 | 0.75mi |
| 921 E Hattie St Unit 1301587P Fort Worth, TX | 3.0 | 3.0 | 1517 | $4,175 | $2.75 | 1d | 1 | 0.76mi |
| 1057 E Oleander St Fort Worth, TX | 3.0 | 2.5 | 1501 | $2,435 | $1.62 | 23d | 1 | 0.82mi |
| 1516 E Maddox Ave Fort Worth, TX | 3.0 | 2.0 | 1485 | $1,895 | $1.28 | 24d | 1 | 0.91mi |
| 1601 Daniel St Fort Worth, TX | 3.0 | 2.0 | 1869 | $1,770 | $0.95 | 1d | 1 | 0.94mi |
| 1701 Belzise Ter Fort Worth, TX | 4.0 | 4.5 | 2234 | $2,800 | $1.25 | 8d | 1 | 0.99mi |
| 1511 Illinois Ave Fort Worth, TX | 4.0 | 2.0 | 1800 | $2,500 | $1.39 | 45d | 1 | 1.05mi |
| 1332 Driess St Fort Worth, TX | 3.0 | 2.0 | 1565 | $1,850 | $1.18 | 19d | 1 | 1.05mi |
| 2735 Purington Ave Unit 201 Fort Worth, TX | 2.0 | 1.0 | 1116 | $1,200 | $1.08 | 26d | 1 | 1.07mi |
| 220 E Broadway Ave Unit 2121 Fort Worth, TX | 2.0 | 2.0 | 1151 | $1,989 | $1.73 | 0d | 1 | 1.11mi |
| 220 E Broadway Ave Unit 257 Fort Worth, TX | 2.0 | 2.0 | 1082 | $1,944 | $1.80 | 45d | 1 | 1.11mi |
| 320 E Broadway Ave Fort Worth, TX | 2.0 | 1.0–2.0 | 861 | $2,089 | $2.42 | 0d | 28 | 1.12mi |
| 2540 Avenue H Fort Worth, TX | 3.0 | 1.0 | 1904 | $1,400 | $0.74 | 8d | 1 | 1.13mi |
| 2540 Avenue H Fort Worth, TX | 3.0 | 1.0 | 1904 | $1,500 | $0.79 | 45d | 1 | 1.13mi |
| 220 E Broadway Ave Fort Worth, TX | 2.0 | 2.0 | 1228 | $2,134 | $1.74 | 26d | 1 | 1.17mi |
| 1327 E Baltimore Ave Fort Worth, TX | 3.0 | 2.0 | 1426 | $1,650 | $1.16 | 26d | 1 | 1.21mi |
| 958 E Allen Ave Fort Worth, TX | 3.0 | 3.0 | 1568 | $4,300 | $2.74 | 45d | 1 | 1.21mi |
| 2104 Daniel St Fort Worth, TX | 3.0 | 2.0 | 1440 | $1,675 | $1.16 | 45d | 1 | 1.23mi |
| 2100 Belzise Ter Fort Worth, TX | 4.0 | 2.5 | 1869 | $1,995 | $1.07 | 1d | 1 | 1.23mi |
| 2108 Belzise Ter Fort Worth, TX | 4.0 | 2.5 | 1869 | $1,950 | $1.04 | 45d | 1 | 1.25mi |
| 2815 Avenue E Fort Worth, TX | 2.0 | 1.0 | 2096 | $1,200 | $0.57 | 26d | 1 | 1.26mi |
| 2120 Belzise Ter Fort Worth, TX | 4.0 | 2.5 | 1869 | $1,945 | $1.04 | 26d | 1 | 1.27mi |
| 2124 Belzise Ter Fort Worth, TX | 4.0 | 2.5 | 1869 | $1,945 | $1.04 | 21d | 1 | 1.27mi |
| 650 S Main St Unit 510 Fort Worth, TX | 2.0 | 2.0 | 1068 | $1,614 | $1.51 | 16d | 1 | 1.31mi |
| 650 S Main St Unit 707 Fort Worth, TX | 2.0 | 2.0 | 1068 | $1,619 | $1.52 | 17d | 1 | 1.31mi |
| 1016 Bryan Ave Unit 102 Fort Worth, TX | 2.0 | 2.5 | 1400 | $2,500 | $1.79 | 26d | 1 | 1.32mi |
| 650 S Main St Fort Worth, TX | 1.0–2.0 | 1.0–2.0 | 944 | $1,799 | $1.91 | 1d | 23 | 1.34mi |
| 650 S Main St Fort Worth, TX | 2.0 | 2.0 | 1257 | $1,799 | $1.43 | 16d | 1 | 1.34mi |
| 218 W Broadway Ave Fort Worth, TX | 2.0 | 1.0–2.0 | 848 | $2,583 | $3.04 | 1d | 20 | 1.34mi |
| 200 W Daggett Ave Fort Worth, TX | 1.0–2.0 | 1.0–2.0 | 980 | $2,146 | $2.19 | 0d | 10 | 1.35mi |
| 309 W Daggett Ave Unit 205 Fort Worth, TX | 2.0 | 2.0 | 1633 | $3,950 | $2.42 | 1d | 1 | 1.40mi |
| 1229 E Harvey Ave Fort Worth, TX | 3.0 | 2.0 | 1684 | $2,150 | $1.28 | 1d | 1 | 1.42mi |
| 221 W Lancaster Ave Fort Worth, TX | 1.0–2.0 | 1.0–2.0 | 1122 | $1,975 | $1.76 | 8d | 5 | 1.46mi |
Listing history 8 events
-
2026-06-21statusdays on market $97,000 Active Option Contract 13 DOM
-
2026-06-18days on market $97,000 Active 10 DOM
-
2026-06-17days on market $97,000 Active 9 DOM
-
2026-06-16days on market $97,000 Active 8 DOM
-
2026-06-15days on market $97,000 Active 7 DOM
-
2026-06-13days on market $97,000 Active 5 DOM
-
2026-06-09remarks 317-char remark
-
2026-06-09$97,000 Active 1 DOM
ⓘ Source: listings_history table (triggers on properties + properties_extension) + one-shot
backfill from property_details.listing_events for pre-trigger history.
Tax reassessment forecast TX · Resets to sale price
- Current annual tax
- $1,401 · $117/mo
- Projected year-2 tax
- $1,775 · $148/mo
- Expected delta
- +$374/yr (+$31/mo · 26.7%)
ⓘ Screening estimate from a state-policy table — verify with the county assessor before closing.
Climate risk First Street
- Flood 1/10 Low FEMA zone X (unshaded) · 0% chance over 30 yrs
- Wildfire 1/10 Low
- Heat 8/10 Severe 7 d/yr ≥109°F today · 23 d/yr by 30 yrs out
- Wind 4/10 Moderate 24% chance of damaging wind over 30 yrs
- Air quality 3/10 Moderate 3 unhealthy d/yr today · 4 by 30 yrs out
Nearby sold comps map
Loading sold comps map…
Walkable amenities ~0.75 mi
Loading nearby amenities…
Taxation est. · year 1
- Rental income
- $24,983
- − Mortgage interest
- −$5,434
- − Property taxes
- −$1,401
- − Insurance
- −$485
- − Repairs & maintenance
- −$1,999
- − Management
- −$1,999
- − Depreciation
- −$2,822
- Taxable income
- $10,845
- Est. tax owed @ 24.0%
- −$2,603
- After-tax cash flow
- $9,144/yr
For passive investors: Depreciation is non-cash, so a rental often shows a tax loss while cash-flowing — sheltering income. Rental losses are passive: they offset passive income freely, and up to $25,000/yr can offset ordinary (W-2) income if you actively participate and your MAGI is under $100k (phasing out to $0 by $150k); unused losses carry forward. On sale, claimed depreciation is recaptured at up to 25%, and gains may owe capital-gains tax (a 1031 exchange can defer both). Figures are a year-1 estimate at your 24.0% rate — not tax advice; consult a CPA.
Schools (NCES district)
- District
- Fort Worth ISD
- NCES district ID
- 4819700
- Math proficiency
- 18% ▼ -16.00%
- Reading proficiency
- 28% ▼ -6.00%
- Median HH income
- $42,109
- Composite
- 19.61/100
- National rank
- #8753
- State rank
- #742 of 826 in TX
Livability — Fort Worth
- Score
- 80/100
- State rank
- #49
- US rank
- #1954
Category grades
Schools grade is shown separately in the Schools card above.
Census & demographics
- Census place
- Fort Worth, TX
- County
- Tarrant County · 2,033,669 people
- City population
- 911,619
- Metro
- Dallas-Fort Worth-Arlington, TX
- Population (ZIP)
- 20,443
- Household income
- $61,658
- Rent vs Own
- Severe rent burden
- 1060.0
Population outlook (Tarrant County) Hauer SSP2
- Today (2025)
- 2,380,417 people
- By 2030
- 2,578,900 · +8.3%
- By 2040
- 2,974,995 · +25.0%
- By 2050
- 3,350,489 · +40.8%
- By 2075
- 4,216,909 · +77.2%
- By 2100
- 4,741,527 · +99.2%
Race, ethnicity, and origin ACS 2023
- Neighborhood character
- Diverse neighborhood (Simpson 0.67)
- Race & ethnicity
- Hispanic / Latino 45% Black 28% White 21% Two or more races 17% Asian 2%
- Hispanic origin (detail)
- Mexican 41% Cuban 1%
- Common ancestry
- Lithuanian 1% Italian 1% Arab 1%
- Foreign-born
- 21% · Canada, Vietnam, Philippines
- Languages at home
- 58% English-only · Spanish 37% Arabic 1% Other Indo-European 1%
Political lean MEDSL · Tarrant
- 2024 margin
- Lean R (+5.1) · D 46.7% · R 51.9% · Other 1.4%
- 2008→2024 swing
- +6.6pp toward D · 2008: -11.7pp · 2024: -5.1pp
- All cycles
- 2024: R+5.1 2020: D+0.2 2016: R+8.7 2012: R+15.7 2008: R+11.7
Not yet ingested
- Civics
- —
Market trends
- HPI YoY
- ▼ -36.10%
- Current HPI
- 276.383
- Rent YoY
- ▬ 0.05%
- Metro
- Dallas-Fort Worth-Arlington, TX
- State GDP YoY
- ▲ 3.95%
- F500 in state
- 110
Industry mix (Fortune 500 HQ in TX)
| Industry | F500 HQs | Revenue |
|---|---|---|
| Energy | 16 | $1,198B |
|
||
| Technology | 5 | $198B |
|
||
| Engineering / Construction | 4 | $72B |
|
||
| Energy Services | 3 | $60B |
|
||
| Utilities | 3 | $41B |
|
||
| Healthcare | 2 | $330B |
|
||
Price history
3 events — show timeline
- 2026-06-08 Listed $97,000 NTREIS
- 2015-10-19 Sold (Public Records) — Public Records
- 1997-06-02 Sold (Public Records) — Public Records
Property tax history
+5.3%/yrLatest (2025): $1,401 · +10.7% YoY. Source: county tax records.
Cash-flow waterfall
monthlySold comps — $/sqft
last 12 mo · ≤1 miLoading sold comps…