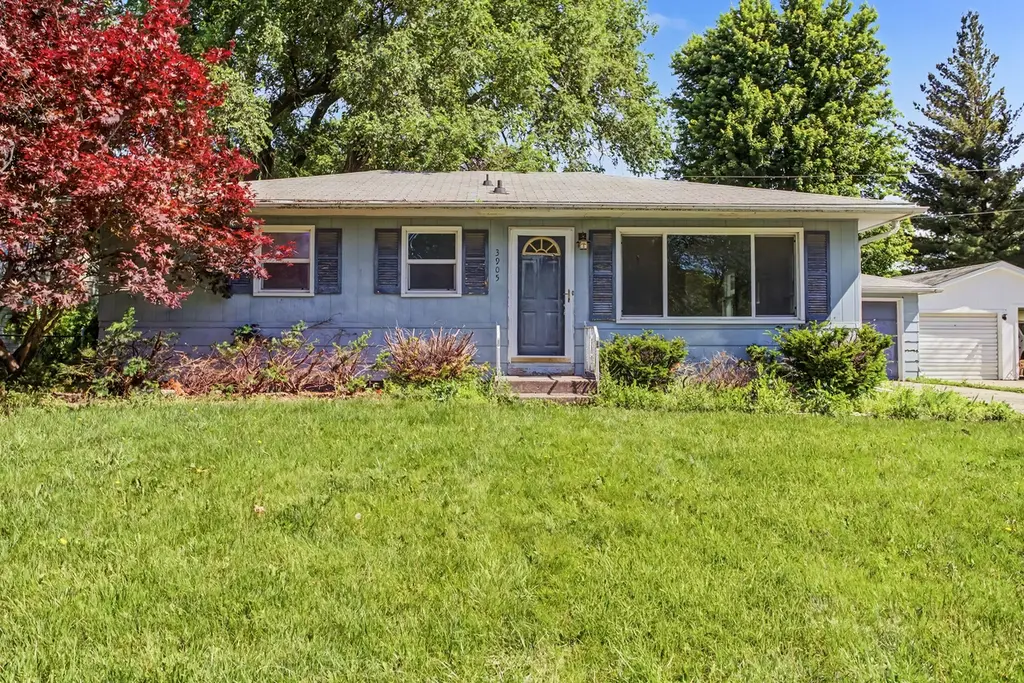
3905 Ontario St · Ames, IA
Flood risk 1/10 · Minimal
- FEMA flood zone
- X (unshaded)
- Chance of flooding over 30 yrs
- 0.0%
- Est. flood insurance / yr
- $473 – $860
Fire risk 4/10 · Minor
- Est. fire insurance / yr
- $902 – $1,676
Heat risk 3/10 · Minor
- Hot days now (above 102°F)
- 7 days/yr
- Hot days in 30 yrs
- 15 days/yr
Wind risk 2/10 · Minimal
- Chance of severe wind over 30 yrs
- —
Air-quality risk 1/10 · Minimal
- Unhealthy air days now
- 0 days/yr
- Unhealthy air days in 30 yrs
- 0 days/yr
Risk factors via First Street. Map © Google.
Why this score? — see what drove the C- grade
The composite is a weighted blend of 9 inputs, each scored 0–100. Each bar is that input's sub-score; the figure is the points it added to the 100-point composite (weight × sub-score).
- ARV discount +15.0/15.0
- Cash flow +12.0/30.0
- Schools +5.9/10.0
- Livability +4.7/5.0
- 1% rule +3.5/10.0
- DSCR +3.5/10.0
- Rent growth +3.4/5.0
- Condition / age +2.5/5.0
- Appreciation +0.0/10.0
$205,000
🖨 Deal sheet 📄 Offer letter ✓ Due diligence
Listing remarks MLS
Great opportunity for a buyer to build some sweat equity in this 3BR, 1.5 bath ranch home. The interior features hardwood floors, galley kitchen, eat-in dining, living room with large south-facing picture window and three bedrooms with dedicated closet space. Main floor bathroom with new bath/shower surround. The lower level has some great finish potential with some framing already done and plumbing completed for an additional bathroom. Seller has recently had lower level walls anchored for peace of mind and rooms are ready to finish. You'll enjoy the lower level exterior door for access in and out of the basement. Ample yard space.
Key facts
- Galley kitchen
- Eat-in dining
- Hardwood floors
Tags
Property features AI
Exterior
- Parking: Detached one-car garage
- Utilities: Public water; Public sewer
- Home design: Single-story home
- Construction: Block foundation; Asphalt shingle roof; See remarks for construction materials
- Exterior features: Open patio; Patio
Interior
- Kitchen: Dishwasher; Microwave; Refrigerator; Stove
- Bedrooms: 3 main-level bedrooms
- Flooring: Carpet; Hardwood; Laminate
- Bathrooms: 1 full bathroom
- Heating & cooling: Forced air heating (natural gas); Central air conditioning
- Interior features: Dining area; Window treatments
- Laundry & utility: Washer; Dryer
Neighborhood map
What this means for you Summary
Snapshot
- This is a 4-bed/3.0-bath single-family listed at $205k.
Deal economics
- At list price, monthly cash flow is $-51 ($-607/yr) — negative.
- To cash-flow at today's rent, offer at most $196k (4.4% below list).
- To meet the 1% rule (rent ≥ 1% of price), the offer needs to be $173k (15.5% below list).
- Recommended offer: $173k (15.5% below list) — sets the bar for 1% rule.
- Cap rate 6.0% vs local median 2.2% in Ames — top-decile yield for the area; either an underpriced asset or a hidden risk that comps aren't pricing in. Stress-test before assuming the spread holds.
Location & tenants
- Location reads 93/100 on livability (#2 in IA, #21 nationally) — a professional / high-income tenant draw. Strengths: schools A+, amenities A+, commute A+; Watch: employment C-.
- Ames Community School District (urban): math 70% / reading 72% proficiency, ranked #147 of 289 in IA (top 51%) — strong family-tenant draw, lease renewals of 3-5y typical.
- Market conditions: Rents rising (+3.7%/yr); 196 active listings in the ZIP; 11 comparable units currently listed for rent nearby; rentals lingering (median 44d on market — plan ~5-8 weeks vacancy on turnover, expect pricing pressure); 100% of comp listings sitting > 30 days — soft ceiling on asking rent; 196 units permitted in Story County in 2024 (34 in 5+ unit buildings).
- This rent runs 34% of the median local income ($61k/yr) — at the standard rent-burdened threshold; future hikes will face affordability resistance.
Forward outlook
- Local home prices are declining (-3.0%/yr); year-one equity from $1k of loan paydown is wiped out by about $6k of value loss. Plan a longer hold.
- Story County population projected at +54% by 2050 — long-run rental-demand tailwind backs the buy-and-hold thesis.
Negotiation context
- It's been on market 16 days — a 2% lower offer ($202k) is reasonable based on typical stale-listing flexibility.
- 2 sale attempts; this cycle's ask has dropped $15k (7%) from the opening price — seller is motivated, your offer sets the floor, not the list.
- Current owner paid $142k; 44% above their basis — modest negotiation headroom, anchor on the comps not their cost.
Questions for the listing agent
- What do current leases actually rent for vs. the listed asking? Can we see a recent rent roll and the last 12 months of T-12 income?
- Built in 1961 — when were the roof, HVAC, electrical panel, plumbing, and water heater last replaced?
- Is there a deadline driving the sale (1031 exchange, divorce, estate, relocation)? That informs how much negotiation room exists.
- Schools are A-rated — typically a magnet for longer-tenancy family renters. What's the average tenant stay here, and is there a school-zone premium baked into asking?
- What's the average days-on-market for RENTAL listings here right now (not sales)? A rising rental-DOM trend means longer vacancies and softer asking-rent achievability than the comps imply.
- What's the recent tenant-quality profile in this submarket — average credit score on applications, eviction rate, late-payment / NSF rate, and stable-employment percentage? A property-management company in the area should have these aggregated.
- How much new for-sale + rental construction is in the pipeline within 1–3 miles? Heavy new supply typically softens prices + rents 12–24 months out; constrained supply supports both.
Investment metrics
- 1% rule
- 0.85% ✗
- Cap rate
- 6.00%
- Cash-on-cash
- -1.06%
- DSCR
- 0.95
- GRM
- 9.9
CMA / ARV
- ARV (on-the-fly)
- $317,408
- Comps found
- 12
Show comp detail 12 sales within ~0.75 mi
| Address | Dist | Beds/Ba | Sqft | Sold | Price | $/sf | Match |
|---|---|---|---|---|---|---|---|
| 1332 Arizona Ave | 0.23mi | 4/1.5 | 1,728 (-1%) | 4mo | $24,000 | $14 | 79 |
| 1247 Wisconsin Ave | 0.46mi | 4/2.5 | 1,816 (+4%) | 0mo | $330,000 | $182 | 69 |
| 219 Crane Ave | 0.73mi | 4/3.0 | 1,737 (-0%) | 2mo | $310,000 | $178 | 64 |
| 1017 Florida Ave Ave | 0.56mi | 3/3.5 (-1) | 1,724 (-1%) | 2mo | $368,000 | $213 | 64 |
| 1304 Illinois Ave | 0.69mi | 4/3.0 | 1,690 (-3%) | 5mo | $302,000 | $179 | 58 |
| 1008 Mesa Verde Pl | 0.23mi | 4/2.0 | 1,532 (-12%) | 8mo | $235,000 | $153 | 58 |
| 1026 Florida Ave | 0.52mi | 3/3.0 (-1) | 1,870 (+7%) | 5mo | $355,000 | $190 | 55 |
| 1315 Iowa Cir | 0.61mi | 4/2.5 | 1,974 (+13%) | 0mo | $342,000 | $173 | 47 |
| 318 Crane Ave | 0.70mi | 4/2.0 | 1,625 (-7%) | 6mo | $330,000 | $203 | 47 |
| 601 Chelsea Ct | 0.65mi | 4/3.5 | 1,953 (+12%) | 5mo | $427,500 | $219 | 44 |
| 4604 Utah Dr | 0.54mi | 3/2.5 (-1) | 1,493 (-14%) | 2mo | $329,000 | $220 | 42 |
| 315 Crane Ave | 0.69mi | 3/1.5 (-1) | 1,551 (-11%) | 2mo | $275,000 | $177 | 37 |
Match score weights: distance 35% · size 25% · config 20% · recency 20%. Top-matched comps best support the ARV.
Projected returns pro-forma
-3.0% appreciation · 3.67% rent growth · sell at horizon
- IRR
- -17.3%
- Equity multiple
- 0.39×
- Total profit
- $-35,238
- Equity at exit
- $30,566
- IRR
- -8.0%
- Equity multiple
- 0.48×
- Total profit
- $-29,830
- Equity at exit
- $17,725
Cash invested: $57,400 (down + closing). Projections, not guarantees.
Landlord ↔ Tenant lean methodology
- Overall (STATE)
- 83 Strongly Landlord-Friendly
- State Iowa
- 83 Strongly Landlord-Friendly · R+6
- County
- — inherits STATE
- City
- — inherits STATE
ZIP-level market 50014
- Rents YoY
- 3.7%
- Active inventory
- 196
- Price-to-rent
- 9.9×
Monthly cashflow live
- Estimated rent
- $1,733 high interval (Pro) →
- Mortgage (P&I)
- −$1,075
- Tax from tax record
- −$259 /mo · $3,108/yr
- Insurance
- −$85
- HOA
- −$0
- Vacancy / Maint / Mgmt
- −$364
- Net cashflow
- $-51
Break-even live
UW: 25.0% down · 7.5% · 30yr · 1.5% tax · 5.0% vac · 8.0% maint · 8.0% mgmt
Financing live
Cash to close
- Down payment
- $51,250
- Closing costs
- $6,150
- Reserves months
- —
- Total cash needed
- —
Loan-product check · same deal, 3 products live
Conventional
25% down · 7.5% · 30yr
- Down + closing
- —
- Monthly P&I
- —
- Monthly cashflow
- —
- DSCR
- —
- Eligible?
- —
Personal DTI + credit; lowest rate.
DSCR
20% down · 8.5% · 30yr
- Down + closing
- —
- Monthly P&I
- —
- Monthly cashflow
- —
- DSCR
- —
- Eligible?
- —
No personal income docs; deal must DSCR.
Hard money
10% down · 12.0% · 12mo
- Down + closing
- —
- Monthly P&I
- —
- Monthly cashflow
- —
- DSCR
- —
- Eligible?
- —
Short-term bridge; refi at stabilization.
Rent comps 11 comps
| Address | Beds | Baths | Sqft | Rent | $/sqft | DOM | Units | Dist |
|---|---|---|---|---|---|---|---|---|
| 3809 Ontario St Ames, IA | 3.0 | 2.0 | 1149 | $1,650 | $1.44 | 43d | 1 | 0.04mi |
| 802 Delaware Ave Unit 102 Ames, IA | 3.0 | 2.5 | 1520 | $2,100 | $1.38 | 43d | 1 | 0.58mi |
| 4515 Todd Dr Ames, IA | 2.0–3.0 | 2.0 | 1198 | $1,740 | $1.45 | 43d | 3 | 1.00mi |
| 4505 Todd Dr Ames, IA | 3.0 | 2.0 | 1329 | $1,740 | $1.31 | 43d | 1 | 1.02mi |
| 3821 Marigold Dr Unit 1 Ames, IA | 4.0 | 2.0 | 1619 | $1,900 | $1.17 | 43d | 1 | 1.10mi |
| 3503 Coy St Ames, IA | 4.0 | 2.5 | 1650 | $2,500 | $1.52 | 43d | 1 | 1.19mi |
| 122 Hayward Ave Ames, IA | 4.0 | 4.0 | 1380 | $700 | $0.51 | 43d | 1 | 1.36mi |
| 2519 Chamberlain St Ames, IA | 1.0–3.0 | 1.0 | 825 | $1,190 | $1.44 | 43d | 1 | 1.38mi |
| 850 Pinon Dr Ames, IA | 2.0–3.0 | 1.0–2.0 | 1020 | $1,497 | $1.47 | 43d | 41 | 1.39mi |
| 4536 Twain Cir Ames, IA | 4.0 | 2.0 | 1358 | $1,570 | $1.16 | 43d | 2 | 1.39mi |
| 315 Hayward Ave Ames, IA | 4.0 | 1.0 | 1442 | $1,700 | $1.18 | 43d | 1 | 1.44mi |
Listing history 13 events
-
2026-06-19days on market $205,000 Active 16 DOM
-
2026-06-18days on market $205,000 Active 15 DOM
-
2026-06-17days on market $205,000 Active 14 DOM
-
2026-06-16days on market $205,000 Active 13 DOM
-
2026-06-15days on market $205,000 Active 12 DOM
-
2026-06-14days on market $205,000 Active 10 DOM
-
2026-06-13days on market $205,000 Active 9 DOM
-
2026-06-10days on market $205,000 Active 7 DOM
-
2026-06-09days on market $205,000 Active 6 DOM
-
2026-06-08days on market $205,000 Active 5 DOM
-
2026-06-07pricedays on market $205,000 Active 4 DOM
-
2026-06-03remarks 640-char remark
Show marketing remark (640 chars)
Great opportunity for a buyer to build some sweat equity in this 3BR, 1.5 bath ranch home. The interior features hardwood floors, galley kitchen, eat-in dining, living room with large south-facing picture window and three bedrooms with dedicated closet space. Main floor bathroom with new bath/shower surround. The lower level has some great finish potential with some framing already done and plumbing completed for an additional bathroom. Seller has recently had lower level walls anchored for peace of mind and rooms are ready to finish. You'll enjoy the lower level exterior door for access in and out of the basement. Ample yard space.
-
2026-06-03$220,000 Active 1 DOM
Show marketing remark (640 chars)
Great opportunity for a buyer to build some sweat equity in this 3BR, 1.5 bath ranch home. The interior features hardwood floors, galley kitchen, eat-in dining, living room with large south-facing picture window and three bedrooms with dedicated closet space. Main floor bathroom with new bath/shower surround. The lower level has some great finish potential with some framing already done and plumbing completed for an additional bathroom. Seller has recently had lower level walls anchored for peace of mind and rooms are ready to finish. You'll enjoy the lower level exterior door for access in and out of the basement. Ample yard space.
ⓘ Source: listings_history table (triggers on properties + properties_extension) + one-shot
backfill from property_details.listing_events for pre-trigger history.
Tax reassessment forecast IA · Partial reset (capped growth)
- Current annual tax
- $3,108 · $259/mo
- Projected year-2 tax
- $3,163 · $264/mo
- Expected delta
- +$55/yr (+$5/mo · 1.8%)
ⓘ Screening estimate from a state-policy table — verify with the county assessor before closing.
Climate risk First Street
- Flood 1/10 Low FEMA zone X (unshaded) · 0% chance over 30 yrs
- Wildfire 4/10 Moderate
- Heat 3/10 Moderate 7 d/yr ≥102°F today · 15 d/yr by 30 yrs out
- Wind 2/10 Low
- Air quality 1/10 Low 0 unhealthy d/yr today · 0 by 30 yrs out
Nearby sold comps map
Loading sold comps map…
Walkable amenities ~0.75 mi
Loading nearby amenities…
Taxation est. · year 1
- Rental income
- $20,793
- − Mortgage interest
- −$11,483
- − Property taxes
- −$3,108
- − Insurance
- −$1,025
- − Repairs & maintenance
- −$1,663
- − Management
- −$1,663
- − Depreciation
- −$5,964
- Taxable loss
- −$4,114
- Est. tax savings @ 24.0%
- +$987
- After-tax cash flow
- $380/yr
For passive investors: Depreciation is non-cash, so a rental often shows a tax loss while cash-flowing — sheltering income. Rental losses are passive: they offset passive income freely, and up to $25,000/yr can offset ordinary (W-2) income if you actively participate and your MAGI is under $100k (phasing out to $0 by $150k); unused losses carry forward. On sale, claimed depreciation is recaptured at up to 25%, and gains may owe capital-gains tax (a 1031 exchange can defer both). Figures are a year-1 estimate at your 24.0% rate — not tax advice; consult a CPA.
Schools (NCES district)
- District
- Ames Community School District
- NCES district ID
- 1903540
- Math proficiency
- 70% ▼ -5.00%
- Reading proficiency
- 72% ▼ -1.00%
- Median HH income
- $39,790
- Composite
- 59.22/100
- National rank
- #941
- State rank
- #147 of 289 in IA
Livability — Ames
- Score
- 93/100
- State rank
- #2
- US rank
- #21
Category grades
Schools grade is shown separately in the Schools card above.
Census & demographics
- Census place
- Ames, IA
- County
- Story County · 66,757 people
- City population
- 66,757
- Metro
- Ames, IA
- Population (ZIP)
- 32,958
- Household income
- $60,731
- Rent vs Own
- Severe rent burden
- 2646.0
Population outlook (Story County) Hauer SSP2
- Today (2025)
- 115,493 people
- By 2030
- 126,820 · +9.8%
- By 2040
- 150,771 · +30.5%
- By 2050
- 177,915 · +54.0%
- By 2075
- 255,370 · +121.1%
- By 2100
- 316,429 · +174.0%
Race, ethnicity, and origin ACS 2023
- Neighborhood character
- Predominantly White (76%)
- Race & ethnicity
- White 76% Asian 12% Two or more races 5% Black 3% Hispanic / Latino 3%
- Common ancestry
- Portuguese 6% Romanian 2% Iranian 2%
- Foreign-born
- 13% · China, Canada, South Korea
- Languages at home
- 84% English-only · Other Indo-European 4% Other Asian/Pacific 2% Korean 2%
Political lean MEDSL · Story
- 2024 margin
- D (+10.4) · D 54.4% · R 44.0% · Other 1.6%
- 2008→2024 swing
- -5.8pp toward R · 2008: 16.2pp · 2024: 10.4pp
- All cycles
- 2024: D+10.4 2020: D+17.3 2016: D+12.2 2012: D+13.7 2008: D+16.2
Not yet ingested
- Civics
- —
Market trends
- HPI YoY
- ▼ -113.94%
- Current HPI
- 174.8142
- Rent YoY
- ▲ 3.67%
- Metro
- Ames, IA
- State GDP YoY
- ▲ 2.48%
- F500 in state
- 4
Industry mix (Fortune 500 HQ in IA)
| Industry | F500 HQs | Revenue |
|---|---|---|
| Financial Services | 1 | $16B |
|
||
| Retail / Convenience | 1 | $15B |
|
||
Price history
+66.7% since first listed4 events — show timeline
- 2026-06-03 Listed $220,000 CIBOR
- 2026-06-03 Listed $220,000 DMMLS
- 2008-06-09 Sold (Public Records) $142,000 Public Records
- 2006-04-21 Sold (Public Records) $132,000 Public Records
Property tax history
+2.5%/yrLatest (2025): $3,108 · +2.2% YoY. Source: county tax records.
Cash-flow waterfall
monthlySold comps — $/sqft
last 12 mo · ≤1 miLoading sold comps…