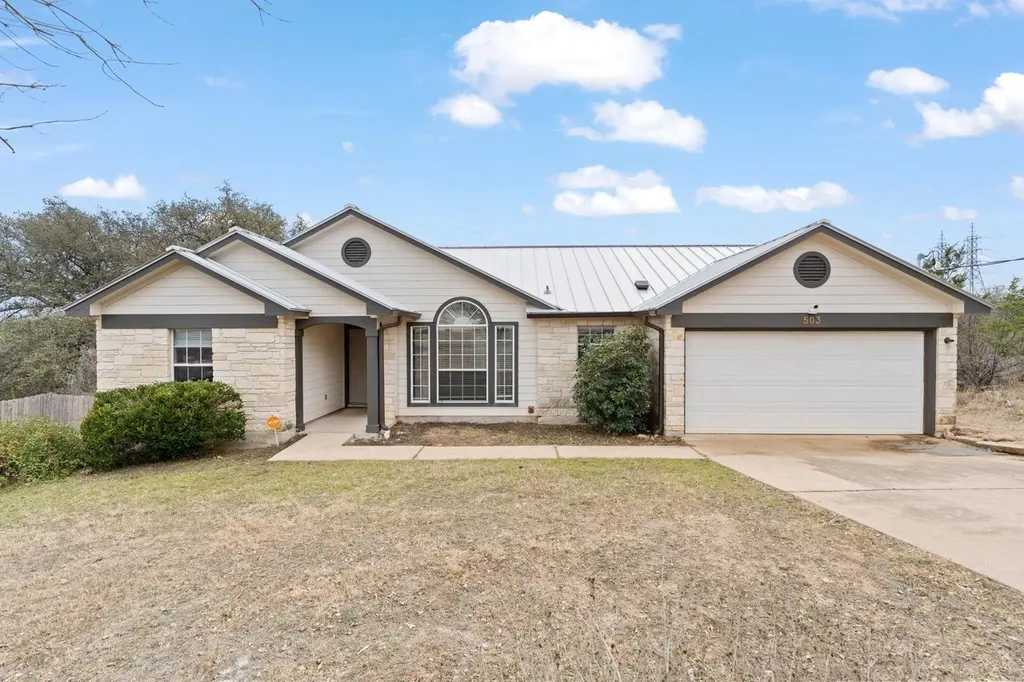
503 Knights Row Row · Cottonwood Shores, TX
Flood risk 1/10 · Minimal
- FEMA flood zone
- X (unshaded)
- Chance of flooding over 30 yrs
- 0.0%
- Est. flood insurance / yr
- $507 – $1,088
Fire risk 5/10 · Moderate
- Est. fire insurance / yr
- $1,222 – $2,270
Heat risk 8/10 · Major
- Hot days now (above 107°F)
- 7 days/yr
- Hot days in 30 yrs
- 21 days/yr
Wind risk 6/10 · Moderate
- Chance of severe wind over 30 yrs
- 55.0%
Air-quality risk 1/10 · Minimal
- Unhealthy air days now
- 0 days/yr
- Unhealthy air days in 30 yrs
- 0 days/yr
Risk factors via First Street. Map © Google.
Why this score? — see what drove the D grade
The composite is a weighted blend of 9 inputs, each scored 0–100. Each bar is that input's sub-score; the figure is the points it added to the 100-point composite (weight × sub-score).
- ARV discount +14.8/15.0
- Cash flow +6.5/30.0
- Appreciation +5.5/10.0
- Livability +3.5/5.0
- Schools +3.0/10.0
- Rent growth +2.5/5.0
- Condition / age +2.5/5.0
- 1% rule +1.6/10.0
- DSCR +0.8/10.0
$325,500
🖨 Deal sheet (PDF) 📄 Offer letter ✓ Due diligence
Listing remarks MLS
Nestled in the quiet Castle Terrace neighborhood, this well-maintained 3-bedroom, 2-bath home offers comfortable living with a peaceful backdrop. The property backs up to a ranch, providing open views and a sense of privacy. The adjacent lot is also available for sale. The property features a gentle downhill slope, thoughtfully managed with French drains and other water-diversion systems to keep everything dry and worry-free. Brand new metal roof less than a year old adds long term value to the home. Inside, the home features a functional layout with a spacious living area and bedrooms designed for everyday comfort. An additional lot located next door is also available for purchase, offering a unique opportunity for expansion, added privacy, or future development. A great option for those seeking a quiet neighborhood, scenic surroundings, and room to grow—just minutes from local amenities while still feeling tucked away.
Key facts
- Open views
- Added privacy
- Spacious living area
Tags
Neighborhood map
What this means for you Summary
Snapshot
- This is a 3-bed/2.0-bath single-family listed at $326k.
Deal economics
- At list price, monthly cash flow is $-553 ($-7k/yr) — negative.
- To cash-flow at today's rent, offer at most $228k (30.0% below list).
- To meet the 1% rule (rent ≥ 1% of price), the offer needs to be $214k (34.3% below list).
- Recommended offer: $214k (34.3% below list) — sets the bar for 1% rule.
Location & tenants
- Location reads 70/100 on livability (#385 in TX) — a middle-class / working-renter tenant base. Strengths: crime A+, cost of living A+, housing A+; Watch: amenities F, commute F, employment F.
- Marble Falls ISD (town): math 32% / reading 38% proficiency, ranked #511 of 826 in TX (top 62%) — families likely to look elsewhere, expect single-tenant / working-renter base with shorter leases.
- Zoned schools: Colt El (math 35% / reading 38%, grade F, #1,883 of 4,322 statewide, top 44%, 644 students, 62% FRL); Marble Falls Middle (math 32% / reading 37%, grade F, #858 of 1,662 statewide, top 54%, 911 students, 67% FRL); Marble Falls H S (math 29% / reading 47%, grade F, #880 of 1,632 statewide, top 54%, 1,145 students, 61% FRL).
- Market conditions: 1236 active listings in the ZIP; 16 comparable units currently listed for rent nearby; rentals at typical pace (median 25d on market — plan ~3-4 weeks tenant-placement turnaround); solid renter incomes; 891 units permitted in Burnet County in 2024 (76 in 5+ unit buildings).
Forward outlook
- In year one you build about $5k of equity ($2k loan paydown + $3k appreciation (0.9% local appreciation)).
- Burnet County population projected at +22% by 2050 — long-run rental-demand tailwind backs the buy-and-hold thesis.
- By year 6, paydown + projected appreciation supports a ~$31k cash-out refi (75% LTV) — recoverable capital for the next deal without selling this one.
Negotiation context
- It's been on market 137 days — a 12% lower offer ($286k) is reasonable based on typical stale-listing flexibility.
- 3 sale attempts since 22y ago with the ask held roughly flat each time — persistent listings suggest the price (not the market) is what's stuck; bring a comps-based counter.
- Current owner paid $145k; list at $326k implies a 124% gain — meaningful room to come down on a strong offer.
Risks & watch-outs
- Climate carrying-cost: major wind risk, 55% chance of damaging wind over 30y; moderate wildfire risk; extreme-heat days projected 7→21/yr by 2055 (HVAC capex compounding) — expect insurance premiums to compound above CPI over the hold.
Questions for the listing agent
- What do current leases actually rent for vs. the listed asking? Can we see a recent rent roll and the last 12 months of T-12 income?
- It's been on market 137 days. Have you received any prior offers? Is the seller open to a 34% concession, seller financing, or rate buy-down credit?
- Why hasn't it sold? Are there any deal-killer items the seller is aware of (foundation, flood, title, zoning, code violations)?
- Is there a deadline driving the sale (1031 exchange, divorce, estate, relocation)? That informs how much negotiation room exists.
- Schools are F-rated, which usually means shorter tenancies and higher turnover. Who's the typical renter profile here, and what's been the actual vacancy rate?
- The area grade is low — what's the realistic commute time and amenity access for the typical tenant pool here? Any planned neighborhood developments (good or bad) we should know about?
- What's the average days-on-market for RENTAL listings here right now (not sales)? A rising rental-DOM trend means longer vacancies and softer asking-rent achievability than the comps imply.
- What's the recent tenant-quality profile in this submarket — average credit score on applications, eviction rate, late-payment / NSF rate, and stable-employment percentage? A property-management company in the area should have these aggregated.
- How much new for-sale + rental construction is in the pipeline within 1–3 miles? Heavy new supply typically softens prices + rents 12–24 months out; constrained supply supports both.
Investment metrics
- 1% rule
- 0.66% ✗
- Cap rate
- 4.25%
- Cash-on-cash
- -7.28%
- DSCR
- 0.68
- GRM
- 12.7
CMA / ARV
- ARV (median comp)
- $388,820
- List price
- $325,500
- Delta
- -16.29%
- Verdict
- UNDERPRICED
- Comps
- 20 within 1.0 mi
Show comp detail 1 sale within ~0.75 mi
| Address | Dist | Beds/Ba | Sqft | Sold | Price | $/sf | Match |
|---|---|---|---|---|---|---|---|
| 200 Right Ln Unit A | 0.68mi | 3/2.5 | 1,616 (+9%) | 14mo | $415,000 | $257 | 39 |
Match score weights: distance 35% · size 25% · config 20% · recency 20%. Top-matched comps best support the ARV.
Projected returns pro-forma
0.95% appreciation · 3.0% rent growth · sell at horizon
- IRR
- -6.6%
- Equity multiple
- 0.67×
- Total profit
- $-29,971
- Equity at exit
- $110,195
- IRR
- -1.0%
- Equity multiple
- 0.88×
- Total profit
- $-11,276
- Equity at exit
- $145,727
Cash invested: $91,140 (down + closing). Projections, not guarantees.
Landlord ↔ Tenant lean methodology
- Overall (STATE)
- 87 Strongly Landlord-Friendly
- State Texas
- 87 Strongly Landlord-Friendly · R+5
- County
- — inherits STATE
- City
- — inherits STATE
ZIP-level market 78657
- Home prices YoY
- 0.4%
- Active inventory
- 1236
- Price-to-rent
- 12.7×
Monthly cashflow live
- Estimated rent
- $2,138 high interval (Pro) →
- Mortgage (P&I)
- −$1,707
- Tax from tax record
- −$399 /mo · $4,793/yr
- Insurance
- −$136
- HOA
- −$0
- Vacancy / Maint / Mgmt
- −$449
- Net cashflow
- $-553
Break-even live
Sensitivity live
| Price | -10% $-369 | -5% $-461 | +0% $-553 | +5% $-645 | +10% $-737 |
|---|---|---|---|---|---|
| Rent | -10% $-722 | -5% $-637 | +0% $-553 | +5% $-468 | +10% $-384 |
| Rate | -1.0pp $-389 | -0.5pp $-470 | base $-553 | +0.5pp $-637 | +1.0pp $-723 |
UW: 25.0% down · 7.5% · 30yr · 1.5% tax · 5.0% vac · 8.0% maint · 8.0% mgmt
Financing live
Cash to close
- Down payment
- $81,375
- Closing costs
- $9,765
- Reserves months
- —
- Total cash needed
- —
Loan-product check · same deal, 3 products live
Conventional
25% down · 7.5% · 30yr
- Down + closing
- —
- Monthly P&I
- —
- Monthly cashflow
- —
- DSCR
- —
- Eligible?
- —
Personal DTI + credit; lowest rate.
DSCR
20% down · 8.5% · 30yr
- Down + closing
- —
- Monthly P&I
- —
- Monthly cashflow
- —
- DSCR
- —
- Eligible?
- —
No personal income docs; deal must DSCR.
Hard money
10% down · 12.0% · 12mo
- Down + closing
- —
- Monthly P&I
- —
- Monthly cashflow
- —
- DSCR
- —
- Eligible?
- —
Short-term bridge; refi at stabilization.
Rent comps 16 comps
| Address | Beds | Baths | Sqft | Rent | $/sqft | DOM | Units | Dist |
|---|---|---|---|---|---|---|---|---|
| 200 Full Moon Horseshoe Bay, TX | 2.0 | 2.0 | 1171 | $1,800 | $1.54 | 14d | 1 | 0.83mi |
| 307 Crestview Horseshoe Bay, TX | 2.0 | 2.5 | 1240 | $1,800 | $1.45 | 0d | 1 | 0.84mi |
| 100 Bay Point Dr Horseshoe Bay, TX | 2.0 | 2.0 | 1243 | $1,950 | $1.57 | 14d | 1 | 0.93mi |
| 100 Bay Point Dr #7 Horseshoe Bay, TX | 2.0 | 2.0 | 1243 | $2,150 | $1.73 | 12d | 1 | 0.95mi |
| 400 Green Leaf Horseshoe Bay, TX | 1.0–3.0 | 1.0–2.0 | 962 | $1,349 | $1.40 | 25d | 2 | 1.03mi |
| 400 Green Leaf Unit 319-202 Horseshoe Bay, TX | 3.0 | 2.0 | 1141 | $1,349 | $1.18 | 25d | 1 | 1.03mi |
| 403 Island Dr Horseshoe Bay, TX | 3.0 | 3.0 | 1875 | $4,300 | $2.29 | 45d | 1 | 1.06mi |
| 104 Cove E #107 Horseshoe Bay, TX | 3.0 | 2.0 | 1250 | $2,500 | $2.00 | 25d | 1 | 1.15mi |
| 2203 25th St Horseshoe Bay, TX | 3.0 | 2.0 | 1680 | $1,525 | $0.91 | 25d | 1 | 1.17mi |
| 412 Short Circuit #3 Horseshoe Bay, TX | 2.0 | 2.0 | 1333 | $1,650 | $1.24 | 45d | 1 | 1.29mi |
| 723 Pecan Ln Cottonwood Shores, TX | 2.0 | 1.0 | 1027 | $1,400 | $1.36 | 46d | 1 | 1.29mi |
| 101 W Bank #14 Horseshoe Bay, TX | 3.0 | 2.0 | 1344 | $3,500 | $2.60 | 45d | 1 | 1.32mi |
| 307 Poker Chip Horseshoe Bay, TX | 2.0 | 2.5 | 1160 | $1,995 | $1.72 | 25d | 1 | 1.34mi |
| 300 Out Yonder #172 Horseshoe Bay, TX | 2.0 | 2.0 | 1321 | $1,275 | $0.97 | 45d | 1 | 1.34mi |
| 201 36th St Horseshoe Bay, TX | 3.0 | 2.0 | 1650 | $2,300 | $1.39 | 22d | 1 | 1.39mi |
| 400 Hi There #101 Horseshoe Bay, TX | 2.0 | 1.5 | 1160 | $1,900 | $1.64 | 45d | 1 | 1.39mi |
Listing history 21 events
-
2026-06-21days on market $325,500 Active 137 DOM
-
2026-06-18days on market $325,500 Active 134 DOM
-
2026-06-17days on market $325,500 Active 133 DOM
-
2026-06-16days on market $325,500 Active 132 DOM
-
2026-06-15days on market $325,500 Active 131 DOM
-
2026-06-13days on market $325,500 Active 129 DOM
-
2026-06-13days on market $325,500 Active 128 DOM
-
2026-06-09days on market $325,500 Active 125 DOM
-
2026-06-08days on market $325,500 Active 124 DOM
-
2026-06-07days on market $325,500 Active 123 DOM
-
2026-06-05days on market $325,500 Active 120 DOM
-
2026-06-03days on market $325,500 Active 119 DOM
-
2026-06-01days on market $325,500 Active 117 DOM
-
2026-05-31days on market $325,500 Active 116 DOM
-
2026-01-20$325,500 Active 940-char remark
Show marketing remark (940 chars)
Nestled in the quiet Castle Terrace neighborhood, this well-maintained 3-bedroom, 2-bath home offers comfortable living with a peaceful backdrop. The property backs up to a ranch, providing open views and a sense of privacy. The adjacent lot is also available for sale. The property features a gentle downhill slope, thoughtfully managed with French drains and other water-diversion systems to keep everything dry and worry-free. Brand new metal roof less than a year old adds long term value to the home. Inside, the home features a functional layout with a spacious living area and bedrooms designed for everyday comfort. An additional lot located next door is also available for purchase, offering a unique opportunity for expansion, added privacy, or future development. A great option for those seeking a quiet neighborhood, scenic surroundings, and room to grow—just minutes from local amenities while still feeling tucked away.
-
2015-09-16soldstatus
-
2007-03-12soldstatus $145,000
-
2005-04-26soldstatus 239-char remark
Show marketing remark (239 chars)
Quality Tejas New Home on beautiful wooded lot. Zero Down, 100% Financing * Custom features including 100% Masonry w/ stone front * 3/2 open floor plan * hi ceilings * rounded sheetrock corners * dbl pane windows * finished 2 car garage.
-
2005-01-03$126,500 239-char remark
Show marketing remark (239 chars)
Quality Tejas New Home on beautiful wooded lot. Zero Down, 100% Financing * Custom features including 100% Masonry w/ stone front * 3/2 open floor plan * hi ceilings * rounded sheetrock corners * dbl pane windows * finished 2 car garage.
-
2004-12-07historical
-
2004-08-18
ⓘ Source: listings_history table (triggers on properties + properties_extension) + one-shot
backfill from property_details.listing_events for pre-trigger history.
Tax reassessment forecast TX · Resets to sale price
- Current annual tax
- $4,793 · $399/mo
- Projected year-2 tax
- $5,957 · $496/mo
- Expected delta
- +$1,164/yr (+$97/mo · 24.3%)
ⓘ Screening estimate from a state-policy table — verify with the county assessor before closing.
Climate risk First Street
- Flood 1/10 Low FEMA zone X (unshaded) · 0% chance over 30 yrs
- Wildfire 5/10 Major
- Heat 8/10 Severe 7 d/yr ≥107°F today · 21 d/yr by 30 yrs out
- Wind 6/10 Major 55% chance of damaging wind over 30 yrs
- Air quality 1/10 Low 0 unhealthy d/yr today · 0 by 30 yrs out
Nearby sold comps map
Loading sold comps map…
Walkable amenities ~0.75 mi
Loading nearby amenities…
Taxation est. · year 1
- Rental income
- $25,657
- − Mortgage interest
- −$18,233
- − Property taxes
- −$4,793
- − Insurance
- −$1,628
- − Repairs & maintenance
- −$2,053
- − Management
- −$2,053
- − Depreciation
- −$9,469
- Taxable loss
- −$12,571
- Est. tax savings @ 24.0%
- +$3,017
- After-tax cash flow
- $-3,618/yr
For passive investors: Depreciation is non-cash, so a rental often shows a tax loss while cash-flowing — sheltering income. Rental losses are passive: they offset passive income freely, and up to $25,000/yr can offset ordinary (W-2) income if you actively participate and your MAGI is under $100k (phasing out to $0 by $150k); unused losses carry forward. On sale, claimed depreciation is recaptured at up to 25%, and gains may owe capital-gains tax (a 1031 exchange can defer both). Figures are a year-1 estimate at your 24.0% rate — not tax advice; consult a CPA.
Schools (NCES district)
- District
- Marble Falls ISD
- NCES district ID
- 4829010
- Math proficiency
- 32% ▼ -8.00%
- Reading proficiency
- 38% ▼ -4.00%
- Median HH income
- $49,663
- Composite
- 30.3/100
- National rank
- #6278
- State rank
- #511 of 826 in TX
Livability — Cottonwood Shores
- Score
- 70/100
- State rank
- #385
- US rank
- #8036
Category grades
Schools grade is shown separately in the Schools card above.
Census & demographics
- Census place
- Cottonwood Shores, TX
- County
- Llano County · 16,310 people
- Metro
- nan
- Population (ZIP)
- 7,591
- Household income
- $91,452
- Rent vs Own
- Severe rent burden
- 45.0
Population outlook (Burnet County) Hauer SSP2
- Today (2025)
- 50,492 people
- By 2030
- 52,995 · +5.0%
- By 2040
- 57,528 · +13.9%
- By 2050
- 61,444 · +21.7%
- By 2075
- 71,098 · +40.8%
- By 2100
- 74,634 · +47.8%
Race, ethnicity, and origin ACS 2023
- Neighborhood character
- Predominantly White (80%)
- Race & ethnicity
- White 80% Hispanic / Latino 16% Two or more races 8% Asian 1%
- Hispanic origin (detail)
- Mexican 14%
- Common ancestry
- Slovak 3% Portuguese 3% Italian 2%
- Foreign-born
- 8% · Canada
- Languages at home
- 87% English-only · Spanish 12% Other Indo-European 1%
Political lean MEDSL · Burnet
- 2024 margin
- Solid R (+55.7) · D 21.7% · R 77.4%
- 2008→2024 swing
- -11.6pp toward R · 2008: -44.1pp · 2024: -55.7pp
- All cycles
- 2024: R+55.7 2020: R+53.1 2016: R+56.8 2012: R+54.6 2008: R+44.1
Not yet ingested
- Civics
- —
Market trends
- HPI YoY
- ▲ 0.95%
- Current HPI
- 229.9918
- Rent YoY
- —
- Metro
- nan
- State GDP YoY
- ▲ 3.95%
- F500 in state
- 110
Industry mix (Fortune 500 HQ in TX)
| Industry | F500 HQs | Revenue |
|---|---|---|
| Energy | 16 | $1,198B |
|
||
| Technology | 5 | $198B |
|
||
| Engineering / Construction | 4 | $72B |
|
||
| Energy Services | 3 | $60B |
|
||
| Utilities | 3 | $41B |
|
||
| Healthcare | 2 | $330B |
|
||
Price history
+157.3% since first listed7 events — show timeline
- 2026-01-20 Listed $325,500 HLMLS as distributed by MLS GRID
- 2015-09-16 Sold (Public Records) — Public Records
- 2007-03-12 Sold (Public Records) $145,000 Public Records
- 2005-04-26 Sold (MLS) — Unlock MLS
- 2005-01-03 Listed $126,500 Unlock MLS
- 2004-12-07 Delisted — Unlock MLS
- 2004-08-18 Listed — Unlock MLS
Property tax history
+5.3%/yrLatest (2026): $4,793 · +0.0% YoY. Source: county tax records.
Cash-flow waterfall
monthlySold comps — $/sqft
last 12 mo · ≤1 miLoading sold comps…