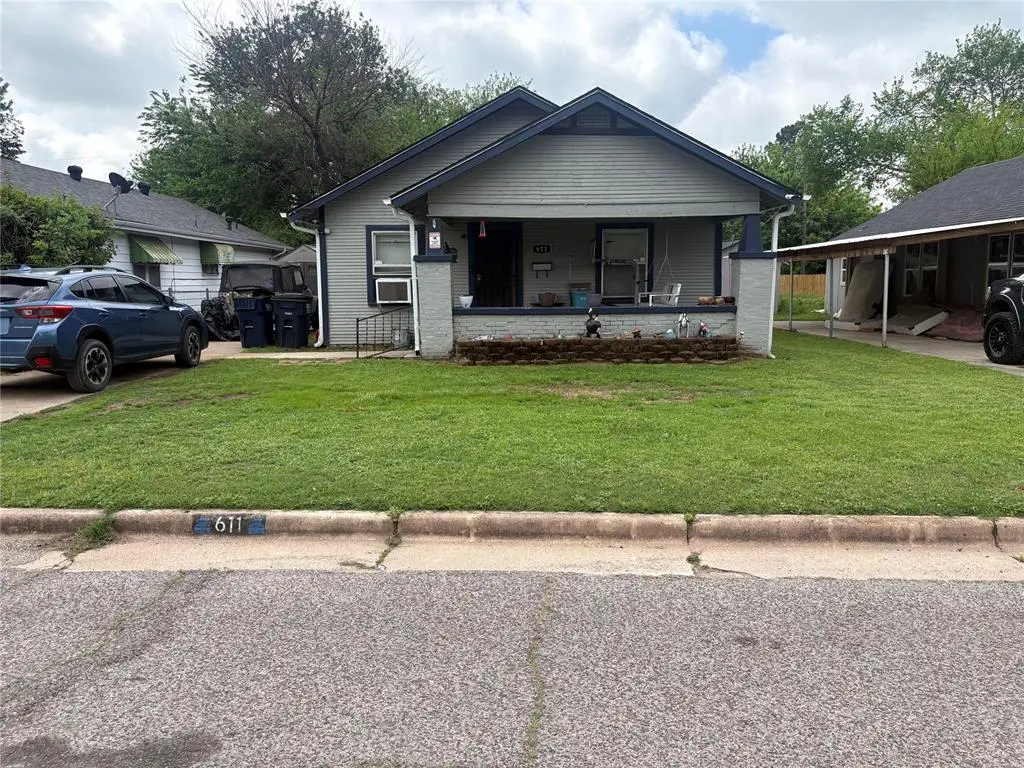
611 W Wood St · Shawnee, OK
Flood risk 1/10 · Minimal
- FEMA flood zone
- X (unshaded)
- Chance of flooding over 30 yrs
- 0.0%
- Est. flood insurance / yr
- $507 – $1,088
Fire risk 7/10 · Major
- Est. fire insurance / yr
- $2,463 – $4,575
Heat risk 6/10 · Moderate
- Hot days now (above 109°F)
- 7 days/yr
- Hot days in 30 yrs
- 18 days/yr
Wind risk 3/10 · Minor
- Chance of severe wind over 30 yrs
- 5.0%
Air-quality risk 2/10 · Minimal
- Unhealthy air days now
- 1 days/yr
- Unhealthy air days in 30 yrs
- 1 days/yr
Risk factors via First Street. Map © Google.
Why this score? — see what drove the C grade
The composite is a weighted blend of 9 inputs, each scored 0–100. Each bar is that input's sub-score; the figure is the points it added to the 100-point composite (weight × sub-score).
- Cash flow +23.3/30.0
- ARV discount +8.9/15.0
- DSCR +7.5/10.0
- 1% rule +4.9/10.0
- Rent growth +3.2/5.0
- Livability +3.2/5.0
- Appreciation +2.7/10.0
- Condition / age +2.5/5.0
- Schools +1.1/10.0
$114,900
🖨 Deal sheet 📄 Offer letter ✓ Due diligence
Listing remarks
Charming 1925 Craftsman Bungalow in Central Shawnee – Great Price, Move-In Ready with Room to Personalize! Discover timeless character in this classic 1925 Craftsman home, perfectly situated in the heart of Shawnee. With its iconic bungalow lines, sturdy construction, and warm original details, this home offers the perfect blend of historic appeal and modern livability. Many thoughtful updates have already been completed, but there’s still room for your personal touches to make it truly yours—ideal for the hands-on buyer or investor looking for excellent value. The layout flows naturally for comfortable everyday living and entertaining. Outside, the fully fenced yard provi
Key facts
- Raised garden beds
- Craftsman bungalow
- Fully fenced yard
Tags
Property features AI
Finance
- Other: Occupied by owner; Directions: South on Kickapoo, West on Wood; property on the left
- Financial info: Listing offered as-is; financing options include Cash, Conventional, FHA, VA, Rural Housing Services; Assumable: No; Loan qualification possible
- HOA & community: No mandatory association dues
Exterior
- Parking: 1-car garage
- Utilities: Public water and sewer not explicitly listed; Power: electric heating (utility service available)
- Home design: Single-family residence; One story; Property faces north; Existing property
- Construction: Other construction materials; Composition roof; Combination foundation; Built status: existing; Below-ground storm shelter
- Exterior features: Covered porch; Storage; Workshop; Wood fencing; Interior lot
Interior
- Kitchen: Range
- Bedrooms: 3 bedrooms (one-level property)
- Bathrooms: 1 full bathroom
- Heating & cooling: Electric heating; Window unit air conditioning
- Interior features: No fireplace; No in-law plan indicated
- Laundry & utility: Combination foundation (utility access noted in foundation details)
Neighborhood map
What this means for you Summary
Snapshot
- This is a 3-bed/1.0-bath single-family listed at $115k.
Deal economics
- At list price, monthly cash flow is $211 ($3k/yr) — positive.
- The deal already cash-flows at list — no discount required.
- To meet the 1% rule (rent ≥ 1% of price), the offer needs to be $113k (1.2% below list).
- Recommended offer: $111k (3.0% below list) — sets the bar for market timing.
- Cap rate 8.5% vs local median 3.9% in Shawnee — top-decile yield for the area; either an underpriced asset or a hidden risk that comps aren't pricing in. Stress-test before assuming the spread holds.
Location & tenants
- Location reads 63/100 on livability (#217 in OK) — a middle-class / working-renter tenant base. Strengths: cost of living A+, housing A+; Watch: crime F, amenities F, commute F.
- Shawnee (town): math 11% / reading 17% proficiency, ranked #238 of 270 in OK (top 88%) — low school quality limits family demand, transient renter base, plan for 1-2y turnover; 70% free/reduced lunch — lower-income household profile, screen leases tightly.
- Zoned schools: Shawnee Hs (math 16% / reading 35%, grade F, #142 of 447 statewide, top 32%, 987 students, 0% FRL) — zoned schools average 0% FRL vs 70% district-wide (70 pts lower); this property's tenant base skews higher-income than the district average.
- Market conditions: Rents rising (+2.8%/yr); 192 active listings in the ZIP; 5 comparable units currently listed for rent nearby; rentals leasing fast (median 5d on market — plan ~1-2 weeks tenant-placement turnaround); 183 units permitted in Pottawatomie County in 2024 (16 in 5+ unit buildings).
Forward outlook
- Local home prices are declining (-3.0%/yr); year-one equity from $794 of loan paydown is wiped out by about $3k of value loss. Plan a longer hold.
- Pottawatomie County population projected at +12% by 2050 — modest demand growth; plan on rents tracking national, not racing it.
Negotiation context
- It's been on market 54 days — a 3% lower offer ($111k) is reasonable based on typical stale-listing flexibility.
- 5 sale attempts since 23y ago with the ask held roughly flat each time — persistent listings suggest the price (not the market) is what's stuck; bring a comps-based counter.
- Current owner paid $30k; list at $115k implies a 284% gain — meaningful room to come down on a strong offer.
Risks & watch-outs
- Watch-outs: built in 1925 — expect roof / HVAC / electrical / plumbing capex.
- Climate carrying-cost: major wildfire risk; extreme-heat days projected 7→18/yr by 2055 (HVAC capex compounding) — expect insurance premiums to compound above CPI over the hold.
Questions for the listing agent
- It's been on market 54 days. Have you received any prior offers? Is the seller open to a 3% concession, seller financing, or rate buy-down credit?
- Built in 1925 — when were the roof, HVAC, electrical panel, plumbing, and water heater last replaced?
- Is there a deadline driving the sale (1031 exchange, divorce, estate, relocation)? That informs how much negotiation room exists.
- Schools are F-rated, which usually means shorter tenancies and higher turnover. Who's the typical renter profile here, and what's been the actual vacancy rate?
- Crime grade is F in this area — have there been break-ins, vandalism, or insurance claims at this property in the last 3 years? What carrier currently insures it and at what premium?
- What's the average days-on-market for RENTAL listings here right now (not sales)? A rising rental-DOM trend means longer vacancies and softer asking-rent achievability than the comps imply.
- What's the recent tenant-quality profile in this submarket — average credit score on applications, eviction rate, late-payment / NSF rate, and stable-employment percentage? A property-management company in the area should have these aggregated.
- How much new for-sale + rental construction is in the pipeline within 1–3 miles? Heavy new supply typically softens prices + rents 12–24 months out; constrained supply supports both.
Investment metrics
- 1% rule
- 0.99% ✗
- Cap rate
- 8.50%
- Cash-on-cash
- 7.88%
- DSCR
- 1.35
- GRM
- 8.4
CMA / ARV
- ARV (on-the-fly)
- $118,534
- Comps found
- 12
Show comp detail 12 sales within ~0.75 mi
| Address | Dist | Beds/Ba | Sqft | Sold | Price | $/sf | Match |
|---|---|---|---|---|---|---|---|
| 706 N Louisa Ave | 0.25mi | 2/1.0 (-1) | 1,229 (+1%) | 3mo | $43,500 | $35 | 80 |
| 1220 W Dewey St | 0.33mi | 3/2.0 | 1,232 (+1%) | 1mo | $120,000 | $97 | 78 |
| 607 W Poplar St | 0.44mi | 3/2.0 | 1,216 (-0%) | 1mo | $45,000 | $37 | 74 |
| 635 W Ford St | 0.13mi | 3/1.0 | 1,088 (-11%) | 2mo | $140,000 | $129 | 74 |
| 513 N Dorothy Ave | 0.30mi | 2/2.0 (-1) | 1,294 (+6%) | 2mo | $136,900 | $106 | 65 |
| 220 N Aydelotte Ave | 0.56mi | 3/1.5 | 1,186 (-3%) | 3mo | $43,500 | $37 | 65 |
| 601 N Bonita Ave | 0.27mi | 4/2.0 (+1) | 1,350 (+10%) | 0mo | $155,000 | $115 | 60 |
| 712 W Kirk St | 0.41mi | 3/1.0 | 1,395 (+14%) | 1mo | $166,000 | $119 | 57 |
| 515 W 10th St | 0.55mi | 3/2.0 | 1,131 (-7%) | 3mo | $43,500 | $38 | 56 |
| 1422 W Wheeler St | 0.49mi | 3/1.0 | 1,071 (-12%) | 2mo | $35,000 | $33 | 54 |
| 527 W 10th St Unit 527/529 | 0.54mi | 3/1.0 | 1,058 (-13%) | 3mo | $43,500 | $41 | 50 |
| 902 N Beard Ave | 0.50mi | 3/2.0 | 1,056 (-14%) | 1mo | $160,900 | $152 | 49 |
Match score weights: distance 35% · size 25% · config 20% · recency 20%. Top-matched comps best support the ARV.
Projected returns pro-forma
-3.0% appreciation · 2.82% rent growth · sell at horizon
- IRR
- -4.5%
- Equity multiple
- 0.83×
- Total profit
- $-5,417
- Equity at exit
- $17,132
- IRR
- 4.9%
- Equity multiple
- 1.36×
- Total profit
- $11,569
- Equity at exit
- $9,934
Cash invested: $32,172 (down + closing). Projections, not guarantees.
Landlord ↔ Tenant lean methodology
- Overall (STATE)
- 83 Strongly Landlord-Friendly
- State Oklahoma
- 83 Strongly Landlord-Friendly · R+20
- County
- — inherits STATE
- City
- — inherits STATE
ZIP-level market 74801
- Home prices YoY
- -1.7%
- Rents YoY
- 2.8%
- Active inventory
- 192
- Price-to-rent
- 8.4×
Monthly cashflow live
- Estimated rent
- $1,135 high interval (Pro) →
- Mortgage (P&I)
- −$603
- Tax from tax record
- −$35 /mo · $417/yr
- Insurance
- −$48
- HOA
- −$0
- Vacancy / Maint / Mgmt
- −$238
- Net cashflow
- $211
Break-even live
UW: 25.0% down · 7.5% · 30yr · 1.5% tax · 5.0% vac · 8.0% maint · 8.0% mgmt
Financing live
Cash to close
- Down payment
- $28,725
- Closing costs
- $3,447
- Reserves months
- —
- Total cash needed
- —
Loan-product check · same deal, 3 products live
Conventional
25% down · 7.5% · 30yr
- Down + closing
- —
- Monthly P&I
- —
- Monthly cashflow
- —
- DSCR
- —
- Eligible?
- —
Personal DTI + credit; lowest rate.
DSCR
20% down · 8.5% · 30yr
- Down + closing
- —
- Monthly P&I
- —
- Monthly cashflow
- —
- DSCR
- —
- Eligible?
- —
No personal income docs; deal must DSCR.
Hard money
10% down · 12.0% · 12mo
- Down + closing
- —
- Monthly P&I
- —
- Monthly cashflow
- —
- DSCR
- —
- Eligible?
- —
Short-term bridge; refi at stabilization.
Rent comps 5 comps
| Address | Beds | Baths | Sqft | Rent | $/sqft | DOM | Units | Dist |
|---|---|---|---|---|---|---|---|---|
| 414 N Aydelotte Ave Shawnee, OK | 2.0 | 2.0 | 864 | $1,250 | $1.45 | 4d | 1 | 0.37mi |
| 515 W 10th St Shawnee, OK | 3.0 | 1.0 | 1131 | $825 | $0.73 | 20d | 1 | 0.51mi |
| 315 S Kennedy Ave Shawnee, OK | 2.0–3.0 | 1.0–2.0 | 979 | $898 | $0.92 | 23d | 5 | 0.99mi |
| 721 E Wallace St Shawnee, OK | 2.0 | 1.0 | 1176 | $850 | $0.72 | 4d | 1 | 1.08mi |
| 319 S Center Ave Shawnee, OK | 3.0 | 2.0 | 1243 | $1,245 | $1.00 | 4d | 1 | 1.35mi |
Listing history 17 events
-
2026-06-09days on market $114,900 Active 54 DOM
-
2026-06-08days on market $114,900 Active 53 DOM
-
2026-06-07days on market $114,900 Active 52 DOM
-
2026-06-05days on market $114,900 Active 49 DOM
-
2026-06-02days on market $114,900 Active 47 DOM
-
2026-06-01days on market $114,900 Active 46 DOM
-
2026-05-31days on market $114,900 Active 45 DOM
-
2026-05-30days on market $114,900 Active 44 DOM
-
2026-04-16$114,900 Active
-
2018-01-03historical
-
2017-05-02status Active
-
2017-05-01historical
-
2016-10-21$69,900 Active
-
2015-12-31historical
-
2015-06-11$79,900 Active
-
2004-11-05soldstatus $29,900
-
2003-07-16$29,900
ⓘ Source: listings_history table (triggers on properties + properties_extension) + one-shot
backfill from property_details.listing_events for pre-trigger history.
Tax reassessment forecast OK · Resets to sale price
- Current annual tax
- $417 · $35/mo
- Projected year-2 tax
- $1,034 · $86/mo
- Expected delta
- +$617/yr (+$51/mo · 148.0%)
ⓘ Screening estimate from a state-policy table — verify with the county assessor before closing.
Climate risk First Street
- Flood 1/10 Low FEMA zone X (unshaded) · 0% chance over 30 yrs
- Wildfire 7/10 Severe
- Heat 6/10 Major 7 d/yr ≥109°F today · 18 d/yr by 30 yrs out
- Wind 3/10 Moderate 5% chance of damaging wind over 30 yrs
- Air quality 2/10 Low 1 unhealthy d/yr today · 1 by 30 yrs out
Nearby sold comps map
Loading sold comps map…
Walkable amenities ~0.75 mi
Loading nearby amenities…
Taxation est. · year 1
- Rental income
- $13,617
- − Mortgage interest
- −$6,436
- − Property taxes
- −$417
- − Insurance
- −$574
- − Repairs & maintenance
- −$1,089
- − Management
- −$1,089
- − Depreciation
- −$3,343
- Taxable income
- $668
- Est. tax owed @ 24.0%
- −$160
- After-tax cash flow
- $2,375/yr
For passive investors: Depreciation is non-cash, so a rental often shows a tax loss while cash-flowing — sheltering income. Rental losses are passive: they offset passive income freely, and up to $25,000/yr can offset ordinary (W-2) income if you actively participate and your MAGI is under $100k (phasing out to $0 by $150k); unused losses carry forward. On sale, claimed depreciation is recaptured at up to 25%, and gains may owe capital-gains tax (a 1031 exchange can defer both). Figures are a year-1 estimate at your 24.0% rate — not tax advice; consult a CPA.
Schools (NCES district)
- District
- Shawnee
- NCES district ID
- 4027570
- Math proficiency
- 11% ▼ -10.00%
- Reading proficiency
- 17% ▼ -10.00%
- Median HH income
- $32,128
- Composite
- 11.21/100
- National rank
- #9724
- State rank
- #238 of 270 in OK
Livability — Shawnee
- Score
- 63/100
- State rank
- #217
- US rank
- #15593
Category grades
Schools grade is shown separately in the Schools card above.
Census & demographics
- Census place
- Shawnee, OK
- County
- Pottawatomie County · 45,194 people
- City population
- 45,194
- Metro
- Shawnee, OK
- Population (ZIP)
- 21,967
- Household income
- $55,077
- Rent vs Own
- Severe rent burden
- 594.0
Population outlook (Pottawatomie County) Hauer SSP2
- Today (2025)
- 76,622 people
- By 2030
- 78,816 · +2.9%
- By 2040
- 82,766 · +8.0%
- By 2050
- 86,031 · +12.3%
- By 2075
- 93,316 · +21.8%
- By 2100
- 95,820 · +25.1%
Race, ethnicity, and origin ACS 2023
- Neighborhood character
- Predominantly White (67%)
- Race & ethnicity
- White 67% Native American 15% Two or more races 10% Hispanic / Latino 7% Black 3%
- Hispanic origin (detail)
- Mexican 6%
- Common ancestry
- Lithuanian 1% Slovak 1% Italian 1%
- Foreign-born
- 2% · Canada
- Languages at home
- 96% English-only · Spanish 2% Other Asian/Pacific 1%
Political lean MEDSL · Pottawatomie
- 2024 margin
- Solid R (+47.4) · D 25.2% · R 72.7% · Other 2.1%
- 2008→2024 swing
- -9.1pp toward R · 2008: -38.4pp · 2024: -47.4pp
- All cycles
- 2024: R+47.4 2020: R+46.0 2016: R+46.5 2012: R+38.7 2008: R+38.4
Not yet ingested
- Civics
- —
Market trends
- HPI YoY
- ▼ -4.66%
- Current HPI
- 266.7965
- Rent YoY
- ▲ 2.82%
- Metro
- Shawnee, OK
- State GDP YoY
- ▲ 1.55%
- F500 in state
- 6
Industry mix (Fortune 500 HQ in OK)
| Industry | F500 HQs | Revenue |
|---|---|---|
| Energy | 3 | $48B |
|
||
Price history
+284.3% since first listed9 events — show timeline
- 2026-04-16 Listed $114,900 MLSOK
- 2018-01-03 Listing Removed — MLSOK
- 2017-05-02 Relisted — MLSOK
- 2017-05-01 Listing Removed — MLSOK
- 2016-10-21 Listed $69,900 MLSOK
- 2015-12-31 Listing Removed — MLSOK
- 2015-06-11 Listed $79,900 MLSOK
- 2004-11-05 Sold (MLS) $29,900 MLSOK
- 2003-07-16 Listed $29,900 MLSOK
Property tax history
+3.6%/yrLatest (2025): $417 · +3.0% YoY. Source: county tax records.
Cash-flow waterfall
monthlySold comps — $/sqft
last 12 mo · ≤1 miLoading sold comps…