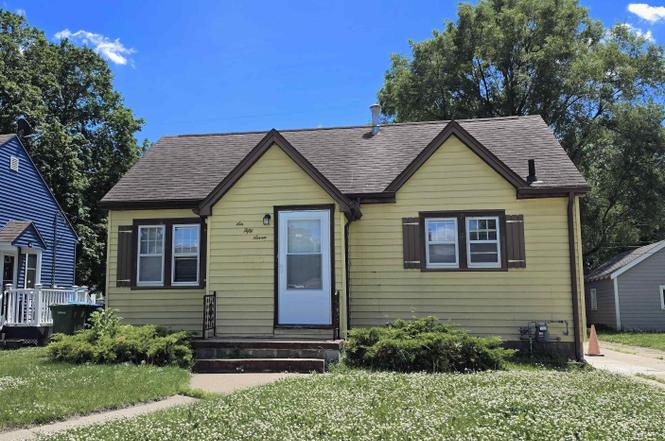
657 Dawson St · Waterloo, IA
Flood risk 1/10 · Minimal
- FEMA flood zone
- X
- Chance of flooding over 30 yrs
- 0.0%
- Est. flood insurance / yr
- $473 – $860
Fire risk 1/10 · Minimal
- Est. fire insurance / yr
- $902 – $1,676
Heat risk 3/10 · Minor
- Hot days now (above 101°F)
- 7 days/yr
- Hot days in 30 yrs
- 15 days/yr
Wind risk 2/10 · Minimal
- Chance of severe wind over 30 yrs
- —
Air-quality risk 1/10 · Minimal
- Unhealthy air days now
- 0 days/yr
- Unhealthy air days in 30 yrs
- 0 days/yr
Risk factors via First Street. Map © Google.
Why this score? — see what drove the D+ grade
The composite is a weighted blend of 9 inputs, each scored 0–100. Each bar is that input's sub-score; the figure is the points it added to the 100-point composite (weight × sub-score).
- Cash flow +19.9/30.0
- DSCR +6.3/10.0
- 1% rule +5.5/10.0
- Schools +4.4/10.0
- Rent growth +4.2/5.0
- Livability +4.0/5.0
- Condition / age +2.5/5.0
- ARV discount +0.0/15.0
- Appreciation +0.0/10.0
$80,000
🖨 Deal sheet (PDF) 📄 Offer letter ✓ Due diligence
Listing remarks
Charming, recently remodeled 2-bedroom, 1-bathroom single-family home in a quiet Waterloo neighborhood. Features beautiful real wood floors, a bright and functional living layout, and a full unfinished basement perfect for storage or a hobby space. Centrally located with fast access to both Waterloo and Cedar Falls hubs, local colleges, and medical centers. Pet-friendly. Ready for immediate move-in or immediate addition to your rental portfolio.
Key facts
- Local colleges
- Real wood floors
- 6,500 sq ft lot
Tags
Property features AI
Exterior
- Parking: Carport (1 space)
- Utilities: Public water; Public sewer
- Home design: Single-family residence; Residential property
- Construction: Aluminum siding; Asphalt roof; Basement (block)
- Exterior features: Concrete road access; Lot approximately 50 x 130 (0.15 acres); Zoned R-2
Interior
- Bathrooms: 1 full bathroom
- Heating & cooling: Forced air heating (natural gas); No cooling
- Interior features: No fireplace; Basement with block construction
Neighborhood map
What this means for you Summary
Snapshot
- This is a 2-bed/1.0-bath single-family listed at $80k.
Deal economics
- At list price, monthly cash flow is $97 ($1k/yr) — positive.
- The deal already cash-flows at list — no discount required.
- Meets the 1% rule at list price ($840 rent vs $80k).
- Cap rate 7.7% vs local median 4.2% in Waterloo — top-decile yield for the area; either an underpriced asset or a hidden risk that comps aren't pricing in. Stress-test before assuming the spread holds.
Location & tenants
- Location reads 81/100 on livability (#74 in IA, #1,589 nationally) — a professional / high-income tenant draw. Strengths: commute A+, cost of living A+, housing A+; Watch: crime F, employment D-.
- Waterloo Community School District (urban): math 50% / reading 54% proficiency, ranked #276 of 289 in IA (top 96%) — acceptable for families but not a draw, mixed tenant base, ~2y average lease.
- Zoned schools: Lincoln Elementary School (math 38% / reading 42%, grade F, #576 of 616 statewide, top 94%, 471 students, 86% FRL); George Washington Carver Academy (math 36% / reading 43%, grade F, #240 of 246 statewide, top 98%, 442 students, 91% FRL); East High School (math 39% / reading 58%, grade D, #317 of 336 statewide, top 94%, 1,022 students, 73% FRL) — zoned schools average 83% FRL vs 58% district-wide (25 pts higher); higher-poverty schools than district average — tighter screening recommended.
- Market conditions: Rents rising fast (+6.7%/yr); 98 active listings in the ZIP; 16 comparable units currently listed for rent nearby; rentals lingering (median 44d on market — plan ~5-8 weeks vacancy on turnover, expect pricing pressure); 56% of comp listings sitting > 30 days — soft ceiling on asking rent; 287 units permitted in Black Hawk County in 2024 (67 in 5+ unit buildings).
Forward outlook
- Local home prices are declining (-3.0%/yr); year-one equity from $553 of loan paydown is wiped out by about $2k of value loss. Plan a longer hold.
- Black Hawk County population projected at +10% by 2050 — modest demand growth; plan on rents tracking national, not racing it.
- At projected returns (-3.0% appreciation + 6.7% rent growth), your $22k cash investment doubles in ~10 years — after that, you're playing with house money.
Negotiation context
- Only 2 days on market — expect competitive offers; lowballing is unlikely to land.
- 2 sale attempts with the ask held roughly flat each time — persistent listings suggest the price (not the market) is what's stuck; bring a comps-based counter.
Risks & watch-outs
- Watch-outs: built in 1941 — expect roof / HVAC / electrical / plumbing capex.
Questions for the listing agent
- Built in 1941 — when were the roof, HVAC, electrical panel, plumbing, and water heater last replaced?
- Is there a deadline driving the sale (1031 exchange, divorce, estate, relocation)? That informs how much negotiation room exists.
- Crime grade is F in this area — have there been break-ins, vandalism, or insurance claims at this property in the last 3 years? What carrier currently insures it and at what premium?
- The area grade is low — what's the realistic commute time and amenity access for the typical tenant pool here? Any planned neighborhood developments (good or bad) we should know about?
- What's the average days-on-market for RENTAL listings here right now (not sales)? A rising rental-DOM trend means longer vacancies and softer asking-rent achievability than the comps imply.
- What's the recent tenant-quality profile in this submarket — average credit score on applications, eviction rate, late-payment / NSF rate, and stable-employment percentage? A property-management company in the area should have these aggregated.
- How much new for-sale + rental construction is in the pipeline within 1–3 miles? Heavy new supply typically softens prices + rents 12–24 months out; constrained supply supports both.
Investment metrics
- 1% rule
- 1.05% ✓
- Cap rate
- 7.74%
- Cash-on-cash
- 5.18%
- DSCR
- 1.23
- GRM
- 7.9
CMA / ARV
- ARV (on-the-fly)
- $66,432
- Comps found
- 12
Show comp detail 12 sales within ~0.75 mi
| Address | Dist | Beds/Ba | Sqft | Sold | Price | $/sf | Match |
|---|---|---|---|---|---|---|---|
| 745 Dawson St | 0.11mi | 1/1.0 (-1) | 662 (-4%) | 18mo | $85,000 | $128 | 68 |
| 640 Kern St | 0.09mi | 2/1.0 | 766 (+11%) | 14mo | $55,000 | $72 | 66 |
| 658 Newton St | 0.15mi | 2/1.5 | 734 (+6%) | 21mo | $70,500 | $96 | 64 |
| 433 Kern St | 0.31mi | 2/1.0 | 658 (-5%) | 23mo | $88,500 | $134 | 58 |
| 1226 Lincoln St | 0.58mi | 2/1.0 | 720 (+4%) | 10mo | $68,000 | $94 | 58 |
| 750 Newton St | 0.20mi | 2/1.0 | 773 (+12%) | 17mo | $140,000 | $181 | 57 |
| 1118 Kern St | 0.56mi | 2/1.0 | 660 (-5%) | 15mo | $88,700 | $134 | 54 |
| 314 Crescent Pl | 0.56mi | 2/1.0 | 772 (+12%) | 2mo | $37,000 | $48 | 53 |
| 1124 Kern St | 0.57mi | 2/1.0 | 740 (+7%) | 12mo | $64,000 | $86 | 52 |
| 707 Lincoln St | 0.44mi | 2/1.0 | 638 (-8%) | 18mo | $58,000 | $91 | 52 |
| 324 Columbia St | 0.50mi | 2/1.0 | 752 (+9%) | 13mo | $40,000 | $53 | 51 |
| 1145 Newton St | 0.62mi | 2/1.0 | 672 (-3%) | 20mo | $98,500 | $147 | 49 |
Match score weights: distance 35% · size 25% · config 20% · recency 20%. Top-matched comps best support the ARV.
Projected returns pro-forma
-3.0% appreciation · 6.67% rent growth · sell at horizon
- IRR
- -4.1%
- Equity multiple
- 0.84×
- Total profit
- $-3,565
- Equity at exit
- $11,928
- IRR
- 9.5%
- Equity multiple
- 1.86×
- Total profit
- $19,154
- Equity at exit
- $6,917
Cash invested: $22,400 (down + closing). Projections, not guarantees.
Landlord ↔ Tenant lean methodology
- Overall (STATE)
- 83 Strongly Landlord-Friendly
- State Iowa
- 83 Strongly Landlord-Friendly · R+6
- County
- — inherits STATE
- City
- — inherits STATE
ZIP-level market 50703
- Rents YoY
- 6.7%
- Active inventory
- 98
- Price-to-rent
- 7.9×
Monthly cashflow live
- Estimated rent
- $840 high interval (Pro) →
- Mortgage (P&I)
- −$420
- Tax from tax record
- −$114 /mo · $1,372/yr
- Insurance
- −$33
- HOA
- −$0
- Vacancy / Maint / Mgmt
- −$176
- Net cashflow
- $97
Break-even live
Sensitivity live
| Price | -10% $142 | -5% $119 | +0% $97 | +5% $74 | +10% $51 |
|---|---|---|---|---|---|
| Rent | -10% $30 | -5% $64 | +0% $97 | +5% $130 | +10% $163 |
| Rate | -1.0pp $137 | -0.5pp $117 | base $97 | +0.5pp $76 | +1.0pp $55 |
UW: 25.0% down · 7.5% · 30yr · 1.5% tax · 5.0% vac · 8.0% maint · 8.0% mgmt
Financing live
Cash to close
- Down payment
- $20,000
- Closing costs
- $2,400
- Reserves months
- —
- Total cash needed
- —
Loan-product check · same deal, 3 products live
Conventional
25% down · 7.5% · 30yr
- Down + closing
- —
- Monthly P&I
- —
- Monthly cashflow
- —
- DSCR
- —
- Eligible?
- —
Personal DTI + credit; lowest rate.
DSCR
20% down · 8.5% · 30yr
- Down + closing
- —
- Monthly P&I
- —
- Monthly cashflow
- —
- DSCR
- —
- Eligible?
- —
No personal income docs; deal must DSCR.
Hard money
10% down · 12.0% · 12mo
- Down + closing
- —
- Monthly P&I
- —
- Monthly cashflow
- —
- DSCR
- —
- Eligible?
- —
Short-term bridge; refi at stabilization.
Rent comps 16 comps
| Address | Beds | Baths | Sqft | Rent | $/sqft | DOM | Units | Dist |
|---|---|---|---|---|---|---|---|---|
| 661 Dawson St Waterloo, IA | 2.0 | 1.0 | 704 | $895 | $1.27 | 21d | 1 | 0.01mi |
| 657 Dawson St Waterloo, IA | 2.0 | 1.0 | 692 | $810 | $1.17 | 44d | 1 | 0.01mi |
| 1132 Ackermant St Waterloo, IA | 2.0 | 1.0 | 685 | $825 | $1.20 | 44d | 1 | 0.41mi |
| 307 Riehl St Waterloo, IA | 2.0 | 1.0 | 640 | $825 | $1.29 | 21d | 1 | 0.43mi |
| 1137 Columbia St Waterloo, IA | 1.0 | 1.0 | 588 | $725 | $1.23 | 21d | 1 | 0.45mi |
| 1124 Kern St Waterloo, IA | 2.0 | 1.0 | 740 | $950 | $1.28 | 44d | 1 | 0.57mi |
| 118 Harrison St Waterloo, IA | 2.0 | 1.0 | 600 | $500 | $0.83 | 44d | 1 | 0.75mi |
| 322 Lester St Waterloo, IA | 2.0 | 1.0 | 672 | $850 | $1.26 | 44d | 1 | 1.05mi |
| 303 Franklin St Apt 2 Waterloo, IA | 2.0 | 1.0 | 600 | $650 | $1.08 | 44d | 1 | 1.06mi |
| 21 W Jefferson St Waterloo, IA | 1.0 | 1.0 | 711 | $1,410 | $1.98 | 21d | 6 | 1.13mi |
| 515 Stokes Dr Waterloo, IA | 1.0 | 1.0 | 664 | $675 | $1.02 | 44d | 1 | 1.18mi |
| 335 Cedar St Waterloo, IA | 1.0 | 1.0 | 540 | $1,510 | $2.80 | 21d | 1 | 1.24mi |
| 102 1/2 South St Waterloo, IA | 1.0 | 1.0 | 668 | $550 | $0.82 | 21d | 1 | 1.29mi |
| 606 Sycamore St Unit A Waterloo, IA | 1.0 | 1.0 | 622 | $875 | $1.41 | 44d | 1 | 1.33mi |
| 611 Sycamore St Unit 302 Waterloo, IA | 1.0 | 1.0 | 550 | $750 | $1.36 | 21d | 1 | 1.33mi |
| 211 W Wellington St Unit 211 1/2 Wellington Waterloo, IA | 1.0 | 1.0 | 600 | $600 | $1.00 | 44d | 1 | 1.41mi |
Listing history 4 events
-
2026-06-18status $80,000 Pending 2 DOM
-
2026-06-17days on market $80,000 Active 2 DOM
-
2026-06-15remarks 450-char remark
-
2026-06-15$80,000 Active 1 DOM
ⓘ Source: listings_history table (triggers on properties + properties_extension) + one-shot
backfill from property_details.listing_events for pre-trigger history.
Tax reassessment forecast IA · Partial reset (capped growth)
- Current annual tax
- $1,372 · $114/mo
- Projected year-2 tax
- $1,372 · $114/mo
- Expected delta
- $0/yr ($0/mo · 0.0%)
ⓘ Screening estimate from a state-policy table — verify with the county assessor before closing.
Climate risk First Street
- Flood 1/10 Low FEMA zone X · 0% chance over 30 yrs
- Wildfire 1/10 Low
- Heat 3/10 Moderate 7 d/yr ≥101°F today · 15 d/yr by 30 yrs out
- Wind 2/10 Low
- Air quality 1/10 Low 0 unhealthy d/yr today · 0 by 30 yrs out
Nearby sold comps map
Loading sold comps map…
Walkable amenities ~0.75 mi
Loading nearby amenities…
Taxation est. · year 1
- Rental income
- $10,085
- − Mortgage interest
- −$4,481
- − Property taxes
- −$1,372
- − Insurance
- −$400
- − Repairs & maintenance
- −$807
- − Management
- −$807
- − Depreciation
- −$2,327
- Taxable loss
- −$109
- Est. tax savings @ 24.0%
- +$26
- After-tax cash flow
- $1,187/yr
For passive investors: Depreciation is non-cash, so a rental often shows a tax loss while cash-flowing — sheltering income. Rental losses are passive: they offset passive income freely, and up to $25,000/yr can offset ordinary (W-2) income if you actively participate and your MAGI is under $100k (phasing out to $0 by $150k); unused losses carry forward. On sale, claimed depreciation is recaptured at up to 25%, and gains may owe capital-gains tax (a 1031 exchange can defer both). Figures are a year-1 estimate at your 24.0% rate — not tax advice; consult a CPA.
Schools (NCES district)
- District
- Waterloo Community School District
- NCES district ID
- 1930480
- Math proficiency
- 50% ▼ -4.00%
- Reading proficiency
- 54% ▲ 1.00%
- Median HH income
- $42,545
- Composite
- 43.72/100
- National rank
- #2950
- State rank
- #276 of 289 in IA
Livability — Waterloo
- Score
- 81/100
- State rank
- #74
- US rank
- #1589
Category grades
Schools grade is shown separately in the Schools card above.
Census & demographics
- Census place
- Waterloo, IA
- County
- Black Hawk County · 112,933 people
- City population
- 69,066
- Metro
- Waterloo-Cedar Falls, IA
- Population (ZIP)
- 17,952
- Household income
- $50,060
- Rent vs Own
- Severe rent burden
- 871.0
Population outlook (Black Hawk County) Hauer SSP2
- Today (2025)
- 139,716 people
- By 2030
- 142,853 · +2.2%
- By 2040
- 147,843 · +5.8%
- By 2050
- 153,247 · +9.7%
- By 2075
- 167,977 · +20.2%
- By 2100
- 177,320 · +26.9%
Race, ethnicity, and origin ACS 2023
- Neighborhood character
- Diverse neighborhood (Simpson 0.62)
- Race & ethnicity
- White 55% Black 26% Hispanic / Latino 10% Two or more races 7% Asian 2%
- Hispanic origin (detail)
- Mexican 6%
- Common ancestry
- Iranian 1% Portuguese 1% Lithuanian 1%
- Foreign-born
- 7% · Canada, Philippines, China
- Languages at home
- 89% English-only · Spanish 7% Other Asian/Pacific 2% Russian/Polish/Slavic 1%
Political lean MEDSL · Black Hawk
- 2024 margin
- Toss-up / Even · D 50.0% · R 48.8% · Other 1.2%
- 2008→2024 swing
- -21.3pp toward R · 2008: 22.4pp · 2024: 1.2pp
- All cycles
- 2024: D+1.2 2020: D+9.0 2016: D+7.3 2012: D+20.0 2008: D+22.4
Not yet ingested
- Civics
- —
Market trends
- HPI YoY
- ▼ -117.18%
- Current HPI
- 132.9478
- Rent YoY
- ▲ 6.67%
- Metro
- Waterloo-Cedar Falls, IA
- State GDP YoY
- ▲ 2.48%
- F500 in state
- 4
Industry mix (Fortune 500 HQ in IA)
| Industry | F500 HQs | Revenue |
|---|---|---|
| Financial Services | 1 | $16B |
|
||
| Retail / Convenience | 1 | $15B |
|
||
Price history
5 events — show timeline
- 2026-06-15 Rental Removed $810 APPFOLIO
- 2026-06-11 Listed $80,000 NEIRBR as distributed by MLS GRID
- 2026-03-08 Price Changed $810 APPFOLIO
- 2026-02-06 Price Changed $825 APPFOLIO
- 2025-12-18 Listed for Rent $850 APPFOLIO
Property tax history
+2.1%/yrLatest (2025): $1,372 · +8.5% YoY. Source: county tax records.
Cash-flow waterfall
monthlySold comps — $/sqft
last 12 mo · ≤1 miLoading sold comps…