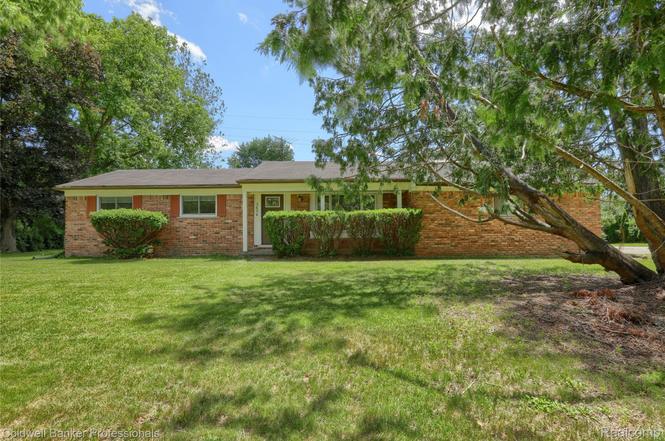
3634 South Blvd · Bloomfield, MI
Flood risk No data
- FEMA flood zone
- —
- Chance of flooding over 30 yrs
- %
- Est. flood insurance / yr
- —
Fire risk No data
- Est. fire insurance / yr
- —
Heat risk No data
- Hot days now (above °F)
- days/yr
- Hot days in 30 yrs
- days/yr
Wind risk No data
- Chance of severe wind over 30 yrs
- %
Air-quality risk No data
- Unhealthy air days now
- days/yr
- Unhealthy air days in 30 yrs
- days/yr
Risk factors via First Street. Map © Google.
Why this score? — see what drove the B grade
The composite is a weighted blend of 9 inputs, each scored 0–100. Each bar is that input's sub-score; the figure is the points it added to the 100-point composite (weight × sub-score).
- Cash flow +27.3/30.0
- ARV discount +14.9/15.0
- DSCR +9.5/10.0
- 1% rule +7.4/10.0
- Schools +3.7/10.0
- Rent growth +2.5/5.0
- Livability +2.5/5.0
- Condition / age +2.5/5.0
- Appreciation +0.0/10.0
$279,900
🖨 Deal sheet 📄 Offer letter ✓ Due diligence
Listing remarks
This lovingly maintained ALL BRICK RANCH w/ an attached 2 car garage offers almost 1400 square feet of living space! Features hardwood flooring, living room, spacious kitchen with lots of cabinets, large family room with fireplace, 3 good sized bedrooms, main bath w/ double vanity & handy half bath. Located on . 52 of an acre with a beautifully private backyard area for your outdoor living pleasure! New HVAC & HWH in 2024, windows on back of house including door wall replaced in 2024 w/ Anderson. On city water and BRAND NEW SEPTIC SYSTEM 5/2026. To reduce heating bills take advantage of the solar heater w/ electric circuit. Partial finished basement. This home is waiting for
Key facts
- Hardwood flooring
- Double vanity
- Large family room
Tags
Neighborhood map
What this means for you Summary
Snapshot
- This is a 3-bed/1.5-bath single-family listed at $280k.
Deal economics
- At list price, monthly cash flow is $812 ($10k/yr) — positive.
- The deal already cash-flows at list — no discount required.
- Meets the 1% rule at list price ($3k rent vs $280k).
Location & tenants
- Location reads: area grade B — affects rentability + tenant quality, not the cash-flow math above.
- Avondale School District (suburban): math 34% / reading 48% proficiency, ranked #162 of 540 in MI (top 30%) — families likely to look elsewhere, expect single-tenant / working-renter base with shorter leases.
- Market conditions: 128 active listings in the ZIP; 8 comparable units currently listed for rent nearby; rentals leasing fast (median 2d on market — plan ~1-2 weeks tenant-placement turnaround); high-income renter base; 2,614 units permitted in Oakland County in 2024 (721 in 5+ unit buildings).
Forward outlook
- Local home prices are declining (-3.0%/yr); year-one equity from $2k of loan paydown is wiped out by about $8k of value loss. Plan a longer hold.
- Oakland County population projected at +10% by 2050 — modest demand growth; plan on rents tracking national, not racing it.
- At projected returns (-3.0% appreciation + 3.0% rent growth), your $78k cash investment doubles in ~10 years — after that, you're playing with house money.
Negotiation context
- Only 1 days on market — expect competitive offers; lowballing is unlikely to land.
Questions for the listing agent
- Built in 1963 — when were the roof, HVAC, electrical panel, plumbing, and water heater last replaced?
- Is there a deadline driving the sale (1031 exchange, divorce, estate, relocation)? That informs how much negotiation room exists.
- What's the average days-on-market for RENTAL listings here right now (not sales)? A rising rental-DOM trend means longer vacancies and softer asking-rent achievability than the comps imply.
- What's the recent tenant-quality profile in this submarket — average credit score on applications, eviction rate, late-payment / NSF rate, and stable-employment percentage? A property-management company in the area should have these aggregated.
- How much new for-sale + rental construction is in the pipeline within 1–3 miles? Heavy new supply typically softens prices + rents 12–24 months out; constrained supply supports both.
Investment metrics
- 1% rule
- 1.24% ✓
- Cap rate
- 9.77%
- Cash-on-cash
- 12.44%
- DSCR
- 1.55
- GRM
- 6.7
CMA / ARV
- ARV (on-the-fly)
- $335,291
- Comps found
- 12
Show comp detail 12 sales within ~0.75 mi
| Address | Dist | Beds/Ba | Sqft | Sold | Price | $/sf | Match |
|---|---|---|---|---|---|---|---|
| 1299 Winchcombe Dr | 0.09mi | 3/2.0 | 1,589 (-11%) | 5mo | $350,000 | $220 | 71 |
| 1371 Winchcombe Dr | 0.26mi | 3/2.0 | 1,603 (-11%) | 0mo | $315,000 | $197 | 68 |
| 1310 Winchcombe Dr | 0.13mi | 3/1.5 | 1,589 (-11%) | 10mo | $390,000 | $245 | 66 |
| 1530 Ashover Dr | 0.51mi | 3/2.0 | 1,827 (+2%) | 10mo | $427,400 | $234 | 63 |
| 295 Oakmont St | 0.65mi | 3/2.5 | 1,766 (-2%) | 14mo | $285,500 | $162 | 52 |
| 3207 Caroline St | 0.57mi | 3/1.5 | 1,542 (-14%) | 2mo | $236,000 | $153 | 48 |
| 3221 Bessie St | 0.49mi | 3/1.5 | 1,534 (-14%) | 6mo | $305,000 | $199 | 48 |
| 3901 Nelda Hill Ln | 0.62mi | 3/2.5 | 1,951 (+9%) | 15mo | $365,000 | $187 | 40 |
| 907 Huntclub Blvd | 0.62mi | 4/2.5 (+1) | 2,056 (+15%) | 4mo | $354,500 | $172 | 34 |
| 870 Huntclub Blvd | 0.66mi | 4/2.5 (+1) | 2,056 (+15%) | 6mo | $345,000 | $168 | 31 |
| 758 Huntclub Blvd | 0.73mi | 4/3.0 (+1) | 2,000 (+12%) | 6mo | $345,000 | $173 | 30 |
| 845 Canter Ln | 0.69mi | 4/2.5 (+1) | 2,056 (+15%) | 5mo | $320,000 | $156 | 30 |
Match score weights: distance 35% · size 25% · config 20% · recency 20%. Top-matched comps best support the ARV.
Projected returns pro-forma
-3.0% appreciation · 3.0% rent growth · sell at horizon
- IRR
- 2.1%
- Equity multiple
- 1.08×
- Total profit
- $6,424
- Equity at exit
- $41,734
- IRR
- 11.7%
- Equity multiple
- 1.92×
- Total profit
- $72,414
- Equity at exit
- $24,201
Cash invested: $78,372 (down + closing). Projections, not guarantees.
Landlord ↔ Tenant lean methodology
- Overall (STATE)
- 62 Landlord-Friendly
- State Michigan
- 62 Landlord-Friendly · EVEN
- County
- — inherits STATE
- City
- — inherits STATE
ZIP-level market 48304
- Active inventory
- 128
- Price-to-rent
- 6.7×
Monthly cashflow live
- Estimated rent
- $3,477 high interval (Pro) →
- Mortgage (P&I)
- −$1,468
- Tax est. 1.5%
- −$350 /mo · $4,198/yr
- Insurance
- −$117
- HOA
- −$0
- Vacancy / Maint / Mgmt
- −$730
- Net cashflow
- $812
Break-even live
UW: 25.0% down · 7.5% · 30yr · 1.5% tax · 5.0% vac · 8.0% maint · 8.0% mgmt
Financing live
Cash to close
- Down payment
- $69,975
- Closing costs
- $8,397
- Reserves months
- —
- Total cash needed
- —
Loan-product check · same deal, 3 products live
Conventional
25% down · 7.5% · 30yr
- Down + closing
- —
- Monthly P&I
- —
- Monthly cashflow
- —
- DSCR
- —
- Eligible?
- —
Personal DTI + credit; lowest rate.
DSCR
20% down · 8.5% · 30yr
- Down + closing
- —
- Monthly P&I
- —
- Monthly cashflow
- —
- DSCR
- —
- Eligible?
- —
No personal income docs; deal must DSCR.
Hard money
10% down · 12.0% · 12mo
- Down + closing
- —
- Monthly P&I
- —
- Monthly cashflow
- —
- DSCR
- —
- Eligible?
- —
Short-term bridge; refi at stabilization.
Rent comps 8 comps
| Address | Beds | Baths | Sqft | Rent | $/sqft | DOM | Units | Dist |
|---|---|---|---|---|---|---|---|---|
| 3200 South Blvd Bloomfield Hills, MI | 2.0–3.0 | 2.0 | 1782 | $4,250 | $2.38 | 1d | 1 | 0.41mi |
| 920 Heritage Dr Bloomfield Township, MI | 2.0 | 2.0 | 1804 | $3,600 | $2.00 | 1d | 1 | 0.45mi |
| 915 Huntclub Blvd Auburn Hills, MI | 4.0 | 2.5 | 2403 | $3,200 | $1.33 | 15d | 1 | 0.64mi |
| 676 Sheffield Rd Auburn Hills, MI | 3.0 | 1.5 | 1421 | $2,495 | $1.76 | 1d | 1 | 1.15mi |
| 124 Optimist Auburn Hills, MI | 2.0–3.0 | 2.0–2.5 | 1914 | $3,535 | $1.85 | 1d | 9 | 1.22mi |
| 124 Optimist Unit 1201 Rochester Hills, MI | 3.0 | 2.5 | 2504 | $3,535 | $1.41 | 1d | 1 | 1.22mi |
| 192 Raleigh Ave Auburn Hills, MI | 2.0 | 2.0 | 1700 | $2,400 | $1.41 | 43d | 1 | 1.26mi |
| 201 N Squirrel Rd Auburn Hills, MI | 2.0–3.0 | 2.5–3.0 | 1475 | $2,320 | $1.57 | 1d | 14 | 1.28mi |
Listing history 2 events
-
2026-06-17remarks 691-char remark
-
2026-06-17$279,900 Active 1 DOM
ⓘ Source: listings_history table (triggers on properties + properties_extension) + one-shot
backfill from property_details.listing_events for pre-trigger history.
Nearby sold comps map
Loading sold comps map…
Walkable amenities ~0.75 mi
Loading nearby amenities…
Taxation est. · year 1
- Rental income
- $41,719
- − Mortgage interest
- −$15,679
- − Property taxes
- −$4,198
- − Insurance
- −$1,400
- − Repairs & maintenance
- −$3,338
- − Management
- −$3,338
- − Depreciation
- −$8,143
- Taxable income
- $5,625
- Est. tax owed @ 24.0%
- −$1,350
- After-tax cash flow
- $8,396/yr
For passive investors: Depreciation is non-cash, so a rental often shows a tax loss while cash-flowing — sheltering income. Rental losses are passive: they offset passive income freely, and up to $25,000/yr can offset ordinary (W-2) income if you actively participate and your MAGI is under $100k (phasing out to $0 by $150k); unused losses carry forward. On sale, claimed depreciation is recaptured at up to 25%, and gains may owe capital-gains tax (a 1031 exchange can defer both). Figures are a year-1 estimate at your 24.0% rate — not tax advice; consult a CPA.
Schools (NCES district)
- District
- Avondale School District
- NCES district ID
- 2603690
- Math proficiency
- 34% ▼ -8.00%
- Reading proficiency
- 48% ▼ -4.00%
- Median HH income
- $71,549
- Composite
- 37.33/100
- National rank
- #4442
- State rank
- #162 of 540 in MI
Livability — Bloomfield
No livability data for this city. (Only ~50 U.S. cities are tracked.)
Census & demographics
- County
- Oakland County · 1,009,092 people
- Metro
- Detroit-Warren-Dearborn, MI
- Population (ZIP)
- 17,387
- Household income
- $143,204
- Rent vs Own
- Severe rent burden
- 85.0
Population outlook (Oakland County) Hauer SSP2
- Today (2025)
- 1,335,747 people
- By 2030
- 1,375,100 · +2.9%
- By 2040
- 1,435,385 · +7.5%
- By 2050
- 1,469,250 · +10.0%
- By 2075
- 1,531,946 · +14.7%
- By 2100
- 1,450,485 · +8.6%
Race, ethnicity, and origin ACS 2023
- Neighborhood character
- Predominantly White (79%)
- Race & ethnicity
- White 79% Asian 10% Two or more races 4% Black 4% Hispanic / Latino 2%
- Common ancestry
- Romanian 6% Lithuanian 3% Slovak 2%
- Foreign-born
- 17% · China, Canada, South Korea
- Languages at home
- 79% English-only · Other Indo-European 6% Arabic 5% Other Asian/Pacific 3%
Political lean MEDSL · Oakland
- 2024 margin
- D (+10.6) · D 54.4% · R 43.8% · Other 1.9%
- 2008→2024 swing
- -3.9pp toward R · 2008: 14.5pp · 2024: 10.6pp
- All cycles
- 2024: D+10.6 2020: D+14.1 2016: D+8.1 2012: D+8.1 2008: D+14.5
Not yet ingested
- Civics
- —
Market trends
- HPI YoY
- ▼ -195.96%
- Current HPI
- 160.6477
- Rent YoY
- —
- Metro
- Detroit-Warren-Dearborn, MI
- State GDP YoY
- ▲ 1.37%
- F500 in state
- 28
Industry mix (Fortune 500 HQ in MI)
| Industry | F500 HQs | Revenue |
|---|---|---|
| Automotive Parts | 3 | $48B |
|
||
| Automotive | 2 | $372B |
|
||
| Chemicals | 1 | $45B |
|
||
| Automotive Retail | 1 | $29B |
|
||
| Healthcare / Medical Devices | 1 | $23B |
|
||
| Automotive Technology | 1 | $20B |
|
||
Cash-flow waterfall
monthlySold comps — $/sqft
last 12 mo · ≤1 miLoading sold comps…