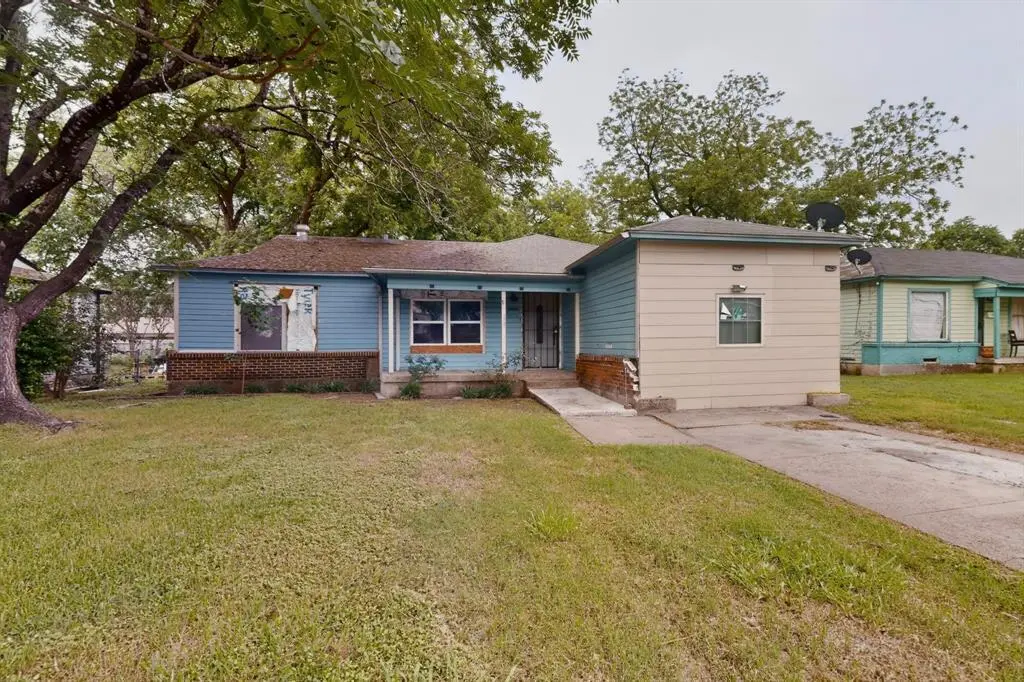
3102 Kilburn Ave · Dallas, TX
Flood risk 1/10 · Minimal
- FEMA flood zone
- X (unshaded)
- Chance of flooding over 30 yrs
- 0.0%
- Est. flood insurance / yr
- $507 – $1,088
Fire risk 3/10 · Minor
- Est. fire insurance / yr
- $1,222 – $2,270
Heat risk 7/10 · Major
- Hot days now (above 109°F)
- 7 days/yr
- Hot days in 30 yrs
- 24 days/yr
Wind risk 6/10 · Moderate
- Chance of severe wind over 30 yrs
- 27.0%
Air-quality risk 2/10 · Minimal
- Unhealthy air days now
- 1 days/yr
- Unhealthy air days in 30 yrs
- 2 days/yr
Risk factors via First Street. Map © Google.
Why this score? — see what drove the C- grade
The composite is a weighted blend of 9 inputs, each scored 0–100. Each bar is that input's sub-score; the figure is the points it added to the 100-point composite (weight × sub-score).
- Cash flow +15.3/30.0
- ARV discount +15.0/15.0
- 1% rule +5.5/10.0
- DSCR +4.7/10.0
- Livability +4.0/5.0
- Rent growth +3.6/5.0
- Schools +2.8/10.0
- Condition / age +2.5/5.0
- Appreciation +0.0/10.0
$130,000
🖨 Deal sheet (PDF) 📄 Offer letter ✓ Due diligence
Listing remarks
This 3 bedroom, 1 bath home has strong potential for investros or buyers looking for a project. This property is a true fixer upper and will require renovations, but has a great opportunity to customize or add value. Ideal for those looking to rehab and hold or flip. Being sold As-Is. Bring your best offer!
Key facts
- 7,275 sq ft lot
- Built 1951
- Listed 35 days
Property features AI
Finance
- Financial info: Listing terms: Cash or Conventional; Special taxing entities: No
- HOA & community: No homeowners association
Exterior
- Parking: Driveway
- Security: Smoke detector(s)
- Utilities: City water; City sewer; Electricity connected
- Home design: Single family residence; One story; Residential property
- Construction: Built in 1951; Siding exterior; Composition roof; Pillar/post/pier foundation
- Exterior features: Chain link fencing; Lot dimensions 61 x 120
Interior
- Kitchen: Built-in cabinets; Electric oven; Electric range
- Bedrooms: Primary bedroom on level 1 (13 x 10); Bedroom on level 1 (10 x 10); Bedroom on level 1 (11 x 23)
- Flooring: Luxury vinyl plank flooring
- Bathrooms: 1 full bathroom
- Heating & cooling: Central heating (electric); Central air conditioning (electric); Ceiling fan(s)
- Interior features: Decorative lighting; One living area; One dining area; 6 total rooms
Neighborhood map
What this means for you Summary
Snapshot
- This is a 2-bed/1.0-bath single-family listed at $130k.
Deal economics
- At list price, monthly cash flow is $47 ($561/yr) — positive.
- The deal already cash-flows at list — no discount required.
- Meets the 1% rule at list price ($1k rent vs $130k).
- Recommended offer: $126k (3.0% below list) — sets the bar for market timing.
- Cap rate 6.7% vs local median 2.3% in Dallas — top-decile yield for the area; either an underpriced asset or a hidden risk that comps aren't pricing in. Stress-test before assuming the spread holds.
Location & tenants
- Location reads 81/100 on livability (#24 in TX, #1,380 nationally) — a professional / high-income tenant draw. Strengths: amenities A+, commute A+, housing A+; Watch: schools C-, crime F.
- Dallas ISD (urban): math 31% / reading 36% proficiency, ranked #559 of 826 in TX (top 68%) — families likely to look elsewhere, expect single-tenant / working-renter base with shorter leases; 83% free/reduced lunch — lower-income household profile, screen leases tightly.
- Market conditions: Rents rising fast (+4.2%/yr); 253 active listings in the ZIP; 21 comparable units currently listed for rent nearby; rentals at typical pace (median 21d on market — plan ~3-4 weeks tenant-placement turnaround); lower-income renter base — watch delinquency; 12,577 units permitted in Dallas County in 2024 (6,829 in 5+ unit buildings).
- This rent runs 40% of the median local income ($41k/yr) — at the standard rent-burdened threshold; future hikes will face affordability resistance.
Forward outlook
- Local home prices are declining (-3.0%/yr); year-one equity from $899 of loan paydown is wiped out by about $4k of value loss. Plan a longer hold.
- Dallas County population projected at +35% by 2050 — long-run rental-demand tailwind backs the buy-and-hold thesis.
Negotiation context
- It's been on market 35 days — a 3% lower offer ($126k) is reasonable based on typical stale-listing flexibility.
Risks & watch-outs
- Watch-outs: property tax is 2.8% of price; built in 1951 — expect roof / HVAC / electrical / plumbing capex.
- Climate carrying-cost: major wind risk, 27% chance of damaging wind over 30y; extreme-heat days projected 7→24/yr by 2055 (HVAC capex compounding) — expect insurance premiums to compound above CPI over the hold.
Questions for the listing agent
- It's been on market 35 days. Have you received any prior offers? Is the seller open to a 3% concession, seller financing, or rate buy-down credit?
- Built in 1951 — when were the roof, HVAC, electrical panel, plumbing, and water heater last replaced?
- Property tax is high relative to price — has the assessment been appealed recently, and will the sale trigger a re-assessment?
- Is there a deadline driving the sale (1031 exchange, divorce, estate, relocation)? That informs how much negotiation room exists.
- Crime grade is F in this area — have there been break-ins, vandalism, or insurance claims at this property in the last 3 years? What carrier currently insures it and at what premium?
- What's the average days-on-market for RENTAL listings here right now (not sales)? A rising rental-DOM trend means longer vacancies and softer asking-rent achievability than the comps imply.
- What's the recent tenant-quality profile in this submarket — average credit score on applications, eviction rate, late-payment / NSF rate, and stable-employment percentage? A property-management company in the area should have these aggregated.
- How much new for-sale + rental construction is in the pipeline within 1–3 miles? Heavy new supply typically softens prices + rents 12–24 months out; constrained supply supports both.
Investment metrics
- 1% rule
- 1.05% ✓
- Cap rate
- 6.72%
- Cash-on-cash
- 1.54%
- DSCR
- 1.07
- GRM
- 7.9
CMA / ARV
- ARV (median comp)
- $187,042
- List price
- $130,000
- Delta
- -30.50%
- Verdict
- UNDERPRICED
- Comps
- 20 within 1.0 mi
Show comp detail 12 sales within ~0.75 mi
| Address | Dist | Beds/Ba | Sqft | Sold | Price | $/sf | Match |
|---|---|---|---|---|---|---|---|
| 4848 Haas Dr | 0.37mi | 2/1.0 | 901 (-0%) | 8mo | $135,000 | $150 | 75 |
| 2751 Moffatt Ave | 0.36mi | 3/1.5 (+1) | 980 (+8%) | 1mo | $124,995 | $128 | 61 |
| 2855 Marjorie Ave | 0.49mi | 2/1.0 | 864 (-4%) | 13mo | $119,500 | $138 | 59 |
| 3151 E Ledbetter Dr | 0.47mi | 3/1.0 (+1) | 960 (+6%) | 9mo | $215,000 | $224 | 56 |
| 4207 Bonnie View Rd | 0.40mi | 3/2.0 (+1) | 995 (+10%) | 1mo | $220,000 | $221 | 55 |
| 2765 Scotland Dr | 0.37mi | 2/2.0 | 768 (-15%) | 4mo | $169,998 | $221 | 50 |
| 4227 Bonnie View Rd | 0.35mi | 3/2.0 (+1) | 1,024 (+13%) | 14mo | $219,500 | $214 | 41 |
| 2646 Scotland Dr | 0.57mi | 2/1.0 | 768 (-15%) | 10mo | $114,000 | $148 | 41 |
| 2651 Fordham Rd | 0.75mi | 2/1.0 | 816 (-10%) | 13mo | $149,000 | $183 | 38 |
| 2705 Kilburn Ave | 0.60mi | 3/1.0 (+1) | 990 (+10%) | 18mo | $140,000 | $141 | 36 |
| 2635 Custer Dr | 0.65mi | 3/2.0 (+1) | 960 (+6%) | 18mo | $199,000 | $207 | 36 |
| 2731 Fordham Rd | 0.66mi | 3/2.0 (+1) | 1,022 (+13%) | 6mo | $199,000 | $195 | 33 |
Match score weights: distance 35% · size 25% · config 20% · recency 20%. Top-matched comps best support the ARV.
Projected returns pro-forma
-3.0% appreciation · 4.2% rent growth · sell at horizon
- IRR
- -12.2%
- Equity multiple
- 0.55×
- Total profit
- $-16,308
- Equity at exit
- $19,383
- IRR
- -1.1%
- Equity multiple
- 0.92×
- Total profit
- $-2,904
- Equity at exit
- $11,240
Cash invested: $36,400 (down + closing). Projections, not guarantees.
Landlord ↔ Tenant lean methodology
- Overall (STATE)
- 87 Strongly Landlord-Friendly
- State Texas
- 87 Strongly Landlord-Friendly · R+5
- County
- — inherits STATE
- City
- — inherits STATE
ZIP-level market 75216
- Home prices YoY
- -29.7%
- Rents YoY
- 4.2%
- Active inventory
- 253
- Price-to-rent
- 7.9×
Monthly cashflow live
- Estimated rent
- $1,369 high interval (Pro) →
- Mortgage (P&I)
- −$682
- Tax from tax record
- −$299 /mo · $3,589/yr
- Insurance
- −$54
- HOA
- −$0
- Vacancy / Maint / Mgmt
- −$288
- Net cashflow
- $47
Break-even live
Sensitivity live
| Price | -10% $120 | -5% $84 | +0% $47 | +5% $10 | +10% $-27 |
|---|---|---|---|---|---|
| Rent | -10% $-61 | -5% $-7 | +0% $47 | +5% $101 | +10% $155 |
| Rate | -1.0pp $112 | -0.5pp $80 | base $47 | +0.5pp $13 | +1.0pp $-21 |
UW: 25.0% down · 7.5% · 30yr · 1.5% tax · 5.0% vac · 8.0% maint · 8.0% mgmt
Financing live
Cash to close
- Down payment
- $32,500
- Closing costs
- $3,900
- Reserves months
- —
- Total cash needed
- —
Loan-product check · same deal, 3 products live
Conventional
25% down · 7.5% · 30yr
- Down + closing
- —
- Monthly P&I
- —
- Monthly cashflow
- —
- DSCR
- —
- Eligible?
- —
Personal DTI + credit; lowest rate.
DSCR
20% down · 8.5% · 30yr
- Down + closing
- —
- Monthly P&I
- —
- Monthly cashflow
- —
- DSCR
- —
- Eligible?
- —
No personal income docs; deal must DSCR.
Hard money
10% down · 12.0% · 12mo
- Down + closing
- —
- Monthly P&I
- —
- Monthly cashflow
- —
- DSCR
- —
- Eligible?
- —
Short-term bridge; refi at stabilization.
Rent comps 21 comps
| Address | Beds | Baths | Sqft | Rent | $/sqft | DOM | Units | Dist |
|---|---|---|---|---|---|---|---|---|
| 4836 Sunnyvale St Dallas, TX | 1.0–3.0 | 1.0–2.0 | 515 | $1,330 | $2.58 | 44d | 7 | 0.50mi |
| 3035 E Ledbetter Dr Dallas, TX | 1.0–2.0 | 1.0 | 643 | $1,275 | $1.98 | 4d | 1 | 0.51mi |
| 3015 E Ledbetter Dr Dallas, TX | 2.0–3.0 | 2.0 | 1030 | $1,100 | $1.07 | 4d | 1 | 0.54mi |
| 3460 South Loop 12 Dallas, TX | 1.0 | 1.0 | 650 | $999 | $1.54 | 19d | 1 | 0.73mi |
| 3460 South Loop 12 Dallas, TX | 2.0 | 1.5 | 867 | $1,150 | $1.33 | 7d | 1 | 0.73mi |
| 3460 South Loop 12 Dallas, TX | 1.0–2.0 | 1.0–1.5 | 758 | $1,150 | $1.52 | 13d | 2 | 0.73mi |
| 3460 South Loop 12 Dallas, TX | 3.0 | 2.0 | 1048 | $1,350 | $1.29 | 25d | 1 | 0.73mi |
| 2751 E Ledbetter Dr Dallas, TX | 1.0–3.0 | 1.0–1.5 | 794 | $1,186 | $1.49 | 44d | 3 | 0.79mi |
| 3130 Stag Rd Dallas, TX | 1.0–3.0 | 1.0–2.0 | 831 | $1,318 | $1.59 | 44d | 3 | 0.86mi |
| 2625 E Illinois Ave Dallas, TX | 2.0 | 1.0 | 750 | $1,050 | $1.40 | 5d | 1 | 1.14mi |
| 2625 E Illinois Ave Dallas, TX | 1.0 | 1.0 | 650 | $999 | $1.54 | 25d | 1 | 1.14mi |
| 2625 E Illinois Ave Dallas, TX | 2.0 | 1.0 | 750 | $1,050 | $1.40 | 20d | 1 | 1.14mi |
| 2625 E Illinois Ave Unit 118 Dallas, TX | 1.0 | 1.0 | 650 | $999 | $1.54 | 20d | 1 | 1.14mi |
| 2625 E Illinois Ave Dallas, TX | 1.0–2.0 | 1.0 | 700 | $1,050 | $1.50 | 13d | 18 | 1.14mi |
| 2625 E Illinois Ave Dallas, TX | 1.0 | 1.0 | 650 | $950 | $1.46 | 19d | 1 | 1.14mi |
| 2625 E Illinois Ave Unit 102 Dallas, TX | 2.0 | 1.0 | 750 | $1,050 | $1.40 | 25d | 1 | 1.16mi |
| 3320 Mundy Dr Dallas, TX | 3.0 | 2.0 | 1010 | $1,695 | $1.68 | 44d | 1 | 1.21mi |
| 2538 Stovall Dr Dallas, TX | 3.0 | 1.0 | 986 | $1,625 | $1.65 | 6d | 1 | 1.23mi |
| 2503 Stovall Dr Dallas, TX | 2.0 | 2.0 | 768 | $2,300 | $2.99 | 44d | 1 | 1.26mi |
| 2303 Deer Path Dr Dallas, TX | 2.0 | 1.0 | 790 | $1,650 | $2.09 | 8d | 1 | 1.31mi |
| 3206 Kellogg Ave Dallas, TX | 3.0 | 1.5 | 1076 | $1,800 | $1.67 | 44d | 1 | 1.34mi |
Listing history 12 events
-
2026-06-04status $130,000 Pending 35 DOM
-
2026-06-03days on market $130,000 Active Contingent 35 DOM
-
2026-06-02days on market $130,000 Active Contingent 34 DOM
-
2026-06-02status $130,000 Active Contingent 33 DOM
-
2026-06-01days on market $130,000 Active 33 DOM
-
2026-05-31days on market $130,000 Active 32 DOM
-
2026-05-12price $149,999 308-char remark
-
2026-04-29$165,000 Active 308-char remark
-
2026-03-03soldstatus
-
2017-07-10soldstatus
-
2016-12-13soldstatus
-
2008-05-16soldstatus
ⓘ Source: listings_history table (triggers on properties + properties_extension) + one-shot
backfill from property_details.listing_events for pre-trigger history.
Tax reassessment forecast TX · Resets to sale price
- Current annual tax
- $3,589 · $299/mo
- Projected year-2 tax
- $3,589 · $299/mo
- Expected delta
- $0/yr ($0/mo · 0.0%)
ⓘ Screening estimate from a state-policy table — verify with the county assessor before closing.
Climate risk First Street
- Flood 1/10 Low FEMA zone X (unshaded) · 0% chance over 30 yrs
- Wildfire 3/10 Moderate
- Heat 7/10 Severe 7 d/yr ≥109°F today · 24 d/yr by 30 yrs out
- Wind 6/10 Major 27% chance of damaging wind over 30 yrs
- Air quality 2/10 Low 1 unhealthy d/yr today · 2 by 30 yrs out
Nearby sold comps map
Loading sold comps map…
Walkable amenities ~0.75 mi
Loading nearby amenities…
Taxation est. · year 1
- Rental income
- $16,432
- − Mortgage interest
- −$7,282
- − Property taxes
- −$3,589
- − Insurance
- −$650
- − Repairs & maintenance
- −$1,315
- − Management
- −$1,315
- − Depreciation
- −$3,782
- Taxable loss
- −$1,500
- Est. tax savings @ 24.0%
- +$360
- After-tax cash flow
- $921/yr
For passive investors: Depreciation is non-cash, so a rental often shows a tax loss while cash-flowing — sheltering income. Rental losses are passive: they offset passive income freely, and up to $25,000/yr can offset ordinary (W-2) income if you actively participate and your MAGI is under $100k (phasing out to $0 by $150k); unused losses carry forward. On sale, claimed depreciation is recaptured at up to 25%, and gains may owe capital-gains tax (a 1031 exchange can defer both). Figures are a year-1 estimate at your 24.0% rate — not tax advice; consult a CPA.
Schools (NCES district)
- District
- Dallas ISD
- NCES district ID
- 4816230
- Math proficiency
- 31% ▼ -16.00%
- Reading proficiency
- 36% ▼ -4.00%
- Median HH income
- $42,881
- Composite
- 28.41/100
- National rank
- #6763
- State rank
- #559 of 826 in TX
Livability — Dallas
- Score
- 81/100
- State rank
- #24
- US rank
- #1380
Category grades
Schools grade is shown separately in the Schools card above.
Census & demographics
- Census place
- Dallas, TX
- County
- Dallas County · 2,612,404 people
- City population
- 1,168,437
- Metro
- Dallas-Fort Worth-Arlington, TX
- Population (ZIP)
- 55,894
- Household income
- $41,386
- Rent vs Own
- Severe rent burden
- 2465.0
Population outlook (Dallas County) Hauer SSP2
- Today (2025)
- 2,979,839 people
- By 2030
- 3,191,823 · +7.1%
- By 2040
- 3,619,611 · +21.5%
- By 2050
- 4,026,915 · +35.1%
- By 2075
- 4,957,073 · +66.4%
- By 2100
- 5,508,725 · +84.9%
Race, ethnicity, and origin ACS 2023
- Neighborhood character
- Majority Black (51%)
- Race & ethnicity
- Black 51% Hispanic / Latino 44% Two or more races 14% White 3%
- Hispanic origin (detail)
- Mexican 40%
- Common ancestry
- Hispanic 1%
- Foreign-born
- 17% · Canada
- Languages at home
- 62% English-only · Spanish 37%
Political lean MEDSL · Dallas
- 2024 margin
- Strong D (+22.2) · D 60.2% · R 38.0% · Other 1.8%
- 2008→2024 swing
- +6.9pp toward D · 2008: 15.3pp · 2024: 22.2pp
- All cycles
- 2024: D+22.2 2020: D+31.6 2016: D+26.2 2012: D+15.4 2008: D+15.3
Not yet ingested
- Civics
- —
Market trends
- HPI YoY
- ▼ -126.35%
- Current HPI
- 299.1825
- Rent YoY
- ▲ 4.20%
- Metro
- Dallas-Fort Worth-Arlington, TX
- State GDP YoY
- ▲ 3.95%
- F500 in state
- 110
Industry mix (Fortune 500 HQ in TX)
| Industry | F500 HQs | Revenue |
|---|---|---|
| Energy | 16 | $1,198B |
|
||
| Technology | 5 | $198B |
|
||
| Engineering / Construction | 4 | $72B |
|
||
| Energy Services | 3 | $60B |
|
||
| Utilities | 3 | $41B |
|
||
| Healthcare | 2 | $330B |
|
||
Price history
-21.2% since first listed10 events — show timeline
- 2026-06-05 Sold (MLS) — NTREIS
- 2026-06-03 Pending — NTREIS
- 2026-06-02 Contingent — NTREIS
- 2026-05-21 Price Changed $130,000 NTREIS
- 2026-05-12 Price Changed $149,999 NTREIS
- 2026-04-29 Listed $165,000 NTREIS
- 2026-03-03 Sold (Public Records) — Public Records
- 2017-07-10 Sold (Public Records) — Public Records
- 2016-12-13 Sold (Public Records) — Public Records
- 2008-05-16 Sold (Public Records) — Public Records
Property tax history
+7.1%/yrLatest (2025): $3,589 · -0.4% YoY. Source: county tax records.
Cash-flow waterfall
monthlySold comps — $/sqft
last 12 mo · ≤1 miLoading sold comps…