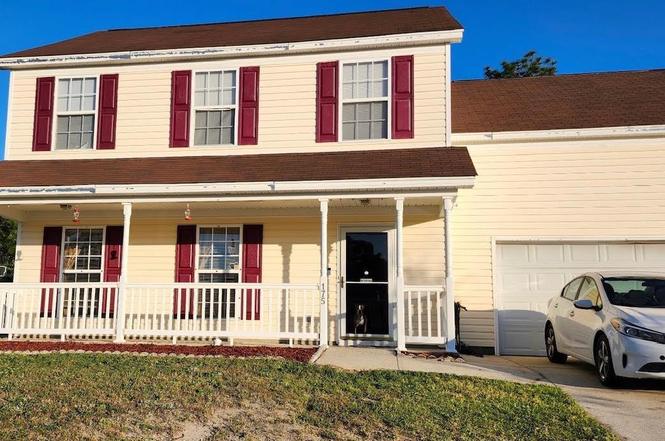
175 Savannah Hills Dr · White Knoll, SC
Flood risk 1/10 · Minimal
- FEMA flood zone
- X (unshaded)
- Chance of flooding over 30 yrs
- 0.0%
- Est. flood insurance / yr
- $507 – $1,088
Fire risk 5/10 · Moderate
- Est. fire insurance / yr
- $783 – $1,453
Heat risk 6/10 · Moderate
- Hot days now (above 107°F)
- 7 days/yr
- Hot days in 30 yrs
- 16 days/yr
Wind risk 6/10 · Moderate
- Chance of severe wind over 30 yrs
- 70.0%
Air-quality risk 3/10 · Minor
- Unhealthy air days now
- 2 days/yr
- Unhealthy air days in 30 yrs
- 2 days/yr
Risk factors via First Street. Map © Google.
Why this score? — see what drove the C+ grade
The composite is a weighted blend of 9 inputs, each scored 0–100. Each bar is that input's sub-score; the figure is the points it added to the 100-point composite (weight × sub-score).
- Cash flow +21.4/30.0
- ARV discount +15.0/15.0
- DSCR +6.8/10.0
- 1% rule +4.6/10.0
- Schools +4.2/10.0
- Rent growth +3.3/5.0
- Livability +2.5/5.0
- Condition / age +2.5/5.0
- Appreciation +0.0/10.0
$215,900
🖨 Deal sheet 📄 Offer letter ✓ Due diligence
Listing remarks
Price Improvement! Lots of space for a family who needs 4 true bedrooms, or someone who needs an office, playroom/study and extra bedroom. All bedrooms are upstairs for privacy, with a large master that has a private bath, double sinks, garden tub/shower combo and huge walk in closet. Extra large laundry room up so no dragging clothes up and down and an extra linen closet. Downstairs boasts a huge family room, kitchen with eat-in area, pantry, coat closet and half bath for guests. One of the larger backyards in Lexington Hills, which is partially fenced, so your property goes far behind the fence for a . 26 acre lot. Room for a storage shed or even a pool if approved. Previous survey attach
Key facts
- Double sinks
- Private bath
- Huge family room
Tags
Property features AI
Finance
- HOA & community: Community with association; Association fee covers common area maintenance
Exterior
- Parking: Attached 2-car garage (main level)
- Utilities: Public water; Public sewer
- Home design: Two-story home
- Construction: Slab foundation
- Exterior features: Covered front porch; Vinyl exterior finish; Partial privacy fence
Interior
- Kitchen: Eat-in kitchen; Pantry; Formica countertops; Stained wood cabinets; Vinyl flooring; Dishwasher; Disposal; Refrigerator; Free-standing range
- Bedrooms: Primary suite with bay window, garden tub, private bath, walk-in closet, tub/shower combination, ceiling fan, and carpeted floors (second level); Bedroom 2 with private closet and carpeted floors (second level); Bedroom 3 with private closet and carpeted floors (second level); Bedroom 4 with private closet and carpeted floors (second level)
- Flooring: Carpet in bedrooms; Laminate floors in living room; Vinyl flooring in kitchen
- Bathrooms: Two full bathrooms; One half bathroom; Two second-level full bathrooms
- Heating & cooling: Heat pump on first level; Heat pump on second level
- Interior features: Ceiling fan(s); Garage opener; Attic with pull-down access
- Laundry & utility: Utility/laundry room (washer/dryer located on second level)
Neighborhood map
What this means for you Summary
Snapshot
- This is a 3-bed/2.5-bath single-family listed at $216k.
Deal economics
- At list price, monthly cash flow is $322 ($4k/yr) — positive.
- The deal already cash-flows at list — no discount required.
- To meet the 1% rule (rent ≥ 1% of price), the offer needs to be $206k (4.4% below list).
- Recommended offer: $190k (12.0% below list) — sets the bar for market timing.
Location & tenants
- Location reads: area grade C — affects rentability + tenant quality, not the cash-flow math above.
- Lexington 01 (suburban): math 42% / reading 53% proficiency, ranked #11 of 80 in SC (top 14%) — families likely to look elsewhere, expect single-tenant / working-renter base with shorter leases.
- Zoned schools: Carolina Springs Elementary (math 34% / reading 34%, grade F, #359 of 597 statewide, top 60%, 850 students, 41% FRL); White Knoll High (math 47% / reading 85%, grade B, #81 of 196 statewide, top 42%, 2,204 students, 45% FRL).
- Market conditions: Rents rising (+3.2%/yr); 564 active listings in the ZIP; 6 comparable units currently listed for rent nearby; rentals leasing fast (median 3d on market — plan ~1-2 weeks tenant-placement turnaround); solid renter incomes; 1,712 units permitted in Lexington County in 2024 (0 in 5+ unit buildings).
- This rent runs 32% of the median local income ($77k/yr) — at the standard rent-burdened threshold; future hikes will face affordability resistance.
Forward outlook
- Local home prices are declining (-3.0%/yr); year-one equity from $1k of loan paydown is wiped out by about $6k of value loss. Plan a longer hold.
- Lexington County population projected at +26% by 2050 — long-run rental-demand tailwind backs the buy-and-hold thesis.
Negotiation context
- It's been on market 129 days — a 12% lower offer ($190k) is reasonable based on typical stale-listing flexibility.
- Current owner paid $115k; list at $216k implies a 88% gain — meaningful room to come down on a strong offer.
Risks & watch-outs
- Climate carrying-cost: major wind risk, 70% chance of damaging wind over 30y; moderate wildfire risk; extreme-heat days projected 7→16/yr by 2055 (HVAC capex compounding) — expect insurance premiums to compound above CPI over the hold.
Questions for the listing agent
- It's been on market 129 days. Have you received any prior offers? Is the seller open to a 12% concession, seller financing, or rate buy-down credit?
- What does the HOA fee cover, when was the last increase, and are there any pending special assessments or reserve-fund shortfalls?
- Why hasn't it sold? Are there any deal-killer items the seller is aware of (foundation, flood, title, zoning, code violations)?
- Is there a deadline driving the sale (1031 exchange, divorce, estate, relocation)? That informs how much negotiation room exists.
- What's the average days-on-market for RENTAL listings here right now (not sales)? A rising rental-DOM trend means longer vacancies and softer asking-rent achievability than the comps imply.
- What's the recent tenant-quality profile in this submarket — average credit score on applications, eviction rate, late-payment / NSF rate, and stable-employment percentage? A property-management company in the area should have these aggregated.
- How much new for-sale + rental construction is in the pipeline within 1–3 miles? Heavy new supply typically softens prices + rents 12–24 months out; constrained supply supports both.
Investment metrics
- 1% rule
- 0.96% ✗
- Cap rate
- 8.08%
- Cash-on-cash
- 6.39%
- DSCR
- 1.28
- GRM
- 8.7
CMA / ARV
- ARV (on-the-fly)
- $287,240
- Comps found
- 2
Show comp detail 2 sales within ~0.75 mi
| Address | Dist | Beds/Ba | Sqft | Sold | Price | $/sf | Match |
|---|---|---|---|---|---|---|---|
| 460 Walking Ln | 0.36mi | 3/2.5 | 1,527 (-9%) | 22mo | $262,000 | $172 | 51 |
| 116 Opago Way | 0.58mi | 4/2.5 (+1) | 1,604 (-4%) | 17mo | $230,000 | $143 | 47 |
Match score weights: distance 35% · size 25% · config 20% · recency 20%. Top-matched comps best support the ARV.
Projected returns pro-forma
-3.0% appreciation · 3.24% rent growth · sell at horizon
- IRR
- -6.3%
- Equity multiple
- 0.77×
- Total profit
- $-14,059
- Equity at exit
- $32,191
- IRR
- 3.6%
- Equity multiple
- 1.26×
- Total profit
- $15,894
- Equity at exit
- $18,667
Cash invested: $60,452 (down + closing). Projections, not guarantees.
Landlord ↔ Tenant lean methodology
- Overall (STATE)
- 90 Strongly Landlord-Friendly
- State South Carolina
- 90 Strongly Landlord-Friendly · R+6
- County
- — inherits STATE
- City
- — inherits STATE
ZIP-level market 29073
- Home prices YoY
- -19.1%
- Rents YoY
- 3.2%
- Active inventory
- 564
- Price-to-rent
- 8.7×
Monthly cashflow live
- Estimated rent
- $2,064 high interval (Pro) →
- Mortgage (P&I)
- −$1,132
- Tax from tax record
- −$70 /mo · $836/yr
- Insurance
- −$90
- HOA
- −$17
- Vacancy / Maint / Mgmt
- −$434
- Net cashflow
- $322
Break-even live
UW: 25.0% down · 7.5% · 30yr · 1.5% tax · 5.0% vac · 8.0% maint · 8.0% mgmt
Financing live
Cash to close
- Down payment
- $53,975
- Closing costs
- $6,477
- Reserves months
- —
- Total cash needed
- —
Loan-product check · same deal, 3 products live
Conventional
25% down · 7.5% · 30yr
- Down + closing
- —
- Monthly P&I
- —
- Monthly cashflow
- —
- DSCR
- —
- Eligible?
- —
Personal DTI + credit; lowest rate.
DSCR
20% down · 8.5% · 30yr
- Down + closing
- —
- Monthly P&I
- —
- Monthly cashflow
- —
- DSCR
- —
- Eligible?
- —
No personal income docs; deal must DSCR.
Hard money
10% down · 12.0% · 12mo
- Down + closing
- —
- Monthly P&I
- —
- Monthly cashflow
- —
- DSCR
- —
- Eligible?
- —
Short-term bridge; refi at stabilization.
Rent comps 6 comps
| Address | Beds | Baths | Sqft | Rent | $/sqft | DOM | Units | Dist |
|---|---|---|---|---|---|---|---|---|
| 2237 Trakand Dr Lexington, SC | 3.0 | 2.5 | 1962 | $1,975 | $1.01 | 2d | 1 | 0.17mi |
| 307 Savannah Hills Dr Lexington, SC | 3.0 | 2.5 | 1612 | $1,985 | $1.23 | 23d | 1 | 0.23mi |
| 473 Walking Ln Lexington, SC | 3.0 | 2.5 | 1835 | $2,100 | $1.14 | 23d | 1 | 0.37mi |
| 123 Brevard Pkwy Lexington, SC | 1.0–3.0 | 1.0–2.0 | 1097 | $1,275 | $1.16 | 2d | 1 | 0.72mi |
| 432 Cape Jasmine Way Lexington, SC | 4.0 | 2.5 | 1600 | $2,049 | $1.28 | 3d | 1 | 0.72mi |
| 600 Fern Hall Dr Lexington, SC | 2.0–3.0 | 2.0 | 1071 | $1,277 | $1.19 | 2d | 1 | 0.79mi |
HOA detail
- Monthly dues
- $17 · $204/yr
- Likely covers
- pool
Listing history 20 events
-
2026-06-18days on market $215,900 Active 129 DOM
-
2026-06-17days on market $215,900 Active 128 DOM
-
2026-06-16days on market $215,900 Active 127 DOM
-
2026-06-15price $215,900 Active 126 DOM
-
2026-06-15days on market $225,900 Active 126 DOM
-
2026-06-14days on market $225,900 Active 124 DOM
-
2026-06-10days on market $225,900 Active 121 DOM
-
2026-06-09days on market $225,900 Active 120 DOM
-
2026-06-08pricedays on market $225,900 Active 119 DOM
-
2026-06-07days on market $229,900 Active 118 DOM
-
2026-06-03days on market $229,900 Active 114 DOM
-
2026-06-03days on market $229,900 Active 113 DOM
-
2026-06-02days on market $229,900 Active 112 DOM
-
2026-05-31days on market $229,900 Active 111 DOM
-
2026-04-30price $229,900
-
2026-04-08price $235,000
-
2026-03-12price $237,500
-
2026-02-09$239,900 Active
-
2009-07-16soldstatus $115,000
-
2006-03-23soldstatus $141,744
ⓘ Source: listings_history table (triggers on properties + properties_extension) + one-shot
backfill from property_details.listing_events for pre-trigger history.
Tax reassessment forecast SC · Resets to sale price
- Current annual tax
- $836 · $70/mo
- Projected year-2 tax
- $1,231 · $103/mo
- Expected delta
- +$394/yr (+$33/mo · 47.1%)
ⓘ Screening estimate from a state-policy table — verify with the county assessor before closing.
Climate risk First Street
- Flood 1/10 Low FEMA zone X (unshaded) · 0% chance over 30 yrs
- Wildfire 5/10 Major
- Heat 6/10 Major 7 d/yr ≥107°F today · 16 d/yr by 30 yrs out
- Wind 6/10 Major 70% chance of damaging wind over 30 yrs
- Air quality 3/10 Moderate 2 unhealthy d/yr today · 2 by 30 yrs out
Nearby sold comps map
Loading sold comps map…
Walkable amenities ~0.75 mi
Loading nearby amenities…
Taxation est. · year 1
- Rental income
- $24,772
- − Mortgage interest
- −$12,094
- − Property taxes
- −$836
- − Insurance
- −$1,080
- − Repairs & maintenance
- −$1,982
- − Management
- −$1,982
- − HOA
- −$204
- − Depreciation
- −$6,281
- Taxable income
- $314
- Est. tax owed @ 24.0%
- −$75
- After-tax cash flow
- $3,788/yr
For passive investors: Depreciation is non-cash, so a rental often shows a tax loss while cash-flowing — sheltering income. Rental losses are passive: they offset passive income freely, and up to $25,000/yr can offset ordinary (W-2) income if you actively participate and your MAGI is under $100k (phasing out to $0 by $150k); unused losses carry forward. On sale, claimed depreciation is recaptured at up to 25%, and gains may owe capital-gains tax (a 1031 exchange can defer both). Figures are a year-1 estimate at your 24.0% rate — not tax advice; consult a CPA.
Schools (NCES district)
- District
- Lexington 01
- NCES district ID
- 4502700
- Math proficiency
- 42% ▼ -12.00%
- Reading proficiency
- 53% ▼ -2.00%
- Median HH income
- $61,298
- Composite
- 41.75/100
- National rank
- #3399
- State rank
- #11 of 80 in SC
Livability — White Knoll
No livability data for this city. (Only ~50 U.S. cities are tracked.)
Census & demographics
- Census place
- White Knoll, SC
- County
- Lexington County · 232,571 people
- City population
- 51,471
- Metro
- Columbia, SC
- Population (ZIP)
- 53,156
- Household income
- $77,229
- Rent vs Own
- Severe rent burden
- 935.0
Population outlook (Lexington County) Hauer SSP2
- Today (2025)
- 322,999 people
- By 2030
- 342,356 · +6.0%
- By 2040
- 377,715 · +16.9%
- By 2050
- 406,984 · +26.0%
- By 2075
- 465,447 · +44.1%
- By 2100
- 485,674 · +50.4%
Race, ethnicity, and origin ACS 2023
- Neighborhood character
- Predominantly White (72%)
- Race & ethnicity
- White 72% Black 14% Two or more races 7% Hispanic / Latino 6% Asian 2%
- Hispanic origin (detail)
- Mexican 2% Puerto Rican 1%
- Common ancestry
- Romanian 3% Italian 2% Slovak 1%
- Foreign-born
- 4% · Canada, China
- Languages at home
- 93% English-only · Spanish 5% Other Indo-European 1%
Political lean MEDSL · Lexington
- 2024 margin
- Solid R (+33.5) · D 32.5% · R 66.0% · Other 1.4%
- 2008→2024 swing
- +4.6pp toward D · 2008: -38.0pp · 2024: -33.5pp
- All cycles
- 2024: R+33.5 2020: R+30.1 2016: R+36.7 2012: R+37.8 2008: R+38.0
Not yet ingested
- Civics
- —
Market trends
- HPI YoY
- ▼ -59.20%
- Current HPI
- 249.8957
- Rent YoY
- ▲ 3.24%
- Metro
- Columbia, SC
- State GDP YoY
- ▲ 4.51%
- F500 in state
- 2
Industry mix (Fortune 500 HQ in SC)
| Industry | F500 HQs | Revenue |
|---|---|---|
| Packaging | 1 | $7B |
|
||
Price history
+62.2% since first listed6 events — show timeline
- 2026-04-30 Price Changed $229,900 Consolidated MLS
- 2026-04-08 Price Changed $235,000 Consolidated MLS
- 2026-03-12 Price Changed $237,500 Consolidated MLS
- 2026-02-09 Listed $239,900 Consolidated MLS
- 2009-07-16 Sold (Public Records) $115,000 Public Records
- 2006-03-23 Sold (Public Records) $141,744 Public Records
Property tax history
-9.0%/yrLatest (2024): $836 · +4.4% YoY. Source: county tax records.
Cash-flow waterfall
monthlySold comps — $/sqft
last 12 mo · ≤1 miLoading sold comps…