215 Center St #1205 · San Antonio, TX
Flood risk 1/10 · Minimal
- FEMA flood zone
- X (unshaded)
- Chance of flooding over 30 yrs
- 0.0%
- Est. flood insurance / yr
- $507 – $1,088
Fire risk 1/10 · Minimal
- Est. fire insurance / yr
- $1,222 – $2,270
Heat risk 8/10 · Major
- Hot days now (above 108°F)
- 7 days/yr
- Hot days in 30 yrs
- 22 days/yr
Wind risk 8/10 · Major
- Chance of severe wind over 30 yrs
- 80.0%
Air-quality risk 2/10 · Minimal
- Unhealthy air days now
- 1 days/yr
- Unhealthy air days in 30 yrs
- 2 days/yr
Risk factors via First Street. Map © Google.
Why this score? — see what drove the D- grade
The composite is a weighted blend of 9 inputs, each scored 0–100. Each bar is that input's sub-score; the figure is the points it added to the 100-point composite (weight × sub-score).
- ARV discount +15.0/15.0
- Appreciation +10.0/10.0
- Rent growth +4.5/5.0
- Livability +4.0/5.0
- Condition / age +2.5/5.0
- 1% rule +1.5/10.0
- Schools +1.4/10.0
- Cash flow +0.0/30.0
- DSCR +0.0/10.0
$255,000
🖨 Deal sheet 📄 Offer letter ✓ Due diligence
Listing remarks
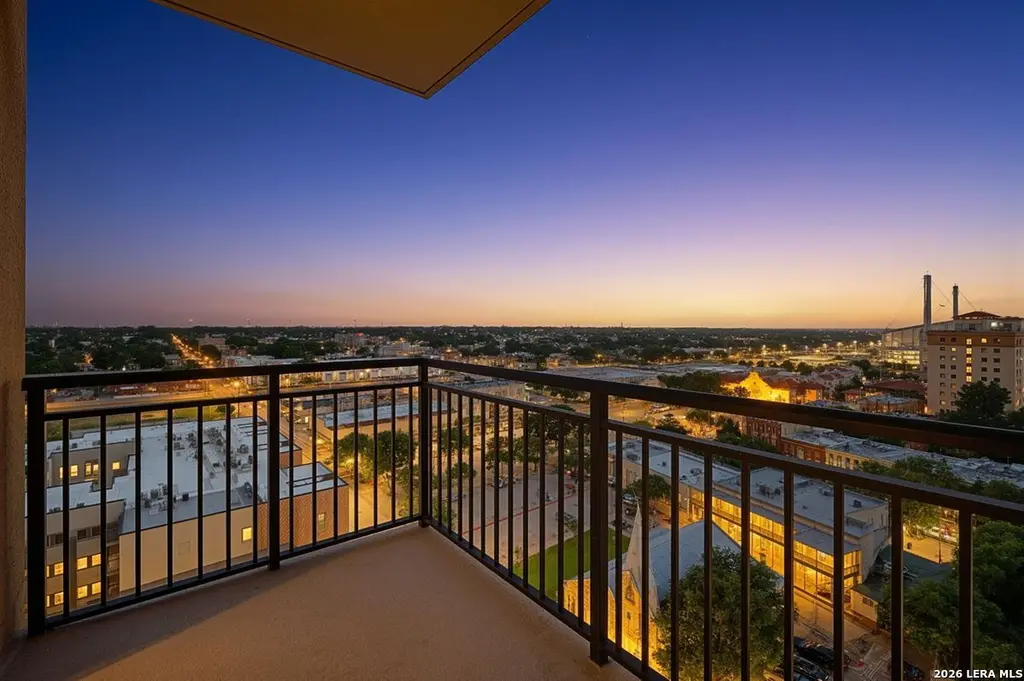
Elevated above the city on the 12th floor of Vidorra, this refined one-bedroom residence captures the essence of luxury downtown living. Expansive views create a striking backdrop for a lifestyle defined by sophistication, convenience, and energy. Inside, the home offers a seamless blend of modern design and effortless comfort, an ideal urban retreat just moments from the city's most vibrant destinations. Step outside and you're immediately connected to acclaimed dining and live music, placing the very best of downtown at your doorstep. Vidorra's full-service amenities include 24-hour concierge service, a pool with outdoor grilling areas, and a state-of-the-art fitness center. The exclusive
Key facts
- Expansive views
- Guest suites
- 20th-floor skyroom
Tags
Property features AI
Finance
- Other: Part of a 146-unit building; Unit entry level indicated as 12; Square footage source: Appraisal District
- HOA & community: Mandatory HOA; Monthly HOA fee; HOA covers some utilities, condo management, common area liability, common maintenance, trash removal, and pest control; Association transfer fee applies; Community amenities include elevator, party room, pool, exercise room, BBQ/picnic area, and professional management
Exterior
- Parking: 1-car garage
- Security: Controlled access; Guarded access
- Utilities: Electric service: CPS; Water: provided by HOA; Sewer: provided by HOA; Garbage service: provided by HOA
- Home design: Condominium (pre-owned); Single-level unit; Controlled access and guarded access
- Construction: Brick and stucco exterior; Approximately 19 years old
- Exterior features: Deck/Balcony; Near shopping
Interior
- Kitchen: Island kitchen; Microwave; Stove/Range; Refrigerator; Dishwasher; Disposal; Solid countertops
- Bedrooms: Master bedroom with walk-in closet, ceiling fan and full bath (13 x 15)
- Flooring: Ceramic tile; Wood flooring
- Bathrooms: 1 full bathroom
- Heating & cooling: Central heating (electric); Central air conditioning
- Interior features: Ceiling fans; Washer and dryer connections; Microwave; Stove/Range; Refrigerator; Disposal; Dishwasher; Electric water heater; Solid countertops; Private garbage service; Living/Dining room combination; Island kitchen; High ceilings; Open floor plan; Cable TV available; Laundry on main level; Walk-in closets; Some window coverings remain; 1 living area
- Laundry & utility: Washer connection; Dryer connection; Laundry on main level; Electric water heater
Neighborhood map
What this means for you Summary
Snapshot
- This is a 1-bed/1.0-bath condo listed at $255k.
Deal economics
- At list price, monthly cash flow is $-1k ($-16k/yr) — negative.
- To cash-flow at today's rent, offer at most $94k (63.2% below list).
- To meet the 1% rule (rent ≥ 1% of price), the offer needs to be $165k (35.4% below list).
- Recommended offer: $94k (63.2% below list) — sets the bar for cash-flow.
- Cap rate -0.1% vs local median 3.8% in San Antonio — below-typical yield; the buyer is paying a premium for something (appreciation thesis, condition, location) that the cap rate doesn't capture.
Location & tenants
- Location reads 80/100 on livability (#31 in TX, #1,616 nationally) — a professional / high-income tenant draw. Strengths: amenities A+, commute A+, cost of living A+; Watch: schools C-, crime F.
- San Antonio ISD (urban): math 12% / reading 22% proficiency, ranked #805 of 826 in TX (top 98%) — low school quality limits family demand, transient renter base, plan for 1-2y turnover; 80% free/reduced lunch — lower-income household profile, screen leases tightly.
- Market conditions: Rents rising fast (+8.2%/yr); 196 active listings in the ZIP; 40 comparable units currently listed for rent nearby; rentals at typical pace (median 24d on market — plan ~3-4 weeks tenant-placement turnaround); 45% of comp listings sitting > 30 days — soft ceiling on asking rent; 8,308 units permitted in Bexar County in 2024 (2,506 in 5+ unit buildings).
- This rent runs 42% of the median local income ($47k/yr) — at the standard rent-burdened threshold; future hikes will face affordability resistance.
Forward outlook
- In year one you build about $27k of equity ($2k loan paydown + $26k appreciation (10.0% local appreciation)).
- Bexar County population projected at +50% by 2050 — long-run rental-demand tailwind backs the buy-and-hold thesis.
- By year 2, paydown + projected appreciation supports a ~$44k cash-out refi (75% LTV) — recoverable capital for the next deal without selling this one.
Negotiation context
- It's been on market 36 days — a 3% lower offer ($247k) is reasonable based on typical stale-listing flexibility.
- 6 sale attempts since 17y ago with the ask held roughly flat each time — persistent listings suggest the price (not the market) is what's stuck; bring a comps-based counter.
Risks & watch-outs
- Watch-outs: property tax is 2.7% of price; HOA is 40% of rent.
- Climate carrying-cost: severe wind risk, 80% chance of damaging wind over 30y; extreme-heat days projected 7→22/yr by 2055 (HVAC capex compounding) — expect insurance premiums to compound above CPI over the hold.
Questions for the listing agent
- What do current leases actually rent for vs. the listed asking? Can we see a recent rent roll and the last 12 months of T-12 income?
- It's been on market 36 days. Have you received any prior offers? Is the seller open to a 63% concession, seller financing, or rate buy-down credit?
- Property tax is high relative to price — has the assessment been appealed recently, and will the sale trigger a re-assessment?
- What does the HOA fee cover, when was the last increase, and are there any pending special assessments or reserve-fund shortfalls?
- Any open or pending special assessments — roof, HVAC, plumbing, elevator, façade? What's the per-unit balance and payoff schedule, and is the seller paying it off at close or rolling it to the buyer?
- Is there a deadline driving the sale (1031 exchange, divorce, estate, relocation)? That informs how much negotiation room exists.
- Crime grade is F in this area — have there been break-ins, vandalism, or insurance claims at this property in the last 3 years? What carrier currently insures it and at what premium?
- The area grade is low — what's the realistic commute time and amenity access for the typical tenant pool here? Any planned neighborhood developments (good or bad) we should know about?
- What's the average days-on-market for RENTAL listings here right now (not sales)? A rising rental-DOM trend means longer vacancies and softer asking-rent achievability than the comps imply.
- What's the recent tenant-quality profile in this submarket — average credit score on applications, eviction rate, late-payment / NSF rate, and stable-employment percentage? A property-management company in the area should have these aggregated.
- How much new apartment / multifamily construction is in the pipeline within 1–3 miles? Heavy new supply (>2% of stock underway) typically softens rents 12–24 months out; light construction supports rent growth.
Investment metrics
- 1% rule
- 0.65% ✗
- Cap rate
- -0.12%
- Cash-on-cash
- -22.91%
- DSCR
- -0.02
- GRM
- 12.9
CMA / ARV
- ARV (median comp)
- $354,370
- List price
- $255,000
- Delta
- -28.04%
- Verdict
- UNDERPRICED
- Comps
- 20 within 1.0 mi
Projected returns pro-forma
10.0% appreciation · 8.0% rent growth · sell at horizon
- IRR
- 10.1%
- Equity multiple
- 1.86×
- Total profit
- $61,339
- Equity at exit
- $229,724
- IRR
- 12.5%
- Equity multiple
- 4.80×
- Total profit
- $271,629
- Equity at exit
- $495,409
Cash invested: $71,400 (down + closing). Projections, not guarantees.
Landlord ↔ Tenant lean methodology
- Overall (STATE)
- 87 Strongly Landlord-Friendly
- State Texas
- 87 Strongly Landlord-Friendly · R+5
- County
- — inherits STATE
- City
- — inherits STATE
ZIP-level market 78202
- Home prices YoY
- 27.0%
- Rents YoY
- 8.2%
- Active inventory
- 196
- Price-to-rent
- 12.9×
Monthly cashflow live
- Estimated rent
- $1,647 high interval (Pro) →
- Mortgage (P&I)
- −$1,337
- Tax from tax record
- −$568 /mo · $6,815/yr
- Insurance
- −$106
- HOA
- −$653
- Vacancy / Maint / Mgmt
- −$346
- Net cashflow
- $-1,363
Break-even live
UW: 25.0% down · 7.5% · 30yr · 1.5% tax · 5.0% vac · 8.0% maint · 8.0% mgmt
Financing live
Cash to close
- Down payment
- $63,750
- Closing costs
- $7,650
- Reserves months
- —
- Total cash needed
- —
Loan-product check · same deal, 3 products live
Conventional
25% down · 7.5% · 30yr
- Down + closing
- —
- Monthly P&I
- —
- Monthly cashflow
- —
- DSCR
- —
- Eligible?
- —
Personal DTI + credit; lowest rate.
DSCR
20% down · 8.5% · 30yr
- Down + closing
- —
- Monthly P&I
- —
- Monthly cashflow
- —
- DSCR
- —
- Eligible?
- —
No personal income docs; deal must DSCR.
Hard money
10% down · 12.0% · 12mo
- Down + closing
- —
- Monthly P&I
- —
- Monthly cashflow
- —
- DSCR
- —
- Eligible?
- —
Short-term bridge; refi at stabilization.
Rent comps 40 comps
| Address | Beds | Baths | Sqft | Rent | $/sqft | DOM | Units | Dist |
|---|---|---|---|---|---|---|---|---|
| 215 Center St #505 San Antonio, TX | 1.0 | 1.0 | 1066 | $1,595 | $1.50 | 43d | 1 | 0.02mi |
| 215 Center St #307 San Antonio, TX | 2.0 | 2.0 | 1424 | $2,350 | $1.65 | 24d | 1 | 0.02mi |
| 215 Center St #307 San Antonio, TX | 2.0 | 2.0 | 1424 | $2,350 | $1.65 | 20d | 1 | 0.02mi |
| 215 Center St San Antonio, TX | 1.0 | 1.5 | 1000 | $1,398 | $1.40 | 4d | 1 | 0.03mi |
| 239 Center St San Antonio, TX | 2.0 | 1.0–2.0 | 842 | $1,422 | $1.69 | 2d | 18 | 0.04mi |
| 118 Glorietta San Antonio, TX | 1.0 | 1.0 | 913 | $1,600 | $1.75 | 4d | 1 | 0.32mi |
| 610 E Market St #2915 San Antonio, TX | 2.0 | 2.0 | 1497 | $3,800 | $2.54 | 22d | 1 | 0.32mi |
| 325 Montana St San Antonio, TX | 2.0 | 2.0 | 840 | $2,475 | $2.95 | 43d | 1 | 0.38mi |
| 120 Omaha St Apt 1 San Antonio, TX | 1.0 | 1.0 | 1204 | $900 | $0.75 | 24d | 1 | 0.41mi |
| 704 N Cherry St Unit 704 San Antonio, TX | 2.0 | 2.5 | 1200 | $1,800 | $1.50 | 43d | 1 | 0.47mi |
| 1617 E Commerce St San Antonio, TX | 1.0 | 1.0 | 844 | $814 | $0.96 | 43d | 1 | 0.51mi |
| 110 Labor St Unit 9004 San Antonio, TX | 2.0 | 2.0 | 1054 | $1,750 | $1.66 | 43d | 1 | 0.58mi |
| 110 Labor St Unit 710 San Antonio, TX | 2.0 | 2.0 | 994 | $1,681 | $1.69 | 3d | 1 | 0.58mi |
| 630 Montana St Unit 301 San Antonio, TX | 2.0 | 2.0 | 1320 | $2,250 | $1.70 | 14d | 1 | 0.61mi |
| 630 Montana St Unit 201 San Antonio, TX | 1.0 | 1.5 | 1060 | $1,950 | $1.84 | 43d | 1 | 0.61mi |
| 630 Montana St Unit 202 San Antonio, TX | 1.0 | 1.0 | 969 | $1,950 | $2.01 | 24d | 1 | 0.61mi |
| 401 Santos St San Antonio, TX | 1.0–2.0 | 1.0–2.0 | 927 | $1,099 | $1.18 | 4d | 12 | 0.62mi |
| 601 S Alamo St Unit 203 San Antonio, TX | 1.0 | 1.0 | 708 | $1,140 | $1.61 | 12d | 1 | 0.65mi |
| 9 Santos St San Antonio, TX | 1.0 | 1.0 | 774 | $925 | $1.20 | 43d | 1 | 0.65mi |
| 1205 Wyoming St San Antonio, TX | 2.0 | 2.0 | 1114 | $2,300 | $2.06 | 43d | 1 | 0.67mi |
| 511 N Monumental San Antonio, TX | 2.0 | 2.0 | 1206 | $1,595 | $1.32 | 4d | 1 | 0.67mi |
| 300 Labor St San Antonio, TX | 1.0–2.0 | 1.0–2.0 | 829 | $867 | $1.05 | 2d | 15 | 0.68mi |
| 811 Montana St Unit 1301 San Antonio, TX | 2.0 | 2.0 | 1240 | $1,800 | $1.45 | 43d | 1 | 0.70mi |
| 323 Barrera St San Antonio, TX | 2.0 | 1.0 | 1078 | $1,497 | $1.39 | 4d | 1 | 0.70mi |
| 1218 Wyoming St Unit 1 San Antonio, TX | 1.0 | 1.0 | 744 | $1,299 | $1.75 | 43d | 1 | 0.72mi |
| 222 E Houston St San Antonio, TX | 1.0–2.0 | 1.0–2.0 | 1187 | $1,600 | $1.35 | 20d | 1 | 0.74mi |
| 231 Cactus St San Antonio, TX | 2.0 | 1.0 | 876 | $1,195 | $1.36 | 24d | 1 | 0.76mi |
| 202 E Houston St San Antonio, TX | 2.0 | 1.0–2.0 | 725 | $1,275 | $1.76 | 43d | 1 | 0.77mi |
| 1021 N Alamo St San Antonio, TX | 2.0 | 1.0 | 1202 | $2,000 | $1.66 | 43d | 1 | 0.79mi |
| 143 E Commerce St San Antonio, TX | 1.0–3.0 | 1.0–3.5 | 1442 | $2,895 | $2.01 | 1d | 15 | 0.80mi |
| 210 Piedmont Ave Unit 101 San Antonio, TX | 2.0 | 2.5 | 1050 | $1,395 | $1.33 | 43d | 1 | 0.81mi |
| 1419 Wyoming St San Antonio, TX | 2.0 | 1.0 | 1232 | $1,550 | $1.26 | 4d | 1 | 0.81mi |
| 891 Avenue B San Antonio, TX | 2.0 | 2.0 | 1053 | $1,777 | $1.69 | 43d | 1 | 0.82mi |
| 111 Leigh St Unit 2 San Antonio, TX | 2.0 | 1.0 | 1137 | $1,200 | $1.06 | 43d | 1 | 0.83mi |
| 732 Lamar St Unit 1 San Antonio, TX | 1.0 | 1.0 | 1100 | $1,550 | $1.41 | 43d | 1 | 0.83mi |
| 610 W Market St Unit 2915 San Antonio, TX | 2.0 | 2.0 | 1497 | $3,800 | $2.54 | 24d | 1 | 0.84mi |
| 1123 N Olive St San Antonio, TX | 2.0 | 1.0 | 840 | $1,600 | $1.90 | 24d | 1 | 0.84mi |
| 123 Lexington Ave San Antonio, TX | 1.0 | 2.0 | 904 | $3,000 | $3.32 | 43d | 1 | 0.86mi |
| 120 9th St San Antonio, TX | 1.0–2.0 | 1.0–2.0 | 923 | $1,428 | $1.55 | 1d | 20 | 0.87mi |
| 214 Dwyer Ave San Antonio, TX | 2.0 | 2.0 | 1062 | $1,570 | $1.48 | 43d | 1 | 0.87mi |
HOA detail condo
- Monthly dues
- $653 · $7,836/yr
- Likely covers
- poolgymdoorman
- Assessments
- None detected in remarks — confirm with the listing agent.
Listing history 26 events
-
2026-06-18days on market $255,000 Active 36 DOM
-
2026-06-17days on market $255,000 Active 35 DOM
-
2026-06-16days on market $255,000 Active 34 DOM
-
2026-06-15days on market $255,000 Active 33 DOM
-
2026-06-13days on market $255,000 Active 31 DOM
-
2026-06-09days on market $255,000 Active 27 DOM
-
2026-06-08days on market $255,000 Active 26 DOM
-
2026-06-07days on market $255,000 Active 25 DOM
-
2026-06-04days on market $255,000 Active 22 DOM
-
2026-06-03days on market $255,000 Active 21 DOM
-
2026-06-02days on market $255,000 Active 20 DOM
-
2026-06-01days on market $255,000 Active 19 DOM
-
2026-05-31days on market $255,000 Active 18 DOM
-
2026-05-13$255,000 New 1221-char remark
-
2026-04-26historical
-
2026-03-19price $255,000
-
2026-02-13price $285,000
-
2026-01-08status Back on Market
-
2025-12-08historical
-
2025-10-04$295,000 New
-
2025-09-25historical $1,900
-
2025-07-17$1,900
-
2019-04-20historical
-
2019-03-31$259,900 New
-
2009-12-31historical
-
2009-09-14$264,900
ⓘ Source: listings_history table (triggers on properties + properties_extension) + one-shot
backfill from property_details.listing_events for pre-trigger history.
Tax reassessment forecast TX · Resets to sale price
- Current annual tax
- $6,815 · $568/mo
- Projected year-2 tax
- $6,815 · $568/mo
- Expected delta
- $0/yr ($0/mo · 0.0%)
ⓘ Screening estimate from a state-policy table — verify with the county assessor before closing.
Climate risk First Street
- Flood 1/10 Low FEMA zone X (unshaded) · 0% chance over 30 yrs
- Wildfire 1/10 Low
- Heat 8/10 Severe 7 d/yr ≥108°F today · 22 d/yr by 30 yrs out
- Wind 8/10 Severe 80% chance of damaging wind over 30 yrs
- Air quality 2/10 Low 1 unhealthy d/yr today · 2 by 30 yrs out
Nearby sold comps map
Loading sold comps map…
Walkable amenities ~0.75 mi
Loading nearby amenities…
Taxation est. · year 1
- Rental income
- $19,765
- − Mortgage interest
- −$14,284
- − Property taxes
- −$6,815
- − Insurance
- −$1,275
- − Repairs & maintenance
- −$1,581
- − Management
- −$1,581
- − HOA
- −$7,836
- − Depreciation
- −$7,418
- Taxable loss
- −$21,026
- Est. tax savings @ 24.0%
- +$5,046
- After-tax cash flow
- $-11,313/yr
For passive investors: Depreciation is non-cash, so a rental often shows a tax loss while cash-flowing — sheltering income. Rental losses are passive: they offset passive income freely, and up to $25,000/yr can offset ordinary (W-2) income if you actively participate and your MAGI is under $100k (phasing out to $0 by $150k); unused losses carry forward. On sale, claimed depreciation is recaptured at up to 25%, and gains may owe capital-gains tax (a 1031 exchange can defer both). Figures are a year-1 estimate at your 24.0% rate — not tax advice; consult a CPA.
Schools (NCES district)
- District
- San Antonio ISD
- NCES district ID
- 4838730
- Math proficiency
- 12% ▼ -21.00%
- Reading proficiency
- 22% ▼ -7.00%
- Median HH income
- $30,952
- Composite
- 13.57/100
- National rank
- #9512
- State rank
- #805 of 826 in TX
Livability — San Antonio
- Score
- 80/100
- State rank
- #31
- US rank
- #1616
Category grades
Schools grade is shown separately in the Schools card above.
Census & demographics
- Census place
- San Antonio, TX
- County
- Bexar County · 1,990,555 people
- City population
- 1,806,925
- Metro
- San Antonio-New Braunfels, TX
- Population (ZIP)
- 10,224
- Household income
- $47,478
- Rent vs Own
- Severe rent burden
- 543.0
Population outlook (Bexar County) Hauer SSP2
- Today (2025)
- 2,336,851 people
- By 2030
- 2,560,728 · +9.6%
- By 2040
- 3,020,569 · +29.3%
- By 2050
- 3,493,522 · +49.5%
- By 2075
- 4,668,459 · +99.8%
- By 2100
- 5,533,242 · +136.8%
Race, ethnicity, and origin ACS 2023
- Neighborhood character
- Predominantly Hispanic (66%)
- Race & ethnicity
- Hispanic / Latino 66% Two or more races 28% White 17% Black 16% Native American 1%
- Hispanic origin (detail)
- Mexican 57% Puerto Rican 1% Cuban 1%
- Common ancestry
- Italian 2% Slovak 1%
- Foreign-born
- 14% · Canada
- Languages at home
- 59% English-only · Spanish 41%
Political lean MEDSL · Bexar
- 2024 margin
- Lean D (+9.8) · D 54.3% · R 44.6% · Other 1.1%
- 2008→2024 swing
- +4.2pp toward D · 2008: 5.6pp · 2024: 9.8pp
- All cycles
- 2024: D+9.8 2020: D+18.2 2016: D+13.5 2012: D+4.6 2008: D+5.6
Not yet ingested
- Civics
- —
Market trends
- HPI YoY
- ▲ 53.82%
- Current HPI
- 253.3196
- Rent YoY
- ▲ 8.20%
- Metro
- San Antonio-New Braunfels, TX
- State GDP YoY
- ▲ 3.95%
- F500 in state
- 110
Industry mix (Fortune 500 HQ in TX)
| Industry | F500 HQs | Revenue |
|---|---|---|
| Energy | 16 | $1,198B |
|
||
| Technology | 5 | $198B |
|
||
| Engineering / Construction | 4 | $72B |
|
||
| Energy Services | 3 | $60B |
|
||
| Utilities | 3 | $41B |
|
||
| Healthcare | 2 | $330B |
|
||
Price history
-3.7% since first listed13 events — show timeline
- 2026-05-13 Listed $255,000 LERA
- 2026-04-26 Listing Removed — LERA
- 2026-03-19 Price Changed $255,000 LERA
- 2026-02-13 Price Changed $285,000 LERA
- 2026-01-08 Relisted — LERA
- 2025-12-08 Listing Removed — LERA
- 2025-10-04 Listed $295,000 LERA
- 2025-09-25 Rental Removed $1,900 SABOR
- 2025-07-17 Listed for Rent $1,900 SABOR
- 2019-04-20 Listing Removed — LERA
- 2019-03-31 Listed $259,900 LERA
- 2009-12-31 Listing Removed — LERA
- 2009-09-14 Listed $264,900 LERA
Property tax history
+2.2%/yrLatest (2025): $6,815 · -4.9% YoY. Source: county tax records.
Cash-flow waterfall
monthlySold comps — $/sqft
last 12 mo · ≤1 miLoading sold comps…