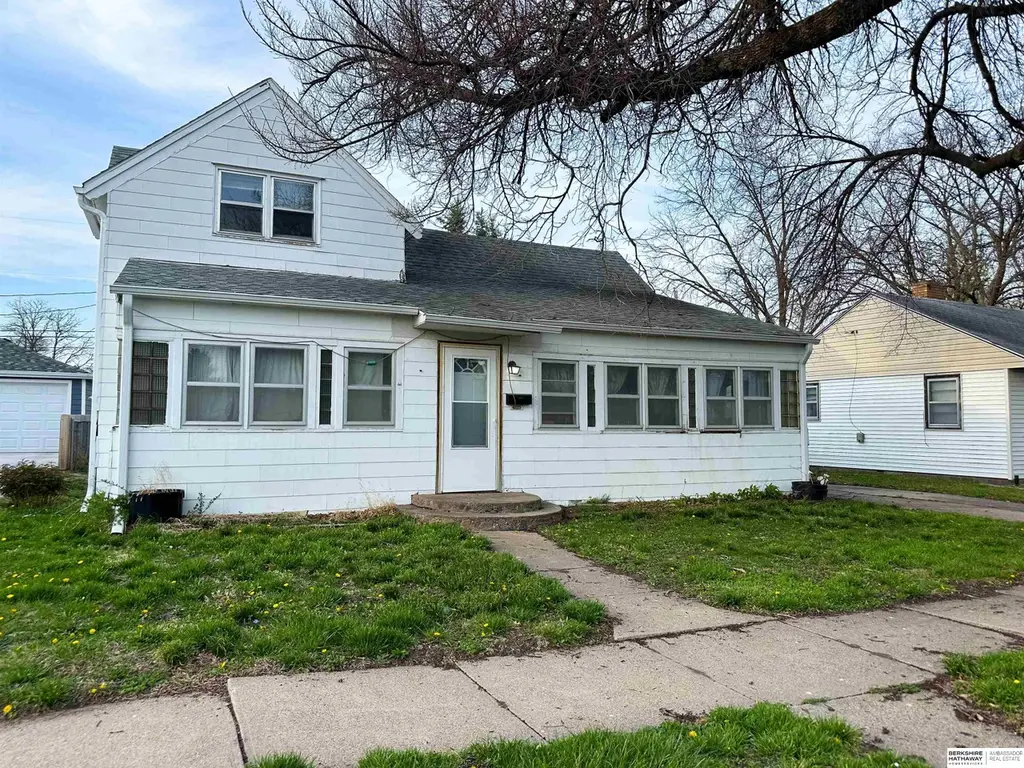
1342 E 5th St · Fremont, NE
Flood risk 1/10 · Minimal
- FEMA flood zone
- X (shaded)
- Chance of flooding over 30 yrs
- 0.0%
- Est. flood insurance / yr
- $473 – $860
Fire risk 2/10 · Minimal
- Est. fire insurance / yr
- $1,161 – $2,155
Heat risk 3/10 · Minor
- Hot days now (above 103°F)
- 7 days/yr
- Hot days in 30 yrs
- 16 days/yr
Wind risk 2/10 · Minimal
- Chance of severe wind over 30 yrs
- —
Air-quality risk 1/10 · Minimal
- Unhealthy air days now
- 0 days/yr
- Unhealthy air days in 30 yrs
- 0 days/yr
Risk factors via First Street. Map © Google.
Why this score? — see what drove the C+ grade
The composite is a weighted blend of 9 inputs, each scored 0–100. Each bar is that input's sub-score; the figure is the points it added to the 100-point composite (weight × sub-score).
- Cash flow +22.3/30.0
- ARV discount +15.0/15.0
- DSCR +7.2/10.0
- 1% rule +5.2/10.0
- Livability +3.8/5.0
- Schools +3.0/10.0
- Condition / age +2.5/5.0
- Rent growth +2.0/5.0
- Appreciation +0.0/10.0
$135,000
🖨 Deal sheet 📄 Offer letter ✓ Due diligence
Listing remarks MLS
Opportunity-filled property ready for its next chapter. Unlock the potential in this 3-bedroom, 1-bath, 1 1/2 story home with a great backyard conveniently located in East Fremont near the YMCA. This home is in need of some work and TLC, providing the perfect chance to add value and make it your own or add to your investment portfolio. This property offers strong potential for instant equity, a rental investment, or a personalized renovation project. New furnace, A/C Coil in October of 2020, water heater 2012. Sold AS-IS. Bring your vision and unlock the possibilities! AMA
Key facts
- New furnace
- Water heater
- Great backyard
Tags
Neighborhood map
What this means for you Summary
Snapshot
- This is a 3-bed/1.0-bath single-family listed at $135k.
Deal economics
- At list price, monthly cash flow is $223 ($3k/yr) — positive.
- The deal already cash-flows at list — no discount required.
- Meets the 1% rule at list price ($1k rent vs $135k).
- Recommended offer: $131k (3.0% below list) — sets the bar for market timing.
- Cap rate 8.3% vs local median 3.3% in Fremont — top-decile yield for the area; either an underpriced asset or a hidden risk that comps aren't pricing in. Stress-test before assuming the spread holds.
Location & tenants
- Location reads 76/100 on livability (#92 in NE, #3,751 nationally) — a middle-class / working-renter tenant base. Strengths: cost of living A+, housing A+, health & safety A+; Watch: schools C-, employment D+, commute F.
- Fremont Public Schools (town): math 34% / reading 36% proficiency, ranked #103 of 111 in NE (top 93%) — families likely to look elsewhere, expect single-tenant / working-renter base with shorter leases.
- Market conditions: Rents soft (-2.1%/yr); 238 active listings in the ZIP; 2 comparable units currently listed for rent nearby; 82 units permitted in Dodge County in 2024 (0 in 5+ unit buildings).
Forward outlook
- Local home prices are declining (-3.0%/yr); year-one equity from $933 of loan paydown is wiped out by about $4k of value loss. Plan a longer hold.
Negotiation context
- It's been on market 58 days — a 3% lower offer ($131k) is reasonable based on typical stale-listing flexibility.
Risks & watch-outs
- Watch-outs: built in 1897 — expect roof / HVAC / electrical / plumbing capex.
Questions for the listing agent
- It's been on market 58 days. Have you received any prior offers? Is the seller open to a 3% concession, seller financing, or rate buy-down credit?
- Built in 1897 — when were the roof, HVAC, electrical panel, plumbing, and water heater last replaced?
- Is there a deadline driving the sale (1031 exchange, divorce, estate, relocation)? That informs how much negotiation room exists.
- What's the average days-on-market for RENTAL listings here right now (not sales)? A rising rental-DOM trend means longer vacancies and softer asking-rent achievability than the comps imply.
- What's the recent tenant-quality profile in this submarket — average credit score on applications, eviction rate, late-payment / NSF rate, and stable-employment percentage? A property-management company in the area should have these aggregated.
- How much new for-sale + rental construction is in the pipeline within 1–3 miles? Heavy new supply typically softens prices + rents 12–24 months out; constrained supply supports both.
Investment metrics
- 1% rule
- 1.02% ✓
- Cap rate
- 8.28%
- Cash-on-cash
- 7.08%
- DSCR
- 1.32
- GRM
- 8.2
CMA / ARV
- ARV (median comp)
- $191,767
- List price
- $135,000
- Delta
- -29.60%
- Verdict
- UNDERPRICED
- Comps
- 20 within 1.0 mi
Show comp detail 12 sales within ~0.75 mi
| Address | Dist | Beds/Ba | Sqft | Sold | Price | $/sf | Match |
|---|---|---|---|---|---|---|---|
| 805 N Hancock St | 0.21mi | 3/1.0 | 1,212 (+0%) | 1mo | $115,000 | $95 | 89 |
| 315 N Grant St | 0.13mi | 4/2.0 (+1) | 1,182 (-2%) | 1mo | $225,000 | $190 | 81 |
| 535 N Pebble St | 0.21mi | 3/2.0 | 1,248 (+3%) | 3mo | $162,319 | $130 | 78 |
| 1536 E 1st St | 0.28mi | 2/1.0 (-1) | 1,227 (+2%) | 2mo | $165,000 | $134 | 78 |
| 1225 E 10th St | 0.31mi | 2/1.0 (-1) | 1,146 (-5%) | 1mo | $195,000 | $170 | 71 |
| 141 N Lincoln St | 0.26mi | 3/1.0 | 1,332 (+10%) | 3mo | $197,500 | $148 | 69 |
| 1136 N Garfield St | 0.44mi | 2/2.0 (-1) | 1,244 (+3%) | 1mo | $230,000 | $185 | 65 |
| 1208 - 1210 E 9th St | 0.27mi | 4/1.0 (+1) | 1,356 (+12%) | 3mo | $175,000 | $129 | 59 |
| 200 S Thomas St | 0.42mi | 3/1.0 | 1,064 (-12%) | 2mo | $162,000 | $152 | 58 |
| 1115 N Logan St | 0.52mi | 4/2.0 (+1) | 1,255 (+4%) | 3mo | $198,000 | $158 | 58 |
| 1445 E 11th St | 0.40mi | 2/1.0 (-1) | 1,076 (-11%) | 2mo | $190,000 | $177 | 56 |
| 850 N D St | 0.74mi | 3/2.0 | 1,334 (+10%) | 3mo | $196,000 | $147 | 42 |
Match score weights: distance 35% · size 25% · config 20% · recency 20%. Top-matched comps best support the ARV.
Projected returns pro-forma
-3.0% appreciation · 0.0% rent growth · sell at horizon
- IRR
- -8.7%
- Equity multiple
- 0.69×
- Total profit
- $-11,707
- Equity at exit
- $20,129
- IRR
- -3.4%
- Equity multiple
- 0.80×
- Total profit
- $-7,524
- Equity at exit
- $11,672
Cash invested: $37,800 (down + closing). Projections, not guarantees.
Landlord ↔ Tenant lean methodology
- Overall (STATE)
- 83 Strongly Landlord-Friendly
- State Nebraska
- 83 Strongly Landlord-Friendly · R+13
- County
- — inherits STATE
- City
- — inherits STATE
ZIP-level market 68025
- Home prices YoY
- -34.1%
- Rents YoY
- -2.1%
- Active inventory
- 238
- Price-to-rent
- 8.2×
Monthly cashflow live
- Estimated rent
- $1,371 medium interval (Pro) →
- Mortgage (P&I)
- −$708
- Tax from tax record
- −$96 /mo · $1,152/yr
- Insurance
- −$56
- HOA
- −$0
- Vacancy / Maint / Mgmt
- −$288
- Net cashflow
- $223
Break-even live
UW: 25.0% down · 7.5% · 30yr · 1.5% tax · 5.0% vac · 8.0% maint · 8.0% mgmt
Financing live
Cash to close
- Down payment
- $33,750
- Closing costs
- $4,050
- Reserves months
- —
- Total cash needed
- —
Loan-product check · same deal, 3 products live
Conventional
25% down · 7.5% · 30yr
- Down + closing
- —
- Monthly P&I
- —
- Monthly cashflow
- —
- DSCR
- —
- Eligible?
- —
Personal DTI + credit; lowest rate.
DSCR
20% down · 8.5% · 30yr
- Down + closing
- —
- Monthly P&I
- —
- Monthly cashflow
- —
- DSCR
- —
- Eligible?
- —
No personal income docs; deal must DSCR.
Hard money
10% down · 12.0% · 12mo
- Down + closing
- —
- Monthly P&I
- —
- Monthly cashflow
- —
- DSCR
- —
- Eligible?
- —
Short-term bridge; refi at stabilization.
Rent comps 2 comps
| Address | Beds | Baths | Sqft | Rent | $/sqft | DOM | Units | Dist |
|---|---|---|---|---|---|---|---|---|
| 1619 E Military Ave Unit 2301 Fremont, NE | 2.0 | 2.0 | 1100 | $1,195 | $1.09 | 21d | 1 | 0.21mi |
| 1021 S Howard St Fremont, NE | 1.0–3.0 | 1.0–2.0 | 1038 | $1,610 | $1.55 | 2d | 11 | 0.96mi |
Listing history 13 events
-
2026-06-12statusdays on market $135,000 Pending 58 DOM
-
2026-06-09days on market $135,000 Active 55 DOM
-
2026-06-08days on market $135,000 Active 54 DOM
-
2026-06-07days on market $135,000 Active 53 DOM
-
2026-06-05days on market $135,000 Active 50 DOM
-
2026-06-03pricedays on market $135,000 Active 49 DOM
-
2026-06-02days on market $140,000 Active 48 DOM
-
2026-06-01days on market $140,000 Active 47 DOM
-
2026-05-31days on market $140,000 Active 46 DOM
-
2026-05-30days on market $140,000 Active 45 DOM
-
2026-05-08price $140,000 584-char remark
Show marketing remark (584 chars)
Opportunity-filled property ready for its next chapter. Unlock the potential in this 3-bedroom, 1-bath, 1 1/2 story home with a great backyard conveniently located in East Fremont near the YMCA. This home is in need of some work and TLC, providing the perfect chance to add value and make it your own or add to your investment portfolio. This property offers strong potential for instant equity, a rental investment, or a personalized renovation project. New furnace, A/C Coil in October of 2020, water heater 2012. Sold AS-IS. Bring your vision and unlock the possibilities! AMA
-
2026-04-24price $147,000 584-char remark
Show marketing remark (584 chars)
Opportunity-filled property ready for its next chapter. Unlock the potential in this 3-bedroom, 1-bath, 1 1/2 story home with a great backyard conveniently located in East Fremont near the YMCA. This home is in need of some work and TLC, providing the perfect chance to add value and make it your own or add to your investment portfolio. This property offers strong potential for instant equity, a rental investment, or a personalized renovation project. New furnace, A/C Coil in October of 2020, water heater 2012. Sold AS-IS. Bring your vision and unlock the possibilities! AMA
-
2026-04-15$150,000 New 584-char remark
Show marketing remark (584 chars)
Opportunity-filled property ready for its next chapter. Unlock the potential in this 3-bedroom, 1-bath, 1 1/2 story home with a great backyard conveniently located in East Fremont near the YMCA. This home is in need of some work and TLC, providing the perfect chance to add value and make it your own or add to your investment portfolio. This property offers strong potential for instant equity, a rental investment, or a personalized renovation project. New furnace, A/C Coil in October of 2020, water heater 2012. Sold AS-IS. Bring your vision and unlock the possibilities! AMA
ⓘ Source: listings_history table (triggers on properties + properties_extension) + one-shot
backfill from property_details.listing_events for pre-trigger history.
Tax reassessment forecast NE · Resets to sale price
- Current annual tax
- $1,152 · $96/mo
- Projected year-2 tax
- $2,336 · $195/mo
- Expected delta
- +$1,183/yr (+$99/mo · 102.6%)
ⓘ Screening estimate from a state-policy table — verify with the county assessor before closing.
Climate risk First Street
- Flood 1/10 Low FEMA zone X (shaded) · 0% chance over 30 yrs
- Wildfire 2/10 Low
- Heat 3/10 Moderate 7 d/yr ≥103°F today · 16 d/yr by 30 yrs out
- Wind 2/10 Low
- Air quality 1/10 Low 0 unhealthy d/yr today · 0 by 30 yrs out
Nearby sold comps map
Loading sold comps map…
Walkable amenities ~0.75 mi
Loading nearby amenities…
Taxation est. · year 1
- Rental income
- $16,456
- − Mortgage interest
- −$7,562
- − Property taxes
- −$1,152
- − Insurance
- −$675
- − Repairs & maintenance
- −$1,317
- − Management
- −$1,317
- − Depreciation
- −$3,927
- Taxable income
- $506
- Est. tax owed @ 24.0%
- −$122
- After-tax cash flow
- $2,556/yr
For passive investors: Depreciation is non-cash, so a rental often shows a tax loss while cash-flowing — sheltering income. Rental losses are passive: they offset passive income freely, and up to $25,000/yr can offset ordinary (W-2) income if you actively participate and your MAGI is under $100k (phasing out to $0 by $150k); unused losses carry forward. On sale, claimed depreciation is recaptured at up to 25%, and gains may owe capital-gains tax (a 1031 exchange can defer both). Figures are a year-1 estimate at your 24.0% rate — not tax advice; consult a CPA.
Schools (NCES district)
- District
- Fremont Public Schools
- NCES district ID
- 3170710
- Math proficiency
- 34% ▼ -8.00%
- Reading proficiency
- 36% ▲ 1.00%
- Median HH income
- $47,111
- Composite
- 30.07/100
- National rank
- #6347
- State rank
- #103 of 111 in NE
Livability — Fremont
- Score
- 76/100
- State rank
- #92
- US rank
- #3751
Category grades
Schools grade is shown separately in the Schools card above.
Census & demographics
- Census place
- Fremont, NE
- County
- Dodge County · 31,658 people
- City population
- 31,658
- Metro
- Fremont, NE
- Population (ZIP)
- 31,658
- Household income
- $72,254
- Rent vs Own
- Severe rent burden
- 893.0
Population outlook (Dodge County) Hauer SSP2
- Today (2025)
- 37,191 people
- By 2030
- 37,238 · +0.1%
- By 2040
- 37,256 · +0.2%
- By 2050
- 37,494 · +0.8%
- By 2075
- 39,165 · +5.3%
- By 2100
- 40,221 · +8.1%
Race, ethnicity, and origin ACS 2023
- Neighborhood character
- Predominantly White (78%)
- Race & ethnicity
- White 78% Hispanic / Latino 18% Two or more races 7% Native American 2%
- Hispanic origin (detail)
- Mexican 10%
- Common ancestry
- Portuguese 2% Lithuanian 2% Romanian 2%
- Foreign-born
- 7% · Canada
- Languages at home
- 84% English-only · Spanish 14%
Political lean MEDSL · Dodge
- 2024 margin
- Solid R (+32.6) · D 33.0% · R 65.7% · Other 1.3%
- 2008→2024 swing
- -20.6pp toward R · 2008: -12.0pp · 2024: -32.6pp
- All cycles
- 2024: R+32.6 2020: R+32.1 2016: R+35.3 2012: R+22.7 2008: R+12.0
Not yet ingested
- Civics
- —
Market trends
- HPI YoY
- ▼ -164.59%
- Current HPI
- 318.3329
- Rent YoY
- ▼ -2.14%
- Metro
- Fremont, NE
- State GDP YoY
- ▲ 0.68%
- F500 in state
- 2
Industry mix (Fortune 500 HQ in NE)
| Industry | F500 HQs | Revenue |
|---|---|---|
| Conglomerate | 1 | $371B |
|
||
Price history
-6.7% since first listed3 events — show timeline
- 2026-05-08 Price Changed $140,000 GPRMLS
- 2026-04-24 Price Changed $147,000 GPRMLS
- 2026-04-15 Listed $150,000 GPRMLS
Property tax history
+2.8%/yrLatest (2014): $1,152 · +5.6% YoY. Source: county tax records.
Cash-flow waterfall
monthlySold comps — $/sqft
last 12 mo · ≤1 miLoading sold comps…