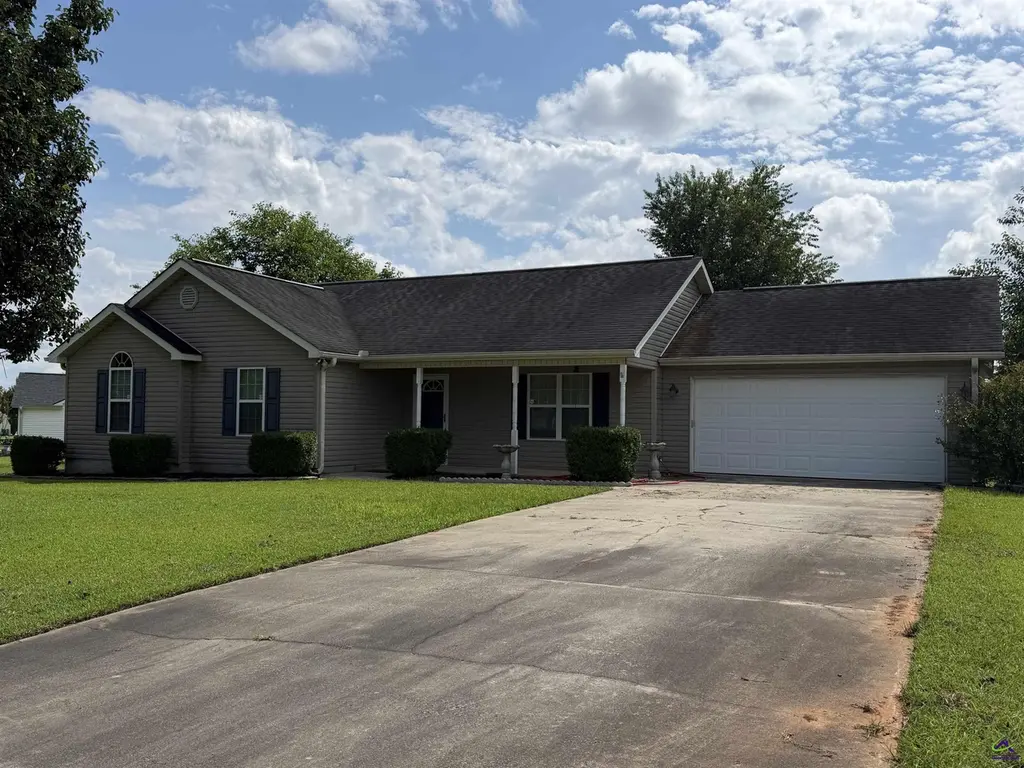
104 Lonesome Doe Cir · Perry, GA
Flood risk 1/10 · Minimal
- FEMA flood zone
- X (unshaded)
- Chance of flooding over 30 yrs
- 0.0%
- Est. flood insurance / yr
- $507 – $1,088
Fire risk 5/10 · Moderate
- Est. fire insurance / yr
- $963 – $1,789
Heat risk 7/10 · Major
- Hot days now (above 109°F)
- 7 days/yr
- Hot days in 30 yrs
- 18 days/yr
Wind risk 8/10 · Major
- Chance of severe wind over 30 yrs
- 80.0%
Air-quality risk 3/10 · Minor
- Unhealthy air days now
- 3 days/yr
- Unhealthy air days in 30 yrs
- 4 days/yr
Risk factors via First Street. Map © Google.
Why this score? — see what drove the D grade
The composite is a weighted blend of 9 inputs, each scored 0–100. Each bar is that input's sub-score; the figure is the points it added to the 100-point composite (weight × sub-score).
- Cash flow +12.8/30.0
- ARV discount +10.0/15.0
- Schools +3.9/10.0
- DSCR +3.8/10.0
- Livability +3.4/5.0
- 1% rule +2.6/10.0
- Rent growth +2.5/5.0
- Condition / age +2.5/5.0
- Appreciation +0.0/10.0
$280,000
🖨 Deal sheet 📄 Offer letter ✓ Due diligence
Listing remarks MLS
Discover this inviting residence nestled in the desirable Kathleen area. Boasting a fresh coat of paint throughout and new LVP flooring, this cozy abode offers a refreshing atmosphere from the moment you step inside. With three bedrooms, two baths, and a bonus room, there's ample space for comfortable living and flexibility to suit your needs. Enjoy the convenience of a large corner lot, perfect for outdoor relaxation or entertaining. Don't miss this opportunity to make this charming home yours!
Key facts
- Large backyard
- Great schools
- 0.41 acre lot
Tags
Property features AI
Exterior
- Parking: Detached garage; Two covered parking spaces (total 2 parking spaces, 2 garage spaces)
- Utilities: Public water; Septic tank sewer
- Home design: Single-family residence; One story
- Construction: Slab foundation
- Exterior features: No pool; Lot in Deer Run subdivision
Interior
- Kitchen: Electric range
- Flooring: Laminate flooring
- Bathrooms: Two full bathrooms
- Heating & cooling: Central heating; Central air conditioning
- Interior features: Storage
Neighborhood map
What this means for you Summary
Snapshot
- This is a 3-bed/2.0-bath single-family listed at $280k.
Deal economics
- At list price, monthly cash flow is $-27 ($-322/yr) — negative.
- To cash-flow at today's rent, offer at most $275k (1.7% below list).
- To meet the 1% rule (rent ≥ 1% of price), the offer needs to be $214k (23.6% below list).
- Recommended offer: $214k (23.6% below list) — sets the bar for 1% rule.
- Cap rate 6.2% vs local median 4.5% in Perry — top-decile yield for the area; either an underpriced asset or a hidden risk that comps aren't pricing in. Stress-test before assuming the spread holds.
Location & tenants
- Location reads 68/100 on livability (#149 in GA) — a middle-class / working-renter tenant base. Strengths: cost of living A+, housing A+, crime B+; Watch: amenities F, commute F, health & safety F.
- Houston County (urban): math 43% / reading 46% proficiency, ranked #23 of 174 in GA (top 13%) — families likely to look elsewhere, expect single-tenant / working-renter base with shorter leases.
- Zoned schools: Perry Middle School (math 53% / reading 51%, grade C+, #60 of 470 statewide, top 13%, 1,070 students, 51% FRL); Perry High School (math 31% / reading 39%, grade F, #84 of 424 statewide, top 20%, 1,478 students, 48% FRL) — zoned schools at 50% FRL track the district average.
- Market conditions: 253 active listings in the ZIP; 11 comparable units currently listed for rent nearby; rentals at typical pace (median 21d on market — plan ~3-4 weeks tenant-placement turnaround); high-income renter base; 1,545 units permitted in Houston County in 2024 (336 in 5+ unit buildings).
Forward outlook
- Local home prices are declining (-3.0%/yr); year-one equity from $2k of loan paydown is wiped out by about $8k of value loss. Plan a longer hold.
- Houston County population projected at +22% by 2050 — long-run rental-demand tailwind backs the buy-and-hold thesis.
Negotiation context
- It's been on market 17 days — a 2% lower offer ($276k) is reasonable based on typical stale-listing flexibility.
- 7 sale attempts since 16y ago with the ask held roughly flat each time — persistent listings suggest the price (not the market) is what's stuck; bring a comps-based counter.
- Current owner paid $240k; 17% above their basis — modest negotiation headroom, anchor on the comps not their cost.
Risks & watch-outs
- Climate carrying-cost: severe wind risk, 80% chance of damaging wind over 30y; moderate wildfire risk; extreme-heat days projected 7→18/yr by 2055 (HVAC capex compounding) — expect insurance premiums to compound above CPI over the hold.
Questions for the listing agent
- What do current leases actually rent for vs. the listed asking? Can we see a recent rent roll and the last 12 months of T-12 income?
- Is there a deadline driving the sale (1031 exchange, divorce, estate, relocation)? That informs how much negotiation room exists.
- The area grade is low — what's the realistic commute time and amenity access for the typical tenant pool here? Any planned neighborhood developments (good or bad) we should know about?
- What's the average days-on-market for RENTAL listings here right now (not sales)? A rising rental-DOM trend means longer vacancies and softer asking-rent achievability than the comps imply.
- What's the recent tenant-quality profile in this submarket — average credit score on applications, eviction rate, late-payment / NSF rate, and stable-employment percentage? A property-management company in the area should have these aggregated.
- How much new for-sale + rental construction is in the pipeline within 1–3 miles? Heavy new supply typically softens prices + rents 12–24 months out; constrained supply supports both.
Investment metrics
- 1% rule
- 0.76% ✗
- Cap rate
- 6.18%
- Cash-on-cash
- -0.41%
- DSCR
- 0.98
- GRM
- 10.9
CMA / ARV
- ARV (on-the-fly)
- $296,352
- Comps found
- 11
Show comp detail 11 sales within ~0.75 mi
| Address | Dist | Beds/Ba | Sqft | Sold | Price | $/sf | Match |
|---|---|---|---|---|---|---|---|
| 104 Lonesome Doe Cir | 0.00mi | 3/2.0 | 1,764 (0%) | 24mo | $240,000 | $136 | 80 |
| 412 Otter's Ridge Dr | 0.29mi | 4/2.0 (+1) | 1,760 (-0%) | 14mo | $305,900 | $174 | 69 |
| 117 Lonesome Doe Cir | 0.07mi | 3/2.0 | 1,534 (-13%) | 10mo | $245,000 | $160 | 66 |
| 208 Willowbrook Ln | 0.24mi | 3/2.0 | 1,620 (-8%) | 10mo | $299,460 | $185 | 66 |
| 102 Emberwood Way | 0.29mi | 4/2.0 (+1) | 1,888 (+7%) | 7mo | $345,504 | $183 | 64 |
| 113 Lonesome Doe Cir | 0.04mi | 3/2.0 | 1,503 (-15%) | 15mo | $245,000 | $163 | 61 |
| 407 Otter's Ridge Dr | 0.29mi | 3/2.0 | 1,929 (+9%) | 16mo | $324,900 | $168 | 57 |
| 306 Sylvan Dr | 0.51mi | 4/2.0 (+1) | 1,848 (+5%) | 13mo | $106,000 | $57 | 53 |
| 2717 Highway 127 | 0.71mi | 3/2.0 | 1,878 (+6%) | 5mo | $850,000 | $453 | 52 |
| 411 Otter's Ridge Dr | 0.29mi | 4/2.0 (+1) | 1,936 (+10%) | 16mo | $324,900 | $168 | 52 |
| 2728 Ga Highway 127 | 0.58mi | 3/2.0 | 1,956 (+11%) | 22mo | $455,000 | $233 | 36 |
Match score weights: distance 35% · size 25% · config 20% · recency 20%. Top-matched comps best support the ARV.
Projected returns pro-forma
-3.0% appreciation · 3.0% rent growth · sell at horizon
- IRR
- -17.0%
- Equity multiple
- 0.40×
- Total profit
- $-47,181
- Equity at exit
- $41,749
- IRR
- -9.0%
- Equity multiple
- 0.44×
- Total profit
- $-43,698
- Equity at exit
- $24,209
Cash invested: $78,400 (down + closing). Projections, not guarantees.
Landlord ↔ Tenant lean methodology
- Overall (STATE)
- 90 Strongly Landlord-Friendly
- State Georgia
- 90 Strongly Landlord-Friendly · R+3
- County
- — inherits STATE
- City
- — inherits STATE
ZIP-level market 31047
- Home prices YoY
- -14.4%
- Active inventory
- 253
- Price-to-rent
- 10.9×
Monthly cashflow live
- Estimated rent
- $2,138 high interval (Pro) →
- Mortgage (P&I)
- −$1,468
- Tax from tax record
- −$131 /mo · $1,570/yr
- Insurance
- −$117
- HOA
- −$0
- Vacancy / Maint / Mgmt
- −$449
- Net cashflow
- $-27
Break-even live
UW: 25.0% down · 7.5% · 30yr · 1.5% tax · 5.0% vac · 8.0% maint · 8.0% mgmt
Financing live
Cash to close
- Down payment
- $70,000
- Closing costs
- $8,400
- Reserves months
- —
- Total cash needed
- —
Loan-product check · same deal, 3 products live
Conventional
25% down · 7.5% · 30yr
- Down + closing
- —
- Monthly P&I
- —
- Monthly cashflow
- —
- DSCR
- —
- Eligible?
- —
Personal DTI + credit; lowest rate.
DSCR
20% down · 8.5% · 30yr
- Down + closing
- —
- Monthly P&I
- —
- Monthly cashflow
- —
- DSCR
- —
- Eligible?
- —
No personal income docs; deal must DSCR.
Hard money
10% down · 12.0% · 12mo
- Down + closing
- —
- Monthly P&I
- —
- Monthly cashflow
- —
- DSCR
- —
- Eligible?
- —
Short-term bridge; refi at stabilization.
Rent comps 11 comps
| Address | Beds | Baths | Sqft | Rent | $/sqft | DOM | Units | Dist |
|---|---|---|---|---|---|---|---|---|
| 107 Linda Sue Ln Kathleen, GA | 3.0 | 2.0 | 1620 | $1,600 | $0.99 | 20d | 1 | 0.74mi |
| 531 Bristleleaf Path , GA | 3.0 | 2.0 | 1620 | $2,250 | $1.39 | 20d | 1 | 0.82mi |
| 114 Linda Sue Ln Kathleen, GA | 4.0 | 2.0 | 1976 | $1,700 | $0.86 | 20d | 1 | 0.82mi |
| 118 Linda Sue Ln Kathleen, GA | 3.0 | 2.0 | 1248 | $1,500 | $1.20 | 20d | 1 | 0.86mi |
| 120 Linda Sue Ln Kathleen, GA | 3.0 | 2.0 | 1248 | $1,500 | $1.20 | 20d | 1 | 0.87mi |
| 307 Willowbrook Ln Kathleen, GA | 3.0 | 2.0 | 1675 | $2,150 | $1.28 | 20d | 1 | 0.89mi |
| 307 Willowbrook Ln Kathleen, GA | 3.0 | 2.0 | 1675 | $2,100 | $1.25 | 43d | 1 | 0.89mi |
| 609 Bristleleaf Path , GA | 3.0 | 2.0 | 1675 | $2,250 | $1.34 | 20d | 1 | 1.06mi |
| 513 Bristleleaf Path , GA | 3.0 | 2.0 | 1675 | $2,250 | $1.34 | 20d | 1 | 1.19mi |
| 521 Bristleleaf Path , GA | 3.0 | 2.0 | 1675 | $2,250 | $1.34 | 20d | 1 | 1.19mi |
| 531 Bristleleaf Path , GA | 3.0 | 2.0 | 1620 | $2,250 | $1.39 | 43d | 1 | 1.19mi |
Listing history 14 events
-
2026-06-19days on market $280,000 Active 17 DOM
-
2026-06-18days on market $280,000 Active 16 DOM
-
2026-06-17days on market $280,000 Active 15 DOM
-
2026-06-16days on market $280,000 Active 14 DOM
-
2026-06-15days on market $280,000 Active 13 DOM
-
2026-06-14days on market $280,000 Active 11 DOM
-
2026-06-13days on market $280,000 Active 10 DOM
-
2026-06-10days on market $280,000 Active 8 DOM
-
2026-06-09days on market $280,000 Active 7 DOM
-
2026-06-08days on market $280,000 Active 6 DOM
-
2026-06-07days on market $280,000 Active 5 DOM
-
2026-06-05days on market $280,000 Active 2 DOM
-
2026-06-03remarks 299-char remark
-
2026-06-03$280,000 Active 1 DOM
ⓘ Source: listings_history table (triggers on properties + properties_extension) + one-shot
backfill from property_details.listing_events for pre-trigger history.
Tax reassessment forecast GA · Resets to sale price
- Current annual tax
- $1,570 · $131/mo
- Projected year-2 tax
- $2,576 · $215/mo
- Expected delta
- +$1,006/yr (+$84/mo · 64.1%)
ⓘ Screening estimate from a state-policy table — verify with the county assessor before closing.
Climate risk First Street
- Flood 1/10 Low FEMA zone X (unshaded) · 0% chance over 30 yrs
- Wildfire 5/10 Major
- Heat 7/10 Severe 7 d/yr ≥109°F today · 18 d/yr by 30 yrs out
- Wind 8/10 Severe 80% chance of damaging wind over 30 yrs
- Air quality 3/10 Moderate 3 unhealthy d/yr today · 4 by 30 yrs out
Nearby sold comps map
Loading sold comps map…
Walkable amenities ~0.75 mi
Loading nearby amenities…
Taxation est. · year 1
- Rental income
- $25,657
- − Mortgage interest
- −$15,684
- − Property taxes
- −$1,570
- − Insurance
- −$1,400
- − Repairs & maintenance
- −$2,053
- − Management
- −$2,053
- − Depreciation
- −$8,145
- Taxable loss
- −$5,248
- Est. tax savings @ 24.0%
- +$1,260
- After-tax cash flow
- $938/yr
For passive investors: Depreciation is non-cash, so a rental often shows a tax loss while cash-flowing — sheltering income. Rental losses are passive: they offset passive income freely, and up to $25,000/yr can offset ordinary (W-2) income if you actively participate and your MAGI is under $100k (phasing out to $0 by $150k); unused losses carry forward. On sale, claimed depreciation is recaptured at up to 25%, and gains may owe capital-gains tax (a 1031 exchange can defer both). Figures are a year-1 estimate at your 24.0% rate — not tax advice; consult a CPA.
Schools (NCES district)
- District
- Houston County
- NCES district ID
- 1302880
- Math proficiency
- 43% ▼ -7.00%
- Reading proficiency
- 46% ▼ -2.00%
- Median HH income
- $54,823
- Composite
- 38.68/100
- National rank
- #4144
- State rank
- #23 of 174 in GA
Livability — Perry
- Score
- 68/100
- State rank
- #149
- US rank
- #9757
Category grades
Schools grade is shown separately in the Schools card above.
Census & demographics
- County
- Houston County · 157,321 people
- City population
- 22,953
- Metro
- Warner Robins, GA
- Population (ZIP)
- 20,203
- Household income
- $117,332
- Rent vs Own
- Severe rent burden
- 11.0
Population outlook (Houston County) Hauer SSP2
- Today (2025)
- 169,502 people
- By 2030
- 178,486 · +5.3%
- By 2040
- 194,642 · +14.8%
- By 2050
- 207,119 · +22.2%
- By 2075
- 231,480 · +36.6%
- By 2100
- 235,034 · +38.7%
Race, ethnicity, and origin ACS 2023
- Neighborhood character
- Majority White (65%)
- Race & ethnicity
- White 65% Black 18% Two or more races 12% Hispanic / Latino 8% Asian 3%
- Hispanic origin (detail)
- Mexican 3% Cuban 2%
- Common ancestry
- Italian 3% Slovak 3% Lithuanian 1%
- Foreign-born
- 6% · Canada, South Korea, Jamaica
- Languages at home
- 94% English-only · Spanish 4% Korean 1% Tagalog/Filipino 1%
Political lean MEDSL · Houston
- 2024 margin
- R (+11.3) · D 44.0% · R 55.3%
- 2008→2024 swing
- +8.9pp toward D · 2008: -20.2pp · 2024: -11.3pp
- All cycles
- 2024: R+11.3 2020: R+12.4 2016: R+21.6 2012: R+20.7 2008: R+20.2
Not yet ingested
- Civics
- —
Market trends
- HPI YoY
- ▼ -36.77%
- Current HPI
- 218.1333
- Rent YoY
- —
- Metro
- Warner Robins, GA
- State GDP YoY
- ▲ 2.66%
- F500 in state
- 28
Industry mix (Fortune 500 HQ in GA)
| Industry | F500 HQs | Revenue |
|---|---|---|
| Paper / Packaging | 2 | $29B |
|
||
| Retail | 1 | $160B |
|
||
| Transportation / Logistics | 1 | $91B |
|
||
| Airlines | 1 | $62B |
|
||
| Consumer Goods | 1 | $47B |
|
||
| Utilities | 1 | $25B |
|
||
Price history
+133.7% since first listed19 events — show timeline
- 2026-06-02 Listed $280,000 CGMLS
- 2024-07-01 Sold (Public Records) $240,000 Public Records
- 2024-06-21 Sold (MLS) $240,000 GAMLS
- 2024-06-21 Sold (MLS) $240,000 CGMLS
- 2024-05-22 Pending — GAMLS
- 2024-05-22 Pending — CGMLS
- 2024-05-10 Listed $240,000 CGMLS
- 2024-05-09 Listed $240,000 GAMLS
- 2018-03-07 Sold (Public Records) $154,000 Public Records
- 2018-03-02 Sold (MLS) $154,000 CGMLS
- 2018-03-02 Sold (MLS) $154,000 GAMLS
- 2017-11-24 Listed $154,000 CGMLS
- 2017-11-24 Listed $154,000 GAMLS
- 2017-05-03 Listing Removed — GAMLS
- 2017-04-25 Listed $154,000 GAMLS
- 2011-06-30 Sold (Public Records) $139,900 Public Records
- 2011-06-27 Sold (MLS) $139,900 CGMLS
- 2010-11-17 Listed $139,900 CGMLS
- 2004-10-29 Sold (Public Records) $119,800 Public Records
Property tax history
+2.4%/yrLatest (2023): $1,570 · +3.4% YoY. Source: county tax records.
Cash-flow waterfall
monthlySold comps — $/sqft
last 12 mo · ≤1 miLoading sold comps…