150 Ocean Lane Dr Unit 7C · Key Biscayne, FL
Flood risk 9/10 · Severe
- FEMA flood zone
- AE
- Chance of flooding over 30 yrs
- 0.99%
- Est. flood insurance / yr
- $1,737 – $8,500
Fire risk 3/10 · Minor
- Est. fire insurance / yr
- $947 – $1,759
Heat risk 10/10 · Severe
- Hot days now (above 102°F)
- 7 days/yr
- Hot days in 30 yrs
- 28 days/yr
Wind risk 10/10 · Severe
- Chance of severe wind over 30 yrs
- 99.0%
Air-quality risk 2/10 · Minimal
- Unhealthy air days now
- 1 days/yr
- Unhealthy air days in 30 yrs
- 1 days/yr
Risk factors via First Street. Map © Google.
Why this score? — see what drove the D+ grade
The composite is a weighted blend of 9 inputs, each scored 0–100. Each bar is that input's sub-score; the figure is the points it added to the 100-point composite (weight × sub-score).
- Cash flow +10.1/30.0
- ARV discount +7.5/15.0
- Appreciation +6.6/10.0
- 1% rule +4.7/10.0
- Rent growth +4.2/5.0
- Schools +4.2/10.0
- Livability +4.2/5.0
- DSCR +2.9/10.0
- Condition / age +2.5/5.0
$835,000
🖨 Deal sheet (PDF) 📄 Offer letter ✓ Due diligence
Listing remarks
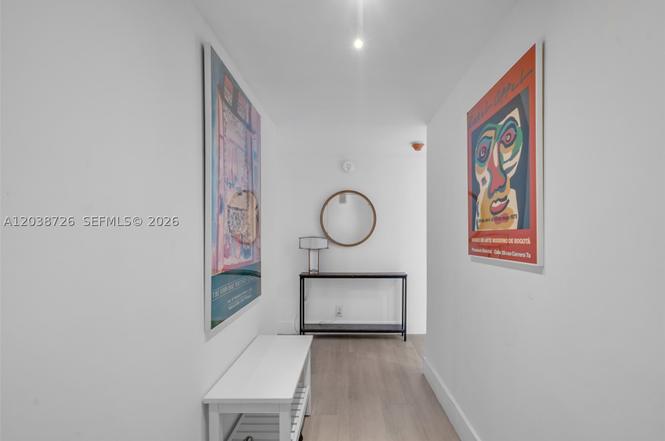
Bright, airy, and move-in ready, this beautifully maintained Island Breakers residence offers a rare combination of skyline, bay, and lush tropical canopy views from an expansive balcony. Thoughtfully updated, the home features a stylish kitchen with quartz countertops, sleek cabinetry, stainless steel appliances, and an open-concept design that flows seamlessly into generous living and dining spaces. Wide-plank flooring runs throughout, while large windows fill the home with natural light. The spacious primary suite includes a walk-in closet and updated bath. Additional highlights include a storage closet, assigned parking, and a prime location just a short walk from the beach, moments fro
Key facts
- Open-concept design
- Quartz countertops
- Expansive balcony
Tags
Property features AI
Finance
- Financial info: Pets allowed
- HOA & community: Monthly association fee of $1,370; Association amenities include bike storage, business center, clubhouse, elevators, fitness center, pool, and storage; Community contains 72 units
Exterior
- Parking: Assigned parking; Guest parking available; 1 covered/garage space
- Security: Intercom
- Utilities: Central air (cooling)
- Home design: Condominium in a 10-story building; Entry located on level 7; Unit attached to building; Effective year built
- Construction: Block construction
- Exterior features: Balcony (screened); Association pool; Property offers a view; Updated/remodeled condition
Interior
- Kitchen: Dishwasher
- Bathrooms: 2 full bathrooms
- Heating & cooling: Central air conditioning
- Interior features: Walk-in closets; Elevator access
Neighborhood map
What this means for you Summary
Snapshot
- This is a 2-bed/2.0-bath condo listed at $835k.
Deal economics
- At list price, monthly cash flow is $-921 ($-11k/yr) — negative.
- To cash-flow at today's rent, offer at most $672k (19.5% below list).
- To meet the 1% rule (rent ≥ 1% of price), the offer needs to be $809k (3.1% below list).
- Recommended offer: $672k (19.5% below list) — sets the bar for cash-flow.
Location & tenants
- Location reads 83/100 on livability (#57 in FL, #1,016 nationally) — a professional / high-income tenant draw. Strengths: crime A+, commute A+, employment A+; Watch: amenities F, cost of living F.
- Miami-Dade (suburban): math 45% / reading 54% proficiency, ranked #40 of 73 in FL (top 55%) — families likely to look elsewhere, expect single-tenant / working-renter base with shorter leases; 64% free/reduced lunch — lower-income household profile, screen leases tightly.
- Zoned schools: Key Biscayne K-8 Center (math 75% / reading 77%, grade A, #198 of 2,144 statewide, top 10%, 921 students, 7% FRL); Ponce De Leon Middle School (math 36% / reading 55%, grade D+, #305 of 571 statewide, top 54%, 888 students, 60% FRL); Coral Gables Senior High School (math 31% / reading 53%, grade F, #275 of 667 statewide, top 42%, 2,824 students, 52% FRL) — zoned schools average 40% FRL vs 64% district-wide (24 pts lower); this property's tenant base skews higher-income than the district average.
- Market conditions: Rents rising fast (+7.0%/yr); 205 active listings in the ZIP; 40 comparable units currently listed for rent nearby; rentals at typical pace (median 24d on market — plan ~3-4 weeks tenant-placement turnaround); high-income renter base; 10,051 units permitted in Miami-Dade County in 2024 (7,758 in 5+ unit buildings).
- At $8,089/mo this rent would consume 53% of the median local household income ($182k/yr) (locally 520% of renters already pay >50% of income on rent) — very limited rent-growth headroom before tenants either downsize or default.
Forward outlook
- In year one you build about $32k of equity ($6k loan paydown + $26k appreciation (3.1% local appreciation)).
- Miami-Dade County population projected at +28% by 2050 — long-run rental-demand tailwind backs the buy-and-hold thesis.
- By year 2, paydown + projected appreciation supports a ~$52k cash-out refi (75% LTV) — recoverable capital for the next deal without selling this one.
Negotiation context
- Only 4 days on market — expect competitive offers; lowballing is unlikely to land.
- 3 sale attempts since 3y ago with the ask held roughly flat each time — persistent listings suggest the price (not the market) is what's stuck; bring a comps-based counter.
Risks & watch-outs
- Watch-outs: flood insurance adds $427/mo.
- Climate carrying-cost: in FEMA flood zone AE (mandatory federal flood insurance); severe wind risk, 99% chance of damaging wind over 30y; extreme-heat days projected 7→28/yr by 2055 (HVAC capex compounding) — expect insurance premiums to compound above CPI over the hold.
Questions for the listing agent
- What do current leases actually rent for vs. the listed asking? Can we see a recent rent roll and the last 12 months of T-12 income?
- Built in 1970 — when were the roof, HVAC, electrical panel, plumbing, and water heater last replaced?
- What's the actual annual flood-insurance premium (NFIP or private), and is the property in a SFHA with mandatory coverage?
- What does the HOA fee cover, when was the last increase, and are there any pending special assessments or reserve-fund shortfalls?
- Any open or pending special assessments — roof, HVAC, plumbing, elevator, façade? What's the per-unit balance and payoff schedule, and is the seller paying it off at close or rolling it to the buyer?
- Is there a deadline driving the sale (1031 exchange, divorce, estate, relocation)? That informs how much negotiation room exists.
- Schools are A-rated — typically a magnet for longer-tenancy family renters. What's the average tenant stay here, and is there a school-zone premium baked into asking?
- The area grade is low — what's the realistic commute time and amenity access for the typical tenant pool here? Any planned neighborhood developments (good or bad) we should know about?
- What's the average days-on-market for RENTAL listings here right now (not sales)? A rising rental-DOM trend means longer vacancies and softer asking-rent achievability than the comps imply.
- What's the recent tenant-quality profile in this submarket — average credit score on applications, eviction rate, late-payment / NSF rate, and stable-employment percentage? A property-management company in the area should have these aggregated.
- How much new apartment / multifamily construction is in the pipeline within 1–3 miles? Heavy new supply (>2% of stock underway) typically softens rents 12–24 months out; light construction supports rent growth.
Investment metrics
- 1% rule
- 0.97% ✗
- Cap rate
- 5.58%
- Cash-on-cash
- -2.54%
- DSCR
- 0.89
- GRM
- 8.6
CMA / ARV
No comps found within radius.
Projected returns pro-forma
3.13% appreciation · 6.96% rent growth · sell at horizon
- IRR
- 5.9%
- Equity multiple
- 1.35×
- Total profit
- $82,372
- Equity at exit
- $381,709
- IRR
- 11.1%
- Equity multiple
- 2.83×
- Total profit
- $428,913
- Equity at exit
- $593,169
Cash invested: $233,800 (down + closing). Projections, not guarantees.
Landlord ↔ Tenant lean methodology
- Overall (STATE)
- 87 Strongly Landlord-Friendly
- State Florida
- 87 Strongly Landlord-Friendly · R+3
- County
- — inherits STATE
- City
- — inherits STATE
ZIP-level market 33149
- Home prices YoY
- 1.0%
- Rents YoY
- 7.0%
- Active inventory
- 205
- Price-to-rent
- 8.6×
Monthly cashflow live
- Estimated rent
- $8,089 high interval (Pro) →
- Mortgage (P&I)
- −$4,379
- Tax from tax record
- −$788 /mo · $9,455/yr
- Insurance
- −$348
- Flood insurance flood zone
- −$427 /mo · $5,118/yr
- HOA
- −$1,370
- Vacancy / Maint / Mgmt
- −$1,699
- Net cashflow
- $-921
Break-even live
Sensitivity live
| Price | -10% $-449 | -5% $-685 | +0% $-921 | +5% $-1,158 | +10% $-1,394 |
|---|---|---|---|---|---|
| Rent | -10% $-1,560 | -5% $-1,241 | +0% $-921 | +5% $-602 | +10% $-282 |
| Rate | -1.0pp $-501 | -0.5pp $-709 | base $-921 | +0.5pp $-1,138 | +1.0pp $-1,358 |
UW: 25.0% down · 7.5% · 30yr · 1.5% tax · 5.0% vac · 8.0% maint · 8.0% mgmt
Financing live
Cash to close
- Down payment
- $208,750
- Closing costs
- $25,050
- Reserves months
- —
- Total cash needed
- —
Loan-product check · same deal, 3 products live
Conventional
25% down · 7.5% · 30yr
- Down + closing
- —
- Monthly P&I
- —
- Monthly cashflow
- —
- DSCR
- —
- Eligible?
- —
Personal DTI + credit; lowest rate.
DSCR
20% down · 8.5% · 30yr
- Down + closing
- —
- Monthly P&I
- —
- Monthly cashflow
- —
- DSCR
- —
- Eligible?
- —
No personal income docs; deal must DSCR.
Hard money
10% down · 12.0% · 12mo
- Down + closing
- —
- Monthly P&I
- —
- Monthly cashflow
- —
- DSCR
- —
- Eligible?
- —
Short-term bridge; refi at stabilization.
Rent comps 40 comps
| Address | Beds | Baths | Sqft | Rent | $/sqft | DOM | Units | Dist |
|---|---|---|---|---|---|---|---|---|
| 50 Ocean Lane Dr #603 Key Biscayne, FL | 3.0 | 2.5 | 1730 | $10,800 | $6.24 | 26d | 1 | 0.07mi |
| 121 Crandon Blvd Key Biscayne, FL | 3.0 | 2.0–3.0 | 1725 | $6,375 | $3.70 | 7d | 2 | 0.10mi |
| 101 Crandon Blvd Key Biscayne, FL | 2.0–3.0 | 2.0 | 1660 | $3,000 | $1.81 | 0d | 4 | 0.10mi |
| 181 Crandon Blvd #306 Key Biscayne, FL | 3.0 | 2.0 | 1600 | $8,000 | $5.00 | 26d | 1 | 0.10mi |
| 181 Crandon Blvd Key Biscayne, FL | 3.0 | 2.0–2.5 | 1710 | $7,900 | $4.62 | 6d | 2 | 0.10mi |
| 77 Crandon Blvd Unit 2E Key Biscayne, FL | 2.0 | 2.0 | 1123 | $4,500 | $4.01 | 26d | 1 | 0.13mi |
| 251 Crandon Blvd #202 Key Biscayne, FL | 2.0 | 2.0 | 1464 | $6,900 | $4.71 | 26d | 1 | 0.14mi |
| 251 Crandon Blvd #338 Key Biscayne, FL | 2.0 | 2.0 | 1546 | $6,500 | $4.20 | 9d | 1 | 0.14mi |
| 251 Crandon Blvd #139 Key Biscayne, FL | 3.0 | 2.0 | 1546 | $12,000 | $7.76 | 26d | 1 | 0.14mi |
| 251 Crandon Blvd #133 Key Biscayne, FL | 2.0 | 2.0 | 1537 | $8,200 | $5.34 | 4d | 1 | 0.14mi |
| 251 Crandon Blvd #1105 Key Biscayne, FL | 2.0 | 2.0 | 1368 | $7,900 | $5.77 | 26d | 1 | 0.14mi |
| 251 Crandon Blvd #306 Key Biscayne, FL | 2.0 | 2.0 | 1546 | $11,000 | $7.12 | 26d | 1 | 0.14mi |
| 251 Crandon Blvd #322 Key Biscayne, FL | 2.0 | 2.0 | 1546 | $7,200 | $4.66 | 4d | 1 | 0.14mi |
| 251 Crandon Blvd #306 Key Biscayne, FL | 2.0 | 2.0 | 1546 | $11,000 | $7.12 | 5d | 1 | 0.14mi |
| 251 Crandon Blvd #1228 Key Biscayne, FL | 2.0 | 2.0 | 1532 | $8,000 | $5.22 | 26d | 1 | 0.14mi |
| 151 Crandon Blvd #441 Key Biscayne, FL | 2.0 | 2.0 | 1532 | $6,500 | $4.24 | 24d | 1 | 0.17mi |
| 151 Crandon Blvd #405 Key Biscayne, FL | 2.0 | 2.0 | 1821 | $7,800 | $4.28 | 5d | 1 | 0.17mi |
| 151 Crandon Blvd #1036 Key Biscayne, FL | 2.0 | 2.0 | 1532 | $7,000 | $4.57 | 26d | 1 | 0.17mi |
| 151 Crandon Blvd #444 Key Biscayne, FL | 2.0 | 2.0 | 1684 | $9,200 | $5.46 | 26d | 1 | 0.17mi |
| 151 Crandon Blvd #405 Key Biscayne, FL | 2.0 | 2.0 | 1821 | $7,800 | $4.28 | 18d | 1 | 0.17mi |
| 151 Crandon Blvd #1036 Key Biscayne, FL | 2.0 | 2.0 | 1532 | $7,000 | $4.57 | 5d | 1 | 0.17mi |
| 151 Crandon Blvd #120 Key Biscayne, FL | 2.0 | 2.0 | 1454 | $6,000 | $4.13 | 26d | 1 | 0.17mi |
| 201 Crandon Blvd #507 Key Biscayne, FL | 3.0 | 2.0 | 1541 | $8,900 | $5.78 | 26d | 1 | 0.23mi |
| 201 Crandon Blvd #343 Key Biscayne, FL | 2.0 | 2.0 | 1541 | $7,600 | $4.93 | 24d | 1 | 0.23mi |
| 201 Crandon Blvd #138 Key Biscayne, FL | 2.0 | 3.0 | 1541 | $12,000 | $7.79 | 26d | 1 | 0.23mi |
| 201 Crandon Blvd #505 Key Biscayne, FL | 1.0 | 1.5 | 1059 | $5,000 | $4.72 | 26d | 1 | 0.23mi |
| 201 Crandon Blvd #207 Key Biscayne, FL | 2.0 | 2.0 | 1541 | $5,250 | $3.41 | 26d | 1 | 0.23mi |
| 201 Crandon Blvd #833 Key Biscayne, FL | 2.0 | 2.0 | 1541 | $9,500 | $6.16 | 4d | 1 | 0.23mi |
| 201 Crandon Blvd #833 Key Biscayne, FL | 2.0 | 2.0 | 1541 | $9,500 | $6.16 | 4d | 1 | 0.23mi |
| 201 Crandon Blvd #120 Key Biscayne, FL | 1.0 | 2.0 | 1009 | $3,795 | $3.76 | 26d | 1 | 0.23mi |
| 201 Crandon Blvd #138 Key Biscayne, FL | 2.0 | 3.0 | 1541 | $12,000 | $7.79 | 5d | 1 | 0.23mi |
| 201 Crandon Blvd #1027 Key Biscayne, FL | 2.0 | 2.0 | 1531 | $9,500 | $6.21 | 9d | 1 | 0.23mi |
| 201 Crandon Blvd #928 Key Biscayne, FL | 2.0 | 2.0 | 1541 | $6,100 | $3.96 | 26d | 1 | 0.23mi |
| 201 Crandon Blvd #1027 Key Biscayne, FL | 2.0 | 2.0 | 1531 | $9,500 | $6.21 | 22d | 1 | 0.23mi |
| 360 Ocean Dr Unit 905S Key Biscayne, FL | 2.0 | 2.5 | 1703 | $20,000 | $11.74 | 26d | 1 | 0.34mi |
| 360 Ocean Dr Unit 905S Key Biscayne, FL | 2.0 | 2.5 | 1703 | $20,000 | $11.74 | 5d | 1 | 0.34mi |
| 350 Ocean Dr Unit 1105N Key Biscayne, FL | 2.0 | 3.5 | 1727 | $25,000 | $14.48 | 26d | 1 | 0.34mi |
| 350 Ocean Dr Unit 1105N Key Biscayne, FL | 2.0 | 3.5 | 1727 | $23,500 | $13.61 | 0d | 1 | 0.34mi |
| 350 Ocean Dr Unit 305N Key Biscayne, FL | 2.0 | 3.5 | 1542 | $18,000 | $11.67 | 0d | 1 | 0.34mi |
| 255 Galen Dr Unit 3D Key Biscayne, FL | 2.0 | 2.0 | 1036 | $4,450 | $4.30 | 15d | 1 | 0.53mi |
HOA detail condo
- Monthly dues
- $1,370 · $16,440/yr
- Likely covers
- parking
- Assessments
- None detected in remarks — confirm with the listing agent.
Listing history 3 events
-
2026-06-21days on market $835,000 Active 4 DOM
-
2026-06-17remarks 699-char remark
-
2026-06-17$835,000 Active 1 DOM
ⓘ Source: listings_history table (triggers on properties + properties_extension) + one-shot
backfill from property_details.listing_events for pre-trigger history.
Tax reassessment forecast FL · Resets to sale price
- Current annual tax
- $9,455 · $788/mo
- Projected year-2 tax
- $9,455 · $788/mo
- Expected delta
- $0/yr ($0/mo · 0.0%)
ⓘ Screening estimate from a state-policy table — verify with the county assessor before closing.
Climate risk First Street
- Flood 9/10 Extreme FEMA zone AE · 99% chance over 30 yrs
- Wildfire 3/10 Moderate
- Heat 10/10 Extreme 7 d/yr ≥102°F today · 28 d/yr by 30 yrs out
- Wind 10/10 Extreme 99% chance of damaging wind over 30 yrs
- Air quality 2/10 Low 1 unhealthy d/yr today · 1 by 30 yrs out
Nearby sold comps map
Loading sold comps map…
Walkable amenities ~0.75 mi
Loading nearby amenities…
Taxation est. · year 1
- Rental income
- $97,063
- − Mortgage interest
- −$46,773
- − Property taxes
- −$9,455
- − Insurance
- −$9,294
- − Repairs & maintenance
- −$7,765
- − Management
- −$7,765
- − HOA
- −$16,440
- − Depreciation
- −$24,291
- Taxable loss
- −$24,720
- Est. tax savings @ 24.0%
- +$5,933
- After-tax cash flow
- $-5,122/yr
For passive investors: Depreciation is non-cash, so a rental often shows a tax loss while cash-flowing — sheltering income. Rental losses are passive: they offset passive income freely, and up to $25,000/yr can offset ordinary (W-2) income if you actively participate and your MAGI is under $100k (phasing out to $0 by $150k); unused losses carry forward. On sale, claimed depreciation is recaptured at up to 25%, and gains may owe capital-gains tax (a 1031 exchange can defer both). Figures are a year-1 estimate at your 24.0% rate — not tax advice; consult a CPA.
Schools (NCES district)
- District
- Miami-Dade
- NCES district ID
- 1200390
- Math proficiency
- 45% ▼ -16.00%
- Reading proficiency
- 54% ▼ -5.00%
- Median HH income
- $43,928
- Composite
- 41.76/100
- National rank
- #3397
- State rank
- #40 of 73 in FL
Livability — Key Biscayne
- Score
- 83/100
- State rank
- #57
- US rank
- #1016
Category grades
Schools grade is shown separately in the Schools card above.
Census & demographics
- Census place
- Key Biscayne, FL
- County
- Miami-Dade County · 2,697,751 people
- City population
- 14,791
- Metro
- Miami-Fort Lauderdale-Pompano Beach, FL
- Population (ZIP)
- 14,791
- Household income
- $181,505
- Rent vs Own
- Severe rent burden
- 520.0
Population outlook (Miami-Dade County) Hauer SSP2
- Today (2025)
- 3,126,439 people
- By 2030
- 3,325,765 · +6.4%
- By 2040
- 3,697,561 · +18.3%
- By 2050
- 4,012,134 · +28.3%
- By 2075
- 4,605,612 · +47.3%
- By 2100
- 4,866,598 · +55.7%
Race, ethnicity, and origin ACS 2023
- Neighborhood character
- Predominantly Hispanic (73%)
- Race & ethnicity
- Hispanic / Latino 73% Two or more races 51% White 23%
- Hispanic origin (detail)
- Mexican 9% Puerto Rican 2% Cuban 9% Salvadoran 11%
- Common ancestry
- Estonian 4% Russian 2% Italian 2%
- Foreign-born
- 59% · Canada, Dominican Republic, Jamaica
- Languages at home
- 17% English-only · Spanish 72% Other Indo-European 7% French/Haitian/Cajun 1%
Political lean MEDSL · Miami-Dade
- 2024 margin
- R (+11.4) · D 43.9% · R 55.4%
- 2008→2024 swing
- -27.6pp toward R · 2008: 16.1pp · 2024: -11.4pp
- All cycles
- 2024: R+11.4 2020: D+7.3 2016: D+29.6 2012: D+23.7 2008: D+16.1
Not yet ingested
- Civics
- —
Market trends
- HPI YoY
- ▲ 3.13%
- Current HPI
- 314.6175
- Rent YoY
- ▲ 6.96%
- Metro
- Miami-Fort Lauderdale-Pompano Beach, FL
- State GDP YoY
- ▲ 3.28%
- F500 in state
- 36
Industry mix (Fortune 500 HQ in FL)
| Industry | F500 HQs | Revenue |
|---|---|---|
| Industrial Technology | 2 | $29B |
|
||
| Insurance | 2 | $17B |
|
||
| Retail | 1 | $60B |
|
||
| Technology Distribution | 1 | $58B |
|
||
| Homebuilding | 1 | $35B |
|
||
| Technology Manufacturing | 1 | $35B |
|
||
Price history
+17295.8% since first listed5 events — show timeline
- 2026-06-17 Listed $835,000 MARMLS
- 2025-06-25 Rental Removed $4,800 MARMLS
- 2025-06-03 Listed for Rent $4,800 MARMLS
- 2024-01-02 Rental Removed $4,800 MARMLS
- 2023-12-08 Listed for Rent $4,800 MARMLS
Property tax history
+8.9%/yrLatest (2025): $9,455 · -9.2% YoY. Source: county tax records.
Cash-flow waterfall
monthlySold comps — $/sqft
last 12 mo · ≤1 miLoading sold comps…