 Multi-family
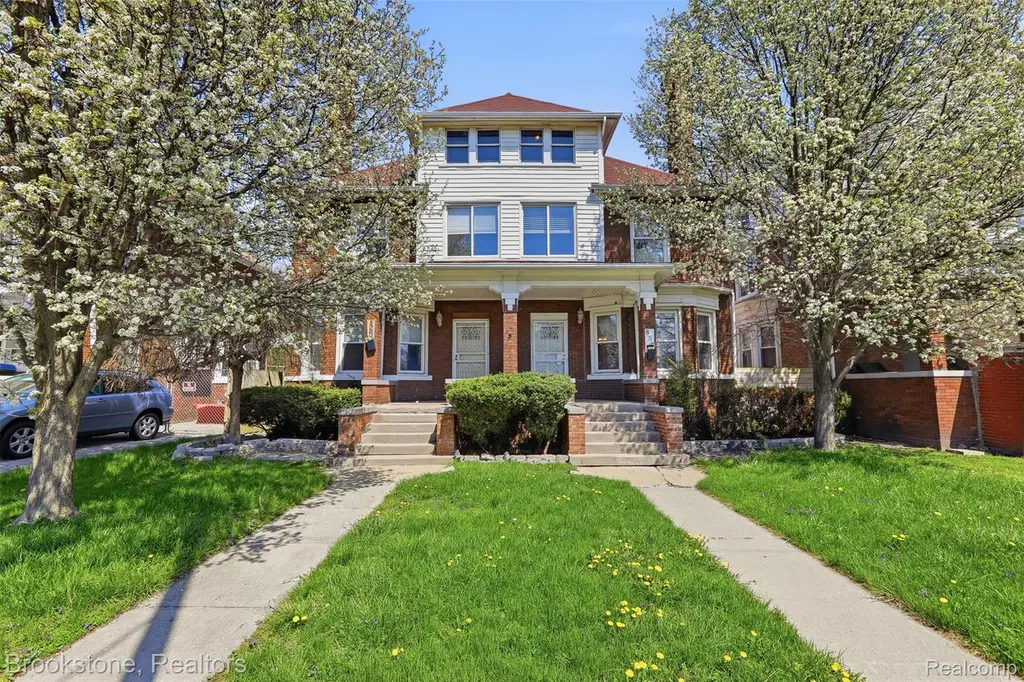
852 & 854 E Grand Blvd · Detroit, MI
Flood risk 1/10 · Minimal
- FEMA flood zone
- X (unshaded)
- Chance of flooding over 30 yrs
- 0.0%
- Est. flood insurance / yr
- $473 – $860
Fire risk 1/10 · Minimal
- Est. fire insurance / yr
- $784 – $1,456
Heat risk 3/10 · Minor
- Hot days now (above 96°F)
- 7 days/yr
- Hot days in 30 yrs
- 15 days/yr
Wind risk 2/10 · Minimal
- Chance of severe wind over 30 yrs
- —
Air-quality risk 3/10 · Minor
- Unhealthy air days now
- 2 days/yr
- Unhealthy air days in 30 yrs
- 5 days/yr
Risk factors via First Street. Map © Google.
Why this score? — see what drove the C+ grade
The composite is a weighted blend of 9 inputs, each scored 0–100. Each bar is that input's sub-score; the figure is the points it added to the 100-point composite (weight × sub-score).
- Cash flow +25.6/30.0
- DSCR +8.5/10.0
- ARV discount +7.5/15.0
- 1% rule +7.2/10.0
- Livability +3.7/5.0
- Appreciation +3.6/10.0
- Rent growth +3.4/5.0
- Condition / age +2.5/5.0
- Schools +1.3/10.0
$349,000
🖨 Deal sheet (PDF) 📄 Offer letter ✓ Due diligence
Multi-family units
County records classify this as Multi-Family (2-4 Unit). Listing-text estimate: 1 unit. estimate disagrees with records
Listing remarks MLS
Fantastic Multi Family. Fullyt furnished. Stunning. Live in one side and rent the other ? Endless Possibilites. Features are too many to list. A must see. 852 features 5 bedrooms on 3 floors and 1.5 baths. 854 features 4 bedrooms on 2 floors and a full attic. Both sides have full basement with walk out access. BATVAD including income, taxes etc. Occupied. All buyers must be pre-qualified. Thank you.
Key facts
- 6,098 sq ft lot
- 6 parking spots
- Built 1907
Property features AI
Finance
- Other: Pets allowed
- Financial info: Property listed as residential income (multifamily)
- HOA & community: Sidewalks in the community
Exterior
- Parking: On-street parking (6 total parking spaces listed)
- Security: Smoke detectors installed
- Utilities: Public water; Public sewer; Electric with circuit breakers
- Home design: Residential income property (multifamily); Multi-family building; Above-grade finished area: 3,076 total
- Construction: Brick construction; Asphalt roof; Brick/mortar foundation; Built on a 0.14-acre lot (45 x 134)
- Exterior features: Outdoor lighting; Covered porch
Interior
- Kitchen: No specific kitchen appliances listed
- Bedrooms: Unit type: 4+ bedrooms (two separate units)
- Bathrooms: 3 full bathrooms and 1 half bathroom (total for property); One unit with 1 bathroom; One unit with 2 bathrooms
- Heating & cooling: Hot water heating (natural gas); Central air conditioning
- Interior features: Gas water heater; Unfinished basement; Laundry room inside unit
- Laundry & utility: In-unit laundry
Neighborhood map
What this means for you Summary
Snapshot
- This is a 7-bed/3.0-bath multifamily listed at $349k.
Deal economics
- At list price, monthly cash flow is $828 ($10k/yr) — positive.
- The deal already cash-flows at list — no discount required.
- Meets the 1% rule at list price ($4k rent vs $349k).
Location & tenants
- Location reads 73/100 on livability (#218 in MI) — a middle-class / working-renter tenant base. Strengths: amenities A+, commute A+, cost of living A+; Watch: crime F, employment F.
- Detroit Public Schools Community District (urban): math 10% / reading 24% proficiency, ranked #499 of 540 in MI (top 92%) — low school quality limits family demand, transient renter base, plan for 1-2y turnover; 90% free/reduced lunch — lower-income household profile, screen leases tightly.
- Zoned schools: Garvey Academy (math 10% / reading 30%, grade F, #1,083 of 1,397 statewide, top 78%, 362 students, 87% FRL); Clippert Academy (379 students, 82% FRL); Southeastern High School (math 5% / reading 15%, grade F, #659 of 713 statewide, top 97%, 644 students, 87% FRL) — zoned schools at 85% FRL track the district average.
- Market conditions: Rents rising (+3.5%/yr); 245 active listings in the ZIP; 2,639 units permitted in Wayne County in 2024 (1,216 in 5+ unit buildings).
- At $4,264/mo this rent would consume 107% of the median local household income ($48k/yr) (locally 2017% of renters already pay >50% of income on rent) — very limited rent-growth headroom before tenants either downsize or default.
Forward outlook
- Local home prices are declining (-2.8%/yr); year-one equity from $2k of loan paydown is wiped out by about $10k of value loss. Plan a longer hold.
- Wayne County population projected at -17% by 2050 — secular population decline; favor cash flow + early exit over multi-decade hold.
- At projected returns (-2.8% appreciation + 3.5% rent growth), your $98k cash investment doubles in ~10 years — after that, you're playing with house money.
Negotiation context
- Only 5 days on market — expect competitive offers; lowballing is unlikely to land.
- 16 sale attempts since 15y ago with the ask held roughly flat each time — persistent listings suggest the price (not the market) is what's stuck; bring a comps-based counter.
Risks & watch-outs
- Watch-outs: built in 1907 — expect roof / HVAC / electrical / plumbing capex.
Questions for the listing agent
- Built in 1907 — when were the roof, HVAC, electrical panel, plumbing, and water heater last replaced?
- Is there a deadline driving the sale (1031 exchange, divorce, estate, relocation)? That informs how much negotiation room exists.
- Schools are F-rated, which usually means shorter tenancies and higher turnover. Who's the typical renter profile here, and what's been the actual vacancy rate?
- Crime grade is F in this area — have there been break-ins, vandalism, or insurance claims at this property in the last 3 years? What carrier currently insures it and at what premium?
- What's the average days-on-market for RENTAL listings here right now (not sales)? A rising rental-DOM trend means longer vacancies and softer asking-rent achievability than the comps imply.
- What's the recent tenant-quality profile in this submarket — average credit score on applications, eviction rate, late-payment / NSF rate, and stable-employment percentage? A property-management company in the area should have these aggregated.
- How much new apartment / multifamily construction is in the pipeline within 1–3 miles? Heavy new supply (>2% of stock underway) typically softens rents 12–24 months out; light construction supports rent growth.
Investment metrics
- 1% rule
- 1.22% ✓
- Cap rate
- 9.14%
- Cash-on-cash
- 10.17%
- DSCR
- 1.45
- GRM
- 6.8
CMA / ARV
- ARV (median comp)
- $66,967
- List price
- $349,000
- Delta
- 421.15%
- Verdict
- OVERPRICED
- Comps
- 20 within 1.0 mi
Show comp detail 5 sales within ~0.75 mi
| Address | Dist | Beds/Ba | Sqft | Sold | Price | $/sf | Match |
|---|---|---|---|---|---|---|---|
| 852 & 854 E Grand Blvd | 0.00mi | 7/3.5 | 3,076 (0%) | 0mo | $350,000 | $114 | 98 |
| 912 E Grand Blvd | 0.11mi | 6/2.0 (-1) | 2,768 (-10%) | 8mo | $300,000 | $108 | 63 |
| 3021 Sheridan St | 0.35mi | 6/2.5 (-1) | 2,986 (-3%) | 12mo | $20,500 | $7 | 62 |
| 4100 Helen St | 0.18mi | 8/4.0 (+1) | 3,452 (+12%) | 3mo | $255,000 | $74 | 60 |
| 2977 Canton St | 0.41mi | 6/2.0 (-1) | 2,730 (-11%) | 5mo | $230,000 | $84 | 49 |
Match score weights: distance 35% · size 25% · config 20% · recency 20%. Top-matched comps best support the ARV.
Projected returns pro-forma
-2.79% appreciation · 3.53% rent growth · sell at horizon
- IRR
- 0.4%
- Equity multiple
- 1.02×
- Total profit
- $1,679
- Equity at exit
- $55,291
- IRR
- 10.3%
- Equity multiple
- 1.84×
- Total profit
- $82,061
- Equity at exit
- $35,793
Cash invested: $97,720 (down + closing). Projections, not guarantees.
Landlord ↔ Tenant lean methodology
- Overall (STATE)
- 62 Landlord-Friendly
- State Michigan
- 62 Landlord-Friendly · EVEN
- County
- — inherits STATE
- City
- — inherits STATE
ZIP-level market 48207
- Home prices YoY
- -2.0%
- Rents YoY
- 3.5%
- Active inventory
- 245
- Price-to-rent
- 11.8×
Monthly cashflow live
- Estimated rent
- $4,264 medium interval (Pro) →
- Mortgage (P&I)
- −$1,830
- Tax from tax record
- −$565 /mo · $6,778/yr
- Insurance
- −$145
- HOA
- −$0
- Vacancy / Maint / Mgmt
- −$895
- Net cashflow
- $828
Break-even live
Sensitivity live
| Price | -10% $1,026 | -5% $927 | +0% $828 | +5% $729 | +10% $631 |
|---|---|---|---|---|---|
| Rent | -10% $491 | -5% $660 | +0% $828 | +5% $997 | +10% $1,165 |
| Rate | -1.0pp $1,004 | -0.5pp $917 | base $828 | +0.5pp $738 | +1.0pp $646 |
2-unit breakdown (identical units grouped — click to expand)
| Units | Beds | Baths | Est. rent |
|---|---|---|---|
| 1× unit | 5 | 1.5 | $2,472 |
| 1× unit | 4 | 1 | $1,792 |
| Total (2 units) | $4,264 | ||
UW: 25.0% down · 7.5% · 30yr · 1.5% tax · 5.0% vac · 8.0% maint · 8.0% mgmt
Financing live
Cash to close
- Down payment
- $87,250
- Closing costs
- $10,470
- Reserves months
- —
- Total cash needed
- —
Loan-product check · same deal, 3 products live
Conventional
25% down · 7.5% · 30yr
- Down + closing
- —
- Monthly P&I
- —
- Monthly cashflow
- —
- DSCR
- —
- Eligible?
- —
Personal DTI + credit; lowest rate.
DSCR
20% down · 8.5% · 30yr
- Down + closing
- —
- Monthly P&I
- —
- Monthly cashflow
- —
- DSCR
- —
- Eligible?
- —
No personal income docs; deal must DSCR.
Hard money
10% down · 12.0% · 12mo
- Down + closing
- —
- Monthly P&I
- —
- Monthly cashflow
- —
- DSCR
- —
- Eligible?
- —
Short-term bridge; refi at stabilization.
Listing history 40 events
-
2026-05-13status Pending 402-char remark
Show marketing remark (402 chars)
Fantastic Multi Family. Fullyt furnished. Stunning. Live in one side and rent the other ? Endless Possibilites. Features are too many to list. A must see. 852 features 5 bedrooms on 3 floors and 1.5 baths. 854 features 4 bedrooms on 2 floors and a full attic. Both sides have full basement with walk out access. BATVAD including income, taxes etc. Occupied. All buyers must be pre-qualified. Thank you.
-
2026-05-13status Pending 404-char remark
Show marketing remark (402 chars)
Fantastic Multi Family. Fullyt furnished. Stunning. Live in one side and rent the other ? Endless Possibilites. Features are too many to list. A must see. 852 features 5 bedrooms on 3 floors and 1.5 baths. 854 features 4 bedrooms on 2 floors and a full attic. Both sides have full basement with walk out access. BATVAD including income, taxes etc. Occupied. All buyers must be pre-qualified. Thank you.
-
2026-05-08$349,000 Active 402-char remark
Show marketing remark (402 chars)
Fantastic Multi Family. Fullyt furnished. Stunning. Live in one side and rent the other ? Endless Possibilites. Features are too many to list. A must see. 852 features 5 bedrooms on 3 floors and 1.5 baths. 854 features 4 bedrooms on 2 floors and a full attic. Both sides have full basement with walk out access. BATVAD including income, taxes etc. Occupied. All buyers must be pre-qualified. Thank you.
-
2026-05-08$349,000 Active 404-char remark
Show marketing remark (402 chars)
Fantastic Multi Family. Fullyt furnished. Stunning. Live in one side and rent the other ? Endless Possibilites. Features are too many to list. A must see. 852 features 5 bedrooms on 3 floors and 1.5 baths. 854 features 4 bedrooms on 2 floors and a full attic. Both sides have full basement with walk out access. BATVAD including income, taxes etc. Occupied. All buyers must be pre-qualified. Thank you.
-
2026-05-06historical $349,000 402-char remark
Show marketing remark (402 chars)
Fantastic Multi Family. Fullyt furnished. Stunning. Live in one side and rent the other ? Endless Possibilites. Features are too many to list. A must see. 852 features 5 bedrooms on 3 floors and 1.5 baths. 854 features 4 bedrooms on 2 floors and a full attic. Both sides have full basement with walk out access. BATVAD including income, taxes etc. Occupied. All buyers must be pre-qualified. Thank you.
-
2026-02-09historical
-
2026-02-09historical
-
2025-09-02$500,000 Active
-
2025-09-01$500,000 Active
-
2023-08-21soldstatus $575,000
-
2023-08-18soldstatus $575,000 Sold
-
2023-08-18soldstatus $575,000 Closed
-
2023-08-09status Pending
-
2023-08-09status Pending
-
2023-07-21$575,000 Active
-
2023-07-21$575,000 Active
-
2023-07-17historical $575,000
-
2023-07-17historical $575,000
-
2023-07-13historical
-
2023-07-13historical
-
2023-03-09status Active
-
2023-03-09status Active
-
2023-01-07status Pending
-
2023-01-07status Pending
-
2022-08-12$600,000 Active
-
2022-08-12$600,000 Active
-
2020-07-20historical
-
2020-07-20historical
-
2020-03-03$300,000 Active
-
2020-03-03$300,000 Active
-
2020-03-02historical
-
2020-03-02historical
-
2020-02-26$300,000 Active
-
2020-02-26$300,000 Active
-
2012-04-04soldstatus $5,500
-
2012-04-04soldstatus $5,500
-
2012-03-06historical
-
2012-03-06historical
-
2011-12-27$15,234
-
2011-12-27$15,234
ⓘ Source: listings_history table (triggers on properties + properties_extension) + one-shot
backfill from property_details.listing_events for pre-trigger history.
Tax reassessment forecast MI · Partial reset (capped growth)
- Current annual tax
- $6,778 · $565/mo
- Projected year-2 tax
- $6,778 · $565/mo
- Expected delta
- $0/yr ($0/mo · 0.0%)
ⓘ Screening estimate from a state-policy table — verify with the county assessor before closing.
Climate risk First Street
- Flood 1/10 Low FEMA zone X (unshaded) · 0% chance over 30 yrs
- Wildfire 1/10 Low
- Heat 3/10 Moderate 7 d/yr ≥96°F today · 15 d/yr by 30 yrs out
- Wind 2/10 Low
- Air quality 3/10 Moderate 2 unhealthy d/yr today · 5 by 30 yrs out
Nearby sold comps map
Loading sold comps map…
Walkable amenities ~0.75 mi
Loading nearby amenities…
Taxation est. · year 1
- Rental income
- $51,168
- − Mortgage interest
- −$19,549
- − Property taxes
- −$6,778
- − Insurance
- −$1,745
- − Repairs & maintenance
- −$4,093
- − Management
- −$4,093
- − Depreciation
- −$10,153
- Taxable income
- $4,756
- Est. tax owed @ 24.0%
- −$1,141
- After-tax cash flow
- $8,796/yr
For passive investors: Depreciation is non-cash, so a rental often shows a tax loss while cash-flowing — sheltering income. Rental losses are passive: they offset passive income freely, and up to $25,000/yr can offset ordinary (W-2) income if you actively participate and your MAGI is under $100k (phasing out to $0 by $150k); unused losses carry forward. On sale, claimed depreciation is recaptured at up to 25%, and gains may owe capital-gains tax (a 1031 exchange can defer both). Figures are a year-1 estimate at your 24.0% rate — not tax advice; consult a CPA.
Schools (NCES district)
- District
- Detroit Public Schools Community District
- NCES district ID
- 2601103
- Math proficiency
- 10% ▼ -2.00%
- Reading proficiency
- 24% ▲ 6.00%
- Median HH income
- $25,815
- Composite
- 13.06/100
- National rank
- #9564
- State rank
- #499 of 540 in MI
Livability — Detroit
- Score
- 73/100
- State rank
- #218
- US rank
- #5427
Category grades
Schools grade is shown separately in the Schools card above.
Census & demographics
- Census place
- Detroit, MI
- County
- Wayne County · 1,562,939 people
- City population
- 572,865
- Metro
- Detroit-Warren-Dearborn, MI
- Population (ZIP)
- 20,848
- Household income
- $47,831
- Rent vs Own
- Severe rent burden
- 2017.0
Population outlook (Wayne County) Hauer SSP2
- Today (2025)
- 1,675,273 people
- By 2030
- 1,620,300 · -3.3%
- By 2040
- 1,502,341 · -10.3%
- By 2050
- 1,384,039 · -17.4%
- By 2075
- 1,124,592 · -32.9%
- By 2100
- 881,193 · -47.4%
Race, ethnicity, and origin ACS 2023
- Neighborhood character
- Predominantly Black (74%)
- Race & ethnicity
- Black 74% White 18% Two or more races 4% Asian 3% Hispanic / Latino 2%
- Common ancestry
- Romanian 2% Italian 1% Lithuanian 1%
- Foreign-born
- 5% · Canada, South Korea
- Languages at home
- 94% English-only · Spanish 2% Other Indo-European 1% Arabic 1%
Political lean MEDSL · Wayne
- 2024 margin
- Strong D (+29.0) · D 62.7% · R 33.7% · Other 3.6%
- 2008→2024 swing
- -20.5pp toward R · 2008: 49.5pp · 2024: 29.0pp
- All cycles
- 2024: D+29.0 2020: D+38.1 2016: D+37.3 2012: D+46.9 2008: D+49.5
Not yet ingested
- Civics
- —
Market trends
- HPI YoY
- ▼ -2.79%
- Current HPI
- 136.6328
- Rent YoY
- ▲ 3.53%
- Metro
- Detroit-Warren-Dearborn, MI
- State GDP YoY
- ▲ 1.37%
- F500 in state
- 28
Industry mix (Fortune 500 HQ in MI)
| Industry | F500 HQs | Revenue |
|---|---|---|
| Automotive Parts | 3 | $48B |
|
||
| Automotive | 2 | $372B |
|
||
| Chemicals | 1 | $45B |
|
||
| Automotive Retail | 1 | $29B |
|
||
| Healthcare / Medical Devices | 1 | $23B |
|
||
| Automotive Technology | 1 | $20B |
|
||
Price history
+2197.5% since first listed44 events — show timeline
- 2026-06-11 Sold (MLS) $350,000 MiRealSource-MiMLS
- 2026-06-11 Sold (MLS) $350,000 REALCOMP
- 2026-05-27 Pending — REALCOMP
- 2026-05-13 Pending — MiRealSource-MiMLS
- 2026-05-13 Pending — REALCOMP
- 2026-05-12 Listing Removed — REALCOMP
- 2026-05-08 Listed $349,000 MiRealSource-MiMLS
- 2026-05-08 Listed $349,000 REALCOMP
- 2026-05-06 Coming Soon $349,000 MiRealSource-MiMLS
- 2026-02-09 Listing Removed — REALCOMP
- 2026-02-09 Listing Removed — MiRealSource-MiMLS
- 2025-09-02 Listed $500,000 REALCOMP
- 2025-09-01 Listed $500,000 MiRealSource-MiMLS
- 2023-08-21 Sold (Public Records) $575,000 Public Records
- 2023-08-18 Sold (MLS) $575,000 MiRealSource-MiMLS
- 2023-08-18 Sold (MLS) $575,000 REALCOMP
- 2023-08-09 Pending — MiRealSource-MiMLS
- 2023-08-09 Pending — REALCOMP
- 2023-07-21 Listed $575,000 MiRealSource-MiMLS
- 2023-07-21 Listed $575,000 REALCOMP
- 2023-07-17 Coming Soon $575,000 MiRealSource-MiMLS
- 2023-07-17 Coming Soon $575,000 REALCOMP
- 2023-07-13 Listing Removed — MiRealSource-MiMLS
- 2023-07-13 Listing Removed — REALCOMP
- 2023-03-09 Relisted — MiRealSource-MiMLS
- 2023-03-09 Relisted — REALCOMP
- 2023-01-07 Pending — MiRealSource-MiMLS
- 2023-01-07 Pending — REALCOMP
- 2022-08-12 Listed $600,000 MiRealSource-MiMLS
- 2022-08-12 Listed $600,000 REALCOMP
- 2020-07-20 Listing Removed — REALCOMP
- 2020-07-20 Listing Removed — MiRealSource-MiMLS
- 2020-03-03 Listed $300,000 MiRealSource-MiMLS
- 2020-03-03 Listed $300,000 REALCOMP
- 2020-03-02 Listing Removed — REALCOMP
- 2020-03-02 Listing Removed — MiRealSource-MiMLS
- 2020-02-26 Listed $300,000 MiRealSource-MiMLS
- 2020-02-26 Listed $300,000 REALCOMP
- 2012-04-04 Sold (MLS) $5,500 MiRealSource-MiMLS
- 2012-04-04 Sold (MLS) $5,500 REALCOMP
- 2012-03-06 Listing Removed — MiRealSource-MiMLS
- 2012-03-06 Listing Removed — REALCOMP
- 2011-12-27 Listed $15,234 MiRealSource-MiMLS
- 2011-12-27 Listed $15,234 REALCOMP
Property tax history
+15.2%/yrLatest (2025): $6,778 · +38.2% YoY. Source: county tax records.
Cash-flow waterfall
monthlySold comps — $/sqft
last 12 mo · ≤1 miLoading sold comps…