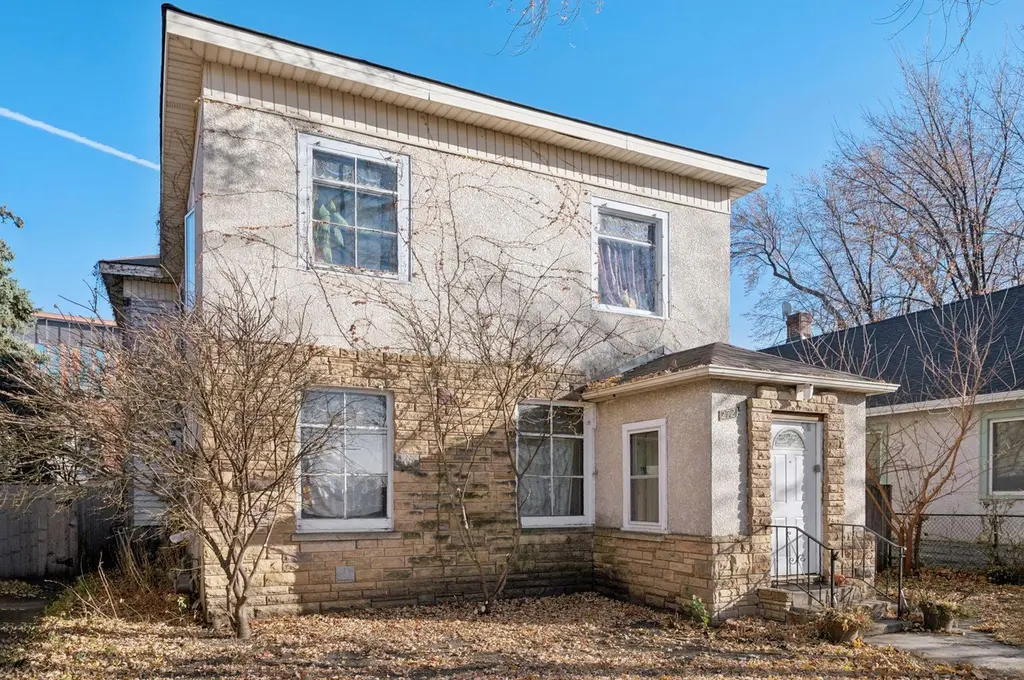
 Fourplex
2721 Columbus Ave · Minneapolis, MN
Flood risk 1/10 · Minimal
- FEMA flood zone
- X (unshaded)
- Chance of flooding over 30 yrs
- 0.0%
- Est. flood insurance / yr
- $473 – $860
Fire risk 1/10 · Minimal
- Est. fire insurance / yr
- $888 – $1,650
Heat risk 2/10 · Minimal
- Hot days now (above 99°F)
- 7 days/yr
- Hot days in 30 yrs
- 14 days/yr
Wind risk 2/10 · Minimal
- Chance of severe wind over 30 yrs
- —
Air-quality risk 2/10 · Minimal
- Unhealthy air days now
- 1 days/yr
- Unhealthy air days in 30 yrs
- 1 days/yr
Risk factors via First Street. Map © Google.
Why this score? — see what drove the C- grade
The composite is a weighted blend of 9 inputs, each scored 0–100. Each bar is that input's sub-score; the figure is the points it added to the 100-point composite (weight × sub-score).
- Cash flow +22.9/30.0
- DSCR +7.3/10.0
- 1% rule +5.9/10.0
- ARV discount +4.9/15.0
- Livability +3.9/5.0
- Rent growth +3.6/5.0
- Schools +3.5/10.0
- Condition / age +2.5/5.0
- Appreciation +0.0/10.0
$414,900
🖨 Deal sheet (PDF) 📄 Offer letter ✓ Due diligence
Multi-family units
County records classify this as Multi-Family (5+ Unit). Listing-text estimate: 4 units. estimate disagrees with records
5+ unit building — per-unit beds/baths from public records are typically unavailable; the breakdown below (if shown) is an estimate from the listing text.
Listing remarks
Welcome to 2721 Columbus Avenue S, a classic Minneapolis fourplex that blends historic charm with strong investment potential. Built in 1906, this well-maintained property showcases timeless craftsmanship and nearly 4,000 sq. ft. of living space across four bright, spacious units. Located on a quiet, tree-lined block in the Phillips West neighborhood, residents enjoy quick access to downtown, the Midtown Greenway, and Powderhorn Park. Ideal for investors or owner-occupants, this property offers steady income, character, and convenience — all within one of Minneapolis’s most connected urban neighborhoods. 2721 Columbus Avenue S is more than a building; it’s an opportunity t
Key facts
- Historic charm
- Powderhorn park
- Midtown greenway
Tags
Property features AI
Finance
- Other: Neighborhood number 63; Level topography; Directions: 26th to Columbus, south to property
- Financial info: Property is a multi-unit building with 4 total units; Gross income reported as $40,080; Net operating income reported as $16,330; Owner pays gas, water, sewer, taxes, and trash collection; Tenants pay cable TV, electricity, and telephone; Reported expenses: fuel $1,642; water/sewer $6,270; insurance $3,738; management $1,200
- HOA & community: Association amenities include laundry, lobby entrance, security lighting, and other shared services
Exterior
- Parking: Multiple garages with storage; Four garage spaces (detached/attached not specified)
- Security: Security lighting listed as an association amenity; Lobby entrance (building amenity)
- Utilities: City water connected; City sewer connected; Electric and natural gas service
- Home design: Residential income property; Two levels; Owner occupied; Main living area provided across multiple levels
- Construction: Brick/mortar foundation; Roof age 8 years or less; Foundation area approximately 2,700 (building total area info provided)
- Exterior features: Stone and stucco exterior; Medium tree coverage; Public transit within six blocks; City street frontage; Publicly maintained road
Interior
- Kitchen: Ranges in units; Refrigerators in units; Solid surface countertops
- Bedrooms: Two bedrooms total (individual unit breakdown: three units with 1 bedroom each listed; total units = 4)
- Flooring: Hardwood floors
- Bathrooms: Multiple full bathrooms (each listed unit includes 1 full bathroom)
- Heating & cooling: Boiler heating; Window cooling units in individual units; Fuel: Natural gas and electric
- Interior features: Hardwood floors; Natural woodwork; Solid surface countertops; Kitchen window; Shared basement access; Unfinished basement with storage/locker space; Level main living area
- Laundry & utility: Laundry room (lower level); Building offers laundry as an association amenity
Neighborhood map
What this means for you Summary
Snapshot
- This is a 4 × 1-bed/?-bath units multifamily listed at $415k.
Deal economics
- At list price, monthly cash flow is $727 ($9k/yr) — positive. Per door: $182/mo.
- The deal already cash-flows at list — no discount required.
- Meets the 1% rule at list price ($5k rent vs $415k).
- Recommended offer: $409k (1.5% below list) — sets the bar for market timing.
- Cap rate 8.4% vs local median 3.1% in Minneapolis — top-decile yield for the area; either an underpriced asset or a hidden risk that comps aren't pricing in. Stress-test before assuming the spread holds.
Location & tenants
- Location reads 78/100 on livability (#110 in MN, #2,525 nationally) — a middle-class / working-renter tenant base. Strengths: amenities A+, commute A+, housing A+; Watch: cost of living C-, crime F.
- Minneapolis Public School District (urban): math 35% / reading 46% proficiency, ranked #217 of 301 in MN (top 72%) — families likely to look elsewhere, expect single-tenant / working-renter base with shorter leases.
- Zoned schools: Ella Baker Elementary (math 2% / reading 17%, grade F, #829 of 857 statewide, top 98%, 602 students, 90% FRL); Anwatin Middle (math 12% / reading 27%, grade F, #234 of 258 statewide, top 92%, 320 students, 81% FRL); Southwest High (math 47% / reading 67%, grade C, #64 of 471 statewide, top 16%, 1,484 students, 29% FRL).
- Market conditions: Rents rising fast (+4.3%/yr); 148 active listings in the ZIP; 15 comparable units currently listed for rent nearby; rentals leasing fast (median 5d on market — plan ~1-2 weeks tenant-placement turnaround); solid renter incomes; 4,651 units permitted in Hennepin County in 2024 (2,443 in 5+ unit buildings).
- At $4,517/mo this rent would consume 69% of the median local household income ($78k/yr) (locally 1583% of renters already pay >50% of income on rent) — very limited rent-growth headroom before tenants either downsize or default.
Forward outlook
- Local home prices are declining (-3.0%/yr); year-one equity from $3k of loan paydown is wiped out by about $12k of value loss. Plan a longer hold.
- Hennepin County population projected at +30% by 2050 — long-run rental-demand tailwind backs the buy-and-hold thesis.
Negotiation context
- It's been on market 21 days — a 2% lower offer ($409k) is reasonable based on typical stale-listing flexibility.
- 8 sale attempts since 23y ago with the ask held roughly flat each time — persistent listings suggest the price (not the market) is what's stuck; bring a comps-based counter.
- Current owner paid $70k; list at $415k implies a 489% gain — meaningful room to come down on a strong offer.
Risks & watch-outs
- Watch-outs: built in 1906 — expect roof / HVAC / electrical / plumbing capex.
Questions for the listing agent
- Can we see the unit-by-unit rent roll, current vacancy, and any below-market leases? What's the average tenancy length?
- What capital expenditures (roof, boiler, parking lot, exteriors) have been made in the last 5 years, and what's planned in the next 2?
- Built in 1906 — when were the roof, HVAC, electrical panel, plumbing, and water heater last replaced?
- Is there a deadline driving the sale (1031 exchange, divorce, estate, relocation)? That informs how much negotiation room exists.
- Crime grade is F in this area — have there been break-ins, vandalism, or insurance claims at this property in the last 3 years? What carrier currently insures it and at what premium?
- What's the average days-on-market for RENTAL listings here right now (not sales)? A rising rental-DOM trend means longer vacancies and softer asking-rent achievability than the comps imply.
- What's the recent tenant-quality profile in this submarket — average credit score on applications, eviction rate, late-payment / NSF rate, and stable-employment percentage? A property-management company in the area should have these aggregated.
- How much new apartment / multifamily construction is in the pipeline within 1–3 miles? Heavy new supply (>2% of stock underway) typically softens rents 12–24 months out; light construction supports rent growth.
Investment metrics
- 1% rule
- 1.09% ✓
- Cap rate
- 8.39%
- Cash-on-cash
- 7.51%
- DSCR
- 1.33
- GRM
- 7.7
CMA / ARV
- ARV (median comp)
- $392,386
- List price
- $414,900
- Delta
- 5.74%
- Verdict
- FAIR
- Comps
- 3 within 1.0 mi
Projected returns pro-forma
-3.0% appreciation · 4.3% rent growth · sell at horizon
- IRR
- -3.4%
- Equity multiple
- 0.87×
- Total profit
- $-14,907
- Equity at exit
- $61,863
- IRR
- 7.7%
- Equity multiple
- 1.62×
- Total profit
- $72,051
- Equity at exit
- $35,873
Cash invested: $116,172 (down + closing). Projections, not guarantees.
Landlord ↔ Tenant lean methodology
- Overall (CITY)
- 34 Tenant-Leaning
- State Minnesota
- 46 Balanced · D+2
- County
- — inherits STATE
- City Minneapolis
- 34 Tenant-Leaning · D+50
ZIP-level market 55407
- Rents YoY
- 4.3%
- Active inventory
- 148
- Price-to-rent
- 30.6×
Monthly cashflow live
- Estimated rent
- $4,517 high interval (Pro) →
- Mortgage (P&I)
- −$2,176
- Tax from tax record
- −$493 /mo · $5,916/yr
- Insurance
- −$173
- HOA
- −$0
- Lot rent
- −$0
- Vacancy / Maint / Mgmt
- −$949
- Net cashflow
- $727
Break-even live
Sensitivity live
| Price | -10% $962 | -5% $844 | +0% $727 | +5% $609 | +10% $492 |
|---|---|---|---|---|---|
| Rent | -10% $370 | -5% $548 | +0% $727 | +5% $905 | +10% $1,084 |
| Rate | -1.0pp $936 | -0.5pp $832 | base $727 | +0.5pp $619 | +1.0pp $510 |
4-unit breakdown (identical units grouped — click to expand)
| Units | Beds | Baths | Est. rent |
|---|---|---|---|
| 4× units | 1 | — | $4,516 |
| #1 | 1 | — | $1,129 |
| #2 | 1 | — | $1,129 |
| #3 | 1 | — | $1,129 |
| #4 | 1 | — | $1,129 |
| Total (4 units) | $4,517 | ||
UW: 25.0% down · 7.5% · 30yr · 1.5% tax · 5.0% vac · 8.0% maint · 8.0% mgmt
Financing live
Cash to close
- Down payment
- $103,725
- Closing costs
- $12,447
- Reserves months
- —
- Total cash needed
- —
Loan-product check · same deal, 3 products live
Conventional
25% down · 7.5% · 30yr
- Down + closing
- —
- Monthly P&I
- —
- Monthly cashflow
- —
- DSCR
- —
- Eligible?
- —
Personal DTI + credit; lowest rate.
DSCR
20% down · 8.5% · 30yr
- Down + closing
- —
- Monthly P&I
- —
- Monthly cashflow
- —
- DSCR
- —
- Eligible?
- —
No personal income docs; deal must DSCR.
Hard money
10% down · 12.0% · 12mo
- Down + closing
- —
- Monthly P&I
- —
- Monthly cashflow
- —
- DSCR
- —
- Eligible?
- —
Short-term bridge; refi at stabilization.
Rent comps 15 comps
| Address | Beds | Baths | Sqft | Rent | $/sqft | DOM | Units | Dist |
|---|---|---|---|---|---|---|---|---|
| 2821 1st Ave S Unit 2 Minneapolis, MN | 3.0 | 1.0 | 1743 | $1,600 | $0.92 | 5d | 1 | 0.62mi |
| 412 E 34th St Minneapolis, MN | 3.0 | 1.5 | 1763 | $1,800 | $1.02 | 26d | 1 | 0.84mi |
| 1819 15th Ave S Minneapolis, MN | 3.0 | 1.5 | 1700 | $2,050 | $1.21 | 16d | 1 | 0.92mi |
| 2217 Grand Ave S Unit 2215 Minneapolis, MN | 3.0 | 2.0 | 2000 | $2,100 | $1.05 | 46d | 1 | 1.10mi |
| 1111 3rd Ave S Unit 1511914P Minneapolis, MN | 5.0 | 1.0–3.0 | 1178 | $7,727 | $6.56 | 1d | 5 | 1.27mi |
| 615 S 8th St Minneapolis, MN | 2.0 | 1.0–2.5 | 1252 | $6,125 | $4.89 | 1d | 49 | 1.33mi |
| 1369 Spruce Pl Minneapolis, MN | 1.0–3.0 | 1.0–2.5 | 1396 | $4,125 | $2.95 | 1d | 25 | 1.36mi |
| 2726 Colfax Ave S Unit 2 Minneapolis, MN | 2.0 | 1.0 | 1540 | $2,500 | $1.62 | 20d | 1 | 1.39mi |
| 3450 Harriet Ave Unit 1 Minneapolis, MN | 2.0 | 2.0 | 1500 | $1,800 | $1.20 | 17d | 1 | 1.42mi |
| 415 Oak Grove St Minneapolis, MN | 2.0 | 1.0–2.0 | 1019 | $3,590 | $3.52 | 0d | 12 | 1.43mi |
| 650 Portland Ave Minneapolis, MN | 2.0 | 1.0–2.0 | 1104 | $4,141 | $3.75 | 1d | 16 | 1.45mi |
| 3201 24th Ave S Minneapolis, MN | 3.0 | 2.0 | 2631 | $3,395 | $1.29 | 46d | 1 | 1.45mi |
| 430 Oak Grove St Minneapolis, MN | 1.0–2.0 | 1.0–2.0 | 1085 | $4,450 | $4.10 | 1d | 10 | 1.47mi |
| 3921 Portland Ave Minneapolis, MN | 3.0 | 2.0 | 2016 | $1,750 | $0.87 | 46d | 1 | 1.48mi |
| 2837 Emerson Ave S Minneapolis, MN | 2.0 | 1.0–2.5 | 1061 | $3,000 | $2.83 | 1d | 44 | 1.50mi |
Listing history 34 events
-
2026-06-22days on market $414,900 Active 21 DOM
-
2026-06-21days on market $414,900 Active 20 DOM
-
2026-06-18days on market $414,900 Active 17 DOM
-
2026-06-17days on market $414,900 Active 16 DOM
-
2026-06-16days on market $414,900 Active 15 DOM
-
2026-06-15days on market $414,900 Active 14 DOM
-
2026-06-13days on market $414,900 Active 12 DOM
-
2026-06-09days on market $414,900 Active 8 DOM
-
2026-06-08days on market $414,900 Active 7 DOM
-
2026-06-07days on market $414,900 Active 6 DOM
-
2026-06-04days on market $414,900 Active 3 DOM
-
2026-06-03days on market $414,900 Active 2 DOM
-
2026-06-02remarks 681-char remark
-
2026-06-02days on market $414,900 Active 1 DOM
-
2026-06-01days on market $414,900 Active 119 DOM
-
2026-05-31days on market $414,900 Active 118 DOM
-
2026-03-05status Active 765-char remark
-
2025-11-12$434,900 Active 765-char remark
-
2025-11-10historical $434,900 765-char remark
-
2009-11-13historical
-
2009-08-17soldstatus $70,461
-
2009-01-08$139,900
-
2009-01-05historical
-
2008-11-05$174,900
-
2005-03-23soldstatus $240,000
-
2004-05-24soldstatus $250,000
-
2004-05-03soldstatus $250,000
-
2004-04-09historical
-
2004-02-16$249,000
-
2004-01-31historical
-
2004-01-02$269,900
-
2003-12-05historical
-
2003-06-05$289,000
-
1982-07-01soldstatus $99,000
ⓘ Source: listings_history table (triggers on properties + properties_extension) + one-shot
backfill from property_details.listing_events for pre-trigger history.
Tax reassessment forecast MN · Partial reset (capped growth)
- Current annual tax
- $5,916 · $493/mo
- Projected year-2 tax
- $5,916 · $493/mo
- Expected delta
- $0/yr ($0/mo · 0.0%)
ⓘ Screening estimate from a state-policy table — verify with the county assessor before closing.
Climate risk First Street
- Flood 1/10 Low FEMA zone X (unshaded) · 0% chance over 30 yrs
- Wildfire 1/10 Low
- Heat 2/10 Low 7 d/yr ≥99°F today · 14 d/yr by 30 yrs out
- Wind 2/10 Low
- Air quality 2/10 Low 1 unhealthy d/yr today · 1 by 30 yrs out
Nearby sold comps map
Loading sold comps map…
Walkable amenities ~0.75 mi
Loading nearby amenities…
Taxation est. · year 1
- Rental income
- $54,204
- − Mortgage interest
- −$23,241
- − Property taxes
- −$5,916
- − Insurance
- −$2,074
- − Repairs & maintenance
- −$4,336
- − Management
- −$4,336
- − Depreciation
- −$12,070
- Taxable income
- $2,230
- Est. tax owed @ 24.0%
- −$535
- After-tax cash flow
- $8,186/yr
For passive investors: Depreciation is non-cash, so a rental often shows a tax loss while cash-flowing — sheltering income. Rental losses are passive: they offset passive income freely, and up to $25,000/yr can offset ordinary (W-2) income if you actively participate and your MAGI is under $100k (phasing out to $0 by $150k); unused losses carry forward. On sale, claimed depreciation is recaptured at up to 25%, and gains may owe capital-gains tax (a 1031 exchange can defer both). Figures are a year-1 estimate at your 24.0% rate — not tax advice; consult a CPA.
Schools (NCES district)
- District
- Minneapolis Public School District
- NCES district ID
- 2721240
- Math proficiency
- 35% ▼ -7.00%
- Reading proficiency
- 46% ▼ -1.00%
- Median HH income
- $50,521
- Composite
- 34.92/100
- National rank
- #5067
- State rank
- #217 of 301 in MN
Livability — Minneapolis
- Score
- 78/100
- State rank
- #110
- US rank
- #2525
Category grades
Schools grade is shown separately in the Schools card above.
Census & demographics
- Census place
- Minneapolis, MN
- County
- Hennepin County · 1,150,272 people
- City population
- 417,555
- Metro
- Minneapolis-St. Paul-Bloomington, MN-WI
- Population (ZIP)
- 37,667
- Household income
- $78,464
- Rent vs Own
- Severe rent burden
- 1583.0
Population outlook (Hennepin County) Hauer SSP2
- Today (2025)
- 1,405,227 people
- By 2030
- 1,492,650 · +6.2%
- By 2040
- 1,660,157 · +18.1%
- By 2050
- 1,823,498 · +29.8%
- By 2075
- 2,221,283 · +58.1%
- By 2100
- 2,509,976 · +78.6%
Race, ethnicity, and origin ACS 2023
- Neighborhood character
- Diverse neighborhood (Simpson 0.66)
- Race & ethnicity
- White 50% Hispanic / Latino 23% Black 18% Two or more races 10% Asian 2% Native American 2%
- Hispanic origin (detail)
- Mexican 15%
- Common ancestry
- Portuguese 8% Romanian 3% Lithuanian 2%
- Foreign-born
- 18% · Canada, Jamaica
- Languages at home
- 68% English-only · Spanish 20% Other Asian/Pacific 1%
Political lean MEDSL · Hennepin
- 2024 margin
- Solid D (+42.6) · D 70.2% · R 27.5% · Other 2.3%
- 2008→2024 swing
- +14.0pp toward D · 2008: 28.6pp · 2024: 42.6pp
- All cycles
- 2024: D+42.6 2020: D+43.2 2016: D+35.3 2012: D+27.1 2008: D+28.6
Not yet ingested
- Civics
- —
Market trends
- HPI YoY
- ▼ -211.97%
- Current HPI
- 292.0322
- Rent YoY
- ▲ 4.30%
- Metro
- Minneapolis-St. Paul-Bloomington, MN-WI
- State GDP YoY
- ▲ 2.41%
- F500 in state
- 34
Industry mix (Fortune 500 HQ in MN)
| Industry | F500 HQs | Revenue |
|---|---|---|
| Healthcare | 2 | $407B |
|
||
| Retail | 2 | $150B |
|
||
| Consumer Goods | 2 | $32B |
|
||
| Industrial Machinery | 2 | $6B |
|
||
| Agriculture | 1 | $40B |
|
||
| Healthcare / Medical Devices | 1 | $32B |
|
||
Price history
+319.1% since first listed21 events — show timeline
- 2026-06-01 Listing Removed — NORTHSTARMLS as Distributed by MLS Grid
- 2026-06-01 Listed $414,900 NORTHSTARMLS as Distributed by MLS Grid
- 2026-05-29 Price Changed $414,900 NORTHSTARMLS as Distributed by MLS Grid
- 2026-03-05 Relisted — NORTHSTARMLS as Distributed by MLS Grid
- 2025-11-12 Listed $434,900 NORTHSTARMLS as Distributed by MLS Grid
- 2025-11-10 Coming Soon — NORTHSTARMLS as Distributed by MLS Grid
- 2009-11-13 Listing Removed — NORTHSTARMLS as Distributed by MLS Grid
- 2009-08-17 Sold (Public Records) $70,461 Public Records
- 2009-01-08 Listed $139,900 NORTHSTARMLS as Distributed by MLS Grid
- 2009-01-05 Listing Removed — NORTHSTARMLS as Distributed by MLS Grid
- 2008-11-05 Listed $174,900 NORTHSTARMLS as Distributed by MLS Grid
- 2005-03-23 Sold (Public Records) $240,000 Public Records
- 2004-05-24 Sold (Public Records) $250,000 Public Records
- 2004-05-03 Sold (MLS) $250,000 NORTHSTARMLS as Distributed by MLS Grid
- 2004-04-09 Listing Removed — NORTHSTARMLS as Distributed by MLS Grid
- 2004-02-16 Listed $249,000 NORTHSTARMLS as Distributed by MLS Grid
- 2004-01-31 Listing Removed — NORTHSTARMLS as Distributed by MLS Grid
- 2004-01-02 Listed $269,900 NORTHSTARMLS as Distributed by MLS Grid
- 2003-12-05 Listing Removed — NORTHSTARMLS as Distributed by MLS Grid
- 2003-06-05 Listed $289,000 NORTHSTARMLS as Distributed by MLS Grid
- 1982-07-01 Sold (Public Records) $99,000 Public Records
Property tax history
+3.0%/yrLatest (2025): $5,916 · +15.0% YoY. Source: county tax records.
Cash-flow waterfall
monthlySold comps — $/sqft
last 12 mo · ≤1 miLoading sold comps…