 Multi-family
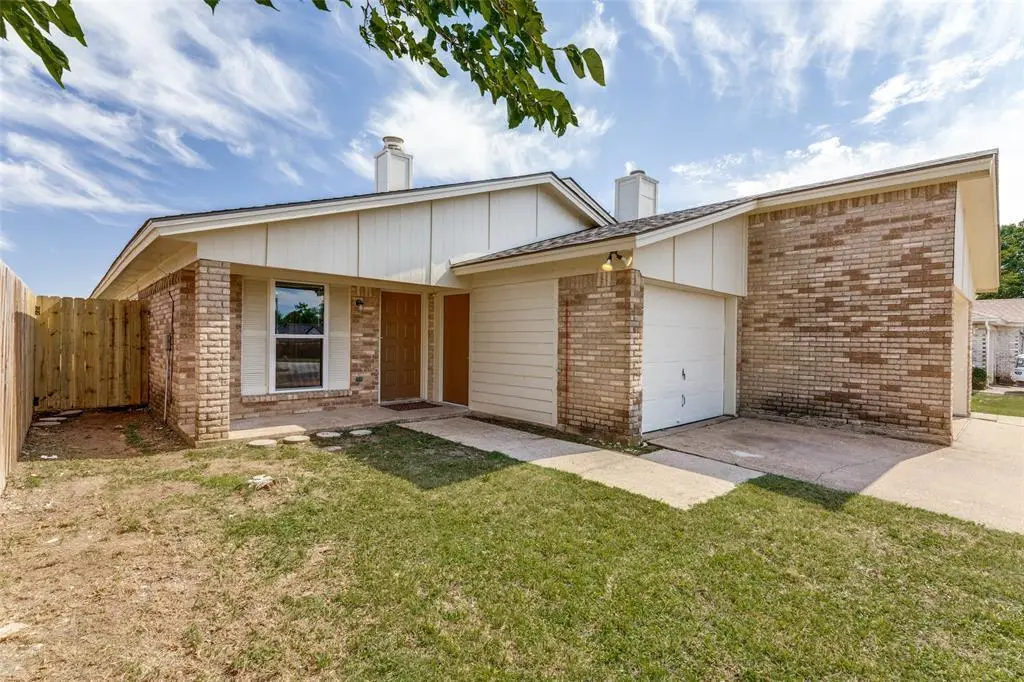
3217 Green Ridge St · Fort Worth, TX
Flood risk 1/10 · Minimal
- FEMA flood zone
- X (unshaded)
- Chance of flooding over 30 yrs
- 0.0%
- Est. flood insurance / yr
- $507 – $1,088
Fire risk 1/10 · Minimal
- Est. fire insurance / yr
- $1,222 – $2,270
Heat risk 7/10 · Major
- Hot days now (above 108°F)
- 7 days/yr
- Hot days in 30 yrs
- 23 days/yr
Wind risk 4/10 · Minor
- Chance of severe wind over 30 yrs
- 24.0%
Air-quality risk 3/10 · Minor
- Unhealthy air days now
- 2 days/yr
- Unhealthy air days in 30 yrs
- 3 days/yr
Risk factors via First Street. Map © Google.
Why this score? — see what drove the C grade
The composite is a weighted blend of 9 inputs, each scored 0–100. Each bar is that input's sub-score; the figure is the points it added to the 100-point composite (weight × sub-score).
- Cash flow +19.3/30.0
- ARV discount +15.0/15.0
- 1% rule +6.8/10.0
- DSCR +6.1/10.0
- Livability +4.0/5.0
- Rent growth +2.5/5.0
- Condition / age +2.5/5.0
- Schools +2.0/10.0
- Appreciation +0.0/10.0
$185,000
🖨 Deal sheet (PDF) 📄 Offer letter ✓ Due diligence
Multi-family units
County records classify this as Multi-Family (2-4 Unit). Listing-text estimate: 1 unit. estimate disagrees with records
Key facts
- 7,057 sq ft lot
- Garage
- Built 1982
Property features AI
Finance
- Other: Lot less than 0.5 acre (approx. 0.162 acres); Subdivision: South Meadow Add; County: Tarrant
- Financial info: Listing eligible for conventional, FHA, FHA-203K, VA, or cash financing
- HOA & community: No homeowners association; Community curbs
Exterior
- Parking: Attached garage (1 car) with garage door opener; Covered parking space; Driveway parking; Additional parking; Garage with epoxy flooring (approx. 10' x 20' x 8')
- Security: Fire alarm; Security lights; Smoke detectors
- Utilities: City water (individual water meter); City sewer; Electricity available and connected; Cable available; Sewer available
- Home design: Single-family residence; One story; Property attached: Yes
- Construction: Brick construction; Composition roof; Slab foundation; Built in 1982 (preowned)
- Exterior features: Wood fencing in back yard; Curbs; All-weather road access
Interior
- Kitchen: Granite counters and natural stone/granite surfaces; Built-in cabinets; Water line to refrigerator; Dishwasher; Disposal; Electric oven and electric range; Utility in kitchen
- Bedrooms: 2 bedrooms (both on main level); Primary bedroom with walk-in closet
- Flooring: Ceramic tile; Laminate
- Bathrooms: 2 full bathrooms
- Heating & cooling: Central heating; Electric heating; Fireplace(s) for supplemental heat; Central air; Ceiling fan(s)
- Interior features: Cathedral and vaulted ceilings; Granite counters; Cable TV available; High-speed internet available; Walk-in closets; Window coverings
- Laundry & utility: Washer and dryer hookups (full-size); Electric dryer hookup; Utility room / laundry area; Washer hookup in kitchen area noted
Neighborhood map
What this means for you Summary
Snapshot
- This is a 4-bed/4.0-bath multifamily listed at $185k.
Deal economics
- At list price, monthly cash flow is $205 ($2k/yr) — positive.
- The deal already cash-flows at list — no discount required.
- Meets the 1% rule at list price ($2k rent vs $185k).
- Recommended offer: $182k (1.5% below list) — sets the bar for market timing.
- Cap rate 7.6% vs local median 3.9% in Fort Worth — top-decile yield for the area; either an underpriced asset or a hidden risk that comps aren't pricing in. Stress-test before assuming the spread holds.
Location & tenants
- Location reads 80/100 on livability (#49 in TX, #1,954 nationally) — a professional / high-income tenant draw. Strengths: amenities A+, cost of living A+, housing A+; Watch: crime F.
- Fort Worth ISD (urban): math 18% / reading 28% proficiency, ranked #742 of 826 in TX (top 90%) — low school quality limits family demand, transient renter base, plan for 1-2y turnover; 73% free/reduced lunch — lower-income household profile, screen leases tightly.
- Zoned schools: Woodway El (math 14% / reading 20%, grade F, #3,836 of 4,322 statewide, top 91%, 494 students, 91% FRL) — zoned schools average 91% FRL vs 73% district-wide (18 pts higher); higher-poverty schools than district average — tighter screening recommended.
- Market conditions: Rents soft (-0.2%/yr); 216 active listings in the ZIP; 40 comparable units currently listed for rent nearby; rentals leasing fast (median 14d on market — plan ~1-2 weeks tenant-placement turnaround); solid renter incomes; 18,938 units permitted in Tarrant County in 2024 (8,336 in 5+ unit buildings).
- This rent runs 35% of the median local income ($76k/yr) — at the standard rent-burdened threshold; future hikes will face affordability resistance.
Forward outlook
- Local home prices are declining (-3.0%/yr); year-one equity from $1k of loan paydown is wiped out by about $6k of value loss. Plan a longer hold.
- Tarrant County population projected at +41% by 2050 — long-run rental-demand tailwind backs the buy-and-hold thesis.
Negotiation context
- It's been on market 19 days — a 2% lower offer ($182k) is reasonable based on typical stale-listing flexibility.
- 2 sale attempts since 2y ago with the ask held roughly flat each time — persistent listings suggest the price (not the market) is what's stuck; bring a comps-based counter.
Risks & watch-outs
- Watch-outs: property tax is 3.1% of price.
- Climate carrying-cost: extreme-heat days projected 7→23/yr by 2055 (HVAC capex compounding) — expect insurance premiums to compound above CPI over the hold.
Questions for the listing agent
- Property tax is high relative to price — has the assessment been appealed recently, and will the sale trigger a re-assessment?
- Is there a deadline driving the sale (1031 exchange, divorce, estate, relocation)? That informs how much negotiation room exists.
- Schools are D-rated, which usually means shorter tenancies and higher turnover. Who's the typical renter profile here, and what's been the actual vacancy rate?
- Crime grade is F in this area — have there been break-ins, vandalism, or insurance claims at this property in the last 3 years? What carrier currently insures it and at what premium?
- What's the average days-on-market for RENTAL listings here right now (not sales)? A rising rental-DOM trend means longer vacancies and softer asking-rent achievability than the comps imply.
- What's the recent tenant-quality profile in this submarket — average credit score on applications, eviction rate, late-payment / NSF rate, and stable-employment percentage? A property-management company in the area should have these aggregated.
- How much new apartment / multifamily construction is in the pipeline within 1–3 miles? Heavy new supply (>2% of stock underway) typically softens rents 12–24 months out; light construction supports rent growth.
Investment metrics
- 1% rule
- 1.18% ✓
- Cap rate
- 7.62%
- Cash-on-cash
- 4.74%
- DSCR
- 1.21
- GRM
- 7.0
CMA / ARV
- ARV (on-the-fly)
- $311,410
- Comps found
- 8
Show comp detail 8 sales within ~0.75 mi
| Address | Dist | Beds/Ba | Sqft | Sold | Price | $/sf | Match |
|---|---|---|---|---|---|---|---|
| 3328-3330 Green Ridge St | 0.12mi | 4/3.0 | 2,128 (+2%) | 7mo | $340,000 | $160 | 81 |
| 3405 S Meadow Dr | 0.20mi | 4/2.0 | 2,042 (-2%) | 16mo | $267,500 | $131 | 66 |
| 3417 S Meadow Dr | 0.22mi | 4/2.0 | 2,042 (-2%) | 20mo | $279,900 | $137 | 61 |
| 6701 Glenbrook Ln | 0.64mi | 4/4.0 | 2,124 (+2%) | 16mo | $339,000 | $160 | 54 |
| 6857 S Creek Dr | 0.51mi | 4/2.0 | 2,000 (-4%) | 13mo | $285,000 | $143 | 51 |
| 6743 Westcreek Dr | 0.57mi | 4/2.0 | 2,018 (-3%) | 11mo | $299,997 | $149 | 51 |
| 2735-2737 Countryside Ln | 0.65mi | 4/4.0 | 2,310 (+10%) | 17mo | $344,700 | $149 | 38 |
| 6649 S Creek Dr | 0.73mi | 5/4.0 (+1) | 2,180 (+4%) | 24mo | $372,500 | $171 | 34 |
Match score weights: distance 35% · size 25% · config 20% · recency 20%. Top-matched comps best support the ARV.
Projected returns pro-forma
-3.0% appreciation · 0.0% rent growth · sell at horizon
- IRR
- -12.8%
- Equity multiple
- 0.55×
- Total profit
- $-23,175
- Equity at exit
- $27,584
- IRR
- -10.3%
- Equity multiple
- 0.47×
- Total profit
- $-27,460
- Equity at exit
- $15,995
Cash invested: $51,800 (down + closing). Projections, not guarantees.
Landlord ↔ Tenant lean methodology
- Overall (STATE)
- 87 Strongly Landlord-Friendly
- State Texas
- 87 Strongly Landlord-Friendly · R+5
- County
- — inherits STATE
- City
- — inherits STATE
ZIP-level market 76133
- Rents YoY
- -0.2%
- Active inventory
- 216
- Price-to-rent
- 7.0×
Monthly cashflow live
- Estimated rent
- $2,192 high interval (Pro) →
- Mortgage (P&I)
- −$970
- Tax from tax record
- −$480 /mo · $5,757/yr
- Insurance
- −$77
- HOA
- −$0
- Vacancy / Maint / Mgmt
- −$460
- Net cashflow
- $205
Break-even live
Sensitivity live
| Price | -10% $309 | -5% $257 | +0% $205 | +5% $152 | +10% $100 |
|---|---|---|---|---|---|
| Rent | -10% $32 | -5% $118 | +0% $205 | +5% $291 | +10% $378 |
| Rate | -1.0pp $298 | -0.5pp $252 | base $205 | +0.5pp $157 | +1.0pp $108 |
UW: 25.0% down · 7.5% · 30yr · 1.5% tax · 5.0% vac · 8.0% maint · 8.0% mgmt
Financing live
Cash to close
- Down payment
- $46,250
- Closing costs
- $5,550
- Reserves months
- —
- Total cash needed
- —
Loan-product check · same deal, 3 products live
Conventional
25% down · 7.5% · 30yr
- Down + closing
- —
- Monthly P&I
- —
- Monthly cashflow
- —
- DSCR
- —
- Eligible?
- —
Personal DTI + credit; lowest rate.
DSCR
20% down · 8.5% · 30yr
- Down + closing
- —
- Monthly P&I
- —
- Monthly cashflow
- —
- DSCR
- —
- Eligible?
- —
No personal income docs; deal must DSCR.
Hard money
10% down · 12.0% · 12mo
- Down + closing
- —
- Monthly P&I
- —
- Monthly cashflow
- —
- DSCR
- —
- Eligible?
- —
Short-term bridge; refi at stabilization.
Rent comps 40 comps
| Address | Beds | Baths | Sqft | Rent | $/sqft | DOM | Units | Dist |
|---|---|---|---|---|---|---|---|---|
| 7421 Ridge Rd W Fort Worth, TX | 3.0 | 2.0 | 1480 | $1,839 | $1.24 | 4d | 1 | 0.29mi |
| 3104 Woodlark Dr Fort Worth, TX | 4.0 | 2.5 | 2565 | $2,350 | $0.92 | 44d | 1 | 0.35mi |
| 2917 Joymeadow Dr Fort Worth, TX | 4.0 | 2.5 | 2253 | $2,210 | $0.98 | 21d | 1 | 0.36mi |
| 7501 Meadow Creek Dr Fort Worth, TX | 4.0 | 2.5 | 2167 | $2,295 | $1.06 | 6d | 1 | 0.36mi |
| 2905 Joymeadow Dr Fort Worth, TX | 4.0 | 2.5 | 2272 | $2,200 | $0.97 | 6d | 1 | 0.38mi |
| 7504 Trotter Ct Fort Worth, TX | 3.0 | 2.5 | 2440 | $2,199 | $0.90 | 3d | 1 | 0.38mi |
| 6824 Loma Vista Dr Fort Worth, TX | 3.0 | 2.0 | 1540 | $1,980 | $1.29 | 44d | 1 | 0.39mi |
| 3308 Clovermeadow Dr Fort Worth, TX | 3.0 | 2.0 | 1798 | $1,900 | $1.06 | 25d | 1 | 0.41mi |
| 6920 Misty Meadow Dr S Fort Worth, TX | 3.0 | 2.0 | 1443 | $1,775 | $1.23 | 44d | 1 | 0.41mi |
| 7320 Laurelhill Ct S Fort Worth, TX | 3.0 | 2.0 | 1480 | $1,905 | $1.29 | 3d | 1 | 0.42mi |
| 7208 Southridge Trl Fort Worth, TX | 3.0 | 2.0 | 1506 | $1,950 | $1.29 | 3d | 1 | 0.48mi |
| 3416 Forest Creek Dr Fort Worth, TX | 3.0 | 2.0 | 1400 | $1,895 | $1.35 | 25d | 1 | 0.49mi |
| 7148 Misty Meadow Dr S Fort Worth, TX | 3.0 | 2.0 | 1480 | $1,795 | $1.21 | 4d | 1 | 0.52mi |
| 6838 S Creek Dr Fort Worth, TX | 3.0 | 2.0 | 1400 | $1,395 | $1.00 | 4d | 1 | 0.55mi |
| 2729 Forest Creek Dr Fort Worth, TX | 3.0 | 2.5 | 2333 | $2,350 | $1.01 | 3d | 1 | 0.56mi |
| 7294 Church Park Dr Fort Worth, TX | 3.0 | 2.0 | 1618 | $2,000 | $1.24 | 25d | 1 | 0.57mi |
| 2701 Clovermeadow Dr Fort Worth, TX | 4.0 | 2.5 | 2225 | $2,500 | $1.12 | 3d | 1 | 0.58mi |
| 3309 Creekwood Ln Fort Worth, TX | 4.0 | 2.0 | 1748 | $2,060 | $1.18 | 3d | 1 | 0.59mi |
| 7221 Misty Meadow Dr S Fort Worth, TX | 3.0 | 2.0 | 1584 | $1,795 | $1.13 | 6d | 1 | 0.60mi |
| 7221 W Cleburne Rd Fort Worth, TX | 3.0 | 2.0 | 1623 | $1,795 | $1.11 | 25d | 1 | 0.64mi |
| 7329 Southridge Trl Fort Worth, TX | 3.0 | 2.0 | 1529 | $2,200 | $1.44 | 44d | 1 | 0.65mi |
| 2520 Clovermeadow Dr Fort Worth, TX | 3.0 | 2.0 | 1567 | $2,029 | $1.29 | 6d | 1 | 0.67mi |
| 7617 Hollow Forest Dr Fort Worth, TX | 3.0 | 2.0 | 1400 | $1,900 | $1.36 | 4d | 1 | 0.72mi |
| 3921 Teaberry Ln Fort Worth, TX | 4.0 | 2.0 | 1548 | $2,200 | $1.42 | 4d | 1 | 0.73mi |
| 7616 Rainbow Creek Dr Fort Worth, TX | 3.0 | 2.0 | 1400 | $1,855 | $1.32 | 44d | 1 | 0.74mi |
| 3965 Singleleaf Ln Fort Worth, TX | 3.0 | 2.0 | 2343 | $2,500 | $1.07 | 7d | 1 | 0.79mi |
| 3288 Raleigh Dr Fort Worth, TX | 5.0 | 2.5 | 2443 | $2,395 | $0.98 | 20d | 1 | 0.80mi |
| 2508 Creekwood Ln Fort Worth, TX | 3.0 | 2.5 | 1867 | $2,145 | $1.15 | 6d | 1 | 0.81mi |
| 2616 Harvest Moon Dr Fort Worth, TX | 3.0 | 2.0 | 1436 | $2,350 | $1.64 | 3d | 1 | 0.82mi |
| 7664 Hollow Point Dr Fort Worth, TX | 3.0 | 2.0 | 1400 | $1,895 | $1.35 | 25d | 1 | 0.84mi |
| 7609 Xavier Dr Fort Worth, TX | 4.0 | 2.5 | 2239 | $2,060 | $0.92 | 23d | 1 | 0.85mi |
| 3905 Seven Gables St Fort Worth, TX | 3.0 | 2.0 | 1864 | $1,700 | $0.91 | 44d | 1 | 0.87mi |
| 3809 Bee Tree Ln Fort Worth, TX | 3.0 | 2.0 | 1458 | $1,855 | $1.27 | 16d | 1 | 0.88mi |
| 3704 Fairhaven Dr Fort Worth, TX | 3.0 | 2.0 | 1528 | $1,995 | $1.31 | 13d | 1 | 0.89mi |
| 3704 Fairhaven Dr Fort Worth, TX | 3.0 | 2.0 | 1528 | $1,995 | $1.31 | 44d | 1 | 0.89mi |
| 7741 Galemeadow Ct Fort Worth, TX | 3.0 | 2.0 | 1400 | $1,870 | $1.34 | 21d | 1 | 0.91mi |
| 6416 Brookhaven Trl Fort Worth, TX | 3.0 | 2.0 | 1529 | $1,999 | $1.31 | 12d | 1 | 0.96mi |
| 2436 Dahlia Dr Fort Worth, TX | 4.0 | 3.0 | 2285 | $2,349 | $1.03 | 6d | 1 | 0.97mi |
| 6417 Canyon Cir Fort Worth, TX | 3.0 | 2.0 | 1582 | $2,300 | $1.45 | 19d | 1 | 0.99mi |
| 6417 Canyon Cir Fort Worth, TX | 3.0 | 2.0 | 1582 | $2,300 | $1.45 | 16d | 1 | 0.99mi |
Listing history 14 events
-
2026-06-13statusdays on market $185,000 Pending 19 DOM
-
2026-06-09days on market $185,000 Active Option Contract 15 DOM
-
2026-06-08days on market $185,000 Active Option Contract 14 DOM
-
2026-06-07statusdays on market $185,000 Active Option Contract 13 DOM
-
2026-06-04days on market $185,000 Active 10 DOM
-
2026-06-03days on market $185,000 Active 9 DOM
-
2026-06-02days on market $185,000 Active 8 DOM
-
2026-06-01days on market $185,000 Active 7 DOM
-
2026-05-31days on market $185,000 Active 6 DOM
-
2026-05-25$185,000 Active
-
2024-03-07historical $1,575
-
2024-02-19$1,575
-
2022-09-01soldstatus
-
2022-08-31soldstatus
ⓘ Source: listings_history table (triggers on properties + properties_extension) + one-shot
backfill from property_details.listing_events for pre-trigger history.
Tax reassessment forecast TX · Resets to sale price
- Current annual tax
- $5,757 · $480/mo
- Projected year-2 tax
- $5,757 · $480/mo
- Expected delta
- $0/yr ($0/mo · 0.0%)
ⓘ Screening estimate from a state-policy table — verify with the county assessor before closing.
Climate risk First Street
- Flood 1/10 Low FEMA zone X (unshaded) · 0% chance over 30 yrs
- Wildfire 1/10 Low
- Heat 7/10 Severe 7 d/yr ≥108°F today · 23 d/yr by 30 yrs out
- Wind 4/10 Moderate 24% chance of damaging wind over 30 yrs
- Air quality 3/10 Moderate 2 unhealthy d/yr today · 3 by 30 yrs out
Nearby sold comps map
Loading sold comps map…
Walkable amenities ~0.75 mi
Loading nearby amenities…
Taxation est. · year 1
- Rental income
- $26,305
- − Mortgage interest
- −$10,363
- − Property taxes
- −$5,757
- − Insurance
- −$925
- − Repairs & maintenance
- −$2,104
- − Management
- −$2,104
- − Depreciation
- −$5,382
- Taxable loss
- −$330
- Est. tax savings @ 24.0%
- +$79
- After-tax cash flow
- $2,536/yr
For passive investors: Depreciation is non-cash, so a rental often shows a tax loss while cash-flowing — sheltering income. Rental losses are passive: they offset passive income freely, and up to $25,000/yr can offset ordinary (W-2) income if you actively participate and your MAGI is under $100k (phasing out to $0 by $150k); unused losses carry forward. On sale, claimed depreciation is recaptured at up to 25%, and gains may owe capital-gains tax (a 1031 exchange can defer both). Figures are a year-1 estimate at your 24.0% rate — not tax advice; consult a CPA.
Schools (NCES district)
- District
- Fort Worth ISD
- NCES district ID
- 4819700
- Math proficiency
- 18% ▼ -16.00%
- Reading proficiency
- 28% ▼ -6.00%
- Median HH income
- $42,109
- Composite
- 19.61/100
- National rank
- #8753
- State rank
- #742 of 826 in TX
Livability — Fort Worth
- Score
- 80/100
- State rank
- #49
- US rank
- #1954
Category grades
Schools grade is shown separately in the Schools card above.
Census & demographics
- Census place
- Fort Worth, TX
- County
- Tarrant County · 2,033,669 people
- City population
- 911,619
- Metro
- Dallas-Fort Worth-Arlington, TX
- Population (ZIP)
- 53,958
- Household income
- $75,523
- Rent vs Own
- Severe rent burden
- 2000.0
Population outlook (Tarrant County) Hauer SSP2
- Today (2025)
- 2,380,417 people
- By 2030
- 2,578,900 · +8.3%
- By 2040
- 2,974,995 · +25.0%
- By 2050
- 3,350,489 · +40.8%
- By 2075
- 4,216,909 · +77.2%
- By 2100
- 4,741,527 · +99.2%
Race, ethnicity, and origin ACS 2023
- Neighborhood character
- Diverse neighborhood (Simpson 0.69)
- Race & ethnicity
- Hispanic / Latino 39% White 34% Black 21% Two or more races 19% Asian 3% Native American 1%
- Hispanic origin (detail)
- Mexican 34%
- Common ancestry
- Italian 3% Slovak 2% Lithuanian 1%
- Foreign-born
- 15% · Canada, China, Philippines
- Languages at home
- 70% English-only · Spanish 25% Other Asian/Pacific 1% French/Haitian/Cajun 1%
Political lean MEDSL · Tarrant
- 2024 margin
- Lean R (+5.1) · D 46.7% · R 51.9% · Other 1.4%
- 2008→2024 swing
- +6.6pp toward D · 2008: -11.7pp · 2024: -5.1pp
- All cycles
- 2024: R+5.1 2020: D+0.2 2016: R+8.7 2012: R+15.7 2008: R+11.7
Not yet ingested
- Civics
- —
Market trends
- HPI YoY
- ▼ -196.95%
- Current HPI
- 293.8679
- Rent YoY
- ▼ -0.20%
- Metro
- Dallas-Fort Worth-Arlington, TX
- State GDP YoY
- ▲ 3.95%
- F500 in state
- 110
Industry mix (Fortune 500 HQ in TX)
| Industry | F500 HQs | Revenue |
|---|---|---|
| Energy | 16 | $1,198B |
|
||
| Technology | 5 | $198B |
|
||
| Engineering / Construction | 4 | $72B |
|
||
| Energy Services | 3 | $60B |
|
||
| Utilities | 3 | $41B |
|
||
| Healthcare | 2 | $330B |
|
||
Price history
+11646.0% since first listed5 events — show timeline
- 2026-05-25 Listed $185,000 NTREIS
- 2024-03-07 Rental Removed $1,575 NTREIS
- 2024-02-19 Listed for Rent $1,575 NTREIS
- 2022-09-01 Sold (Public Records) — Public Records
- 2022-08-31 Sold (Public Records) — Public Records
Property tax history
+6.9%/yrLatest (2025): $5,757 · -4.9% YoY. Source: county tax records.
Cash-flow waterfall
monthlySold comps — $/sqft
last 12 mo · ≤1 miLoading sold comps…