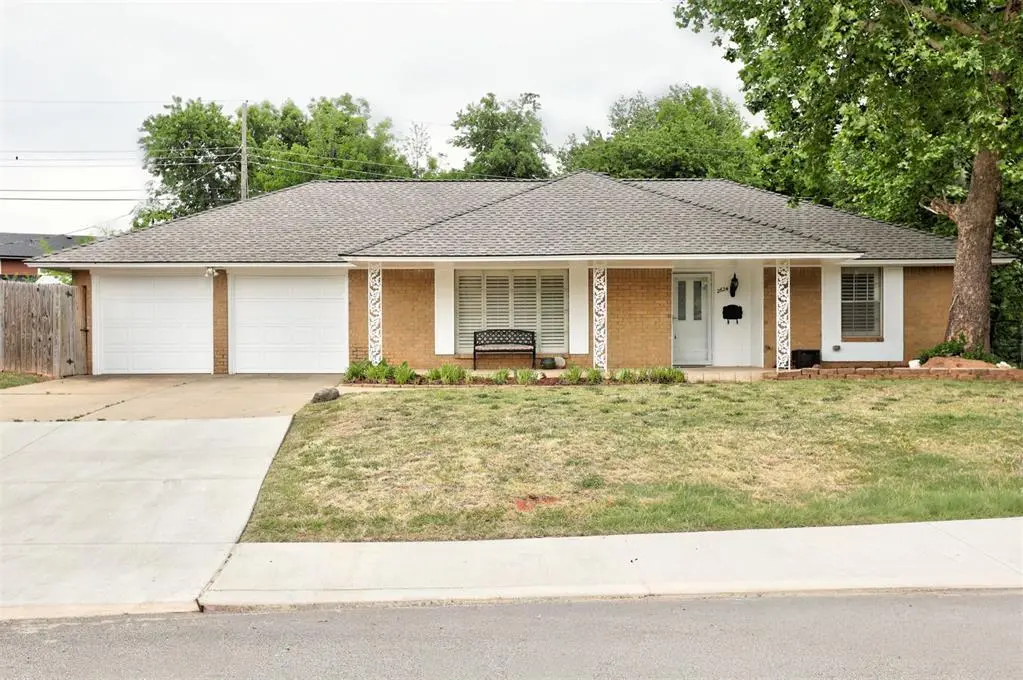
2624 NW 113th St · Oklahoma City, OK
Flood risk 1/10 · Minimal
- FEMA flood zone
- X (unshaded)
- Chance of flooding over 30 yrs
- 0.0%
- Est. flood insurance / yr
- $507 – $1,088
Fire risk 1/10 · Minimal
- Est. fire insurance / yr
- $2,463 – $4,575
Heat risk 6/10 · Moderate
- Hot days now (above 107°F)
- 7 days/yr
- Hot days in 30 yrs
- 19 days/yr
Wind risk 2/10 · Minimal
- Chance of severe wind over 30 yrs
- 2.0%
Air-quality risk 2/10 · Minimal
- Unhealthy air days now
- 1 days/yr
- Unhealthy air days in 30 yrs
- 1 days/yr
Risk factors via First Street. Map © Google.
Why this score? — see what drove the D grade
The composite is a weighted blend of 9 inputs, each scored 0–100. Each bar is that input's sub-score; the figure is the points it added to the 100-point composite (weight × sub-score).
- ARV discount +15.0/15.0
- Cash flow +10.7/30.0
- Livability +4.0/5.0
- DSCR +3.1/10.0
- Rent growth +3.0/5.0
- 1% rule +2.6/10.0
- Condition / age +2.5/5.0
- Schools +0.7/10.0
- Appreciation +0.0/10.0
$220,000
🖨 Deal sheet 📄 Offer letter ✓ Due diligence
Listing remarks MLS
A VERY NICE HOUSE, IN A VERY NICE NEIGHBORHOOD. PLANTATION SHUTTER THROUGHOUT. SPACIOUS ROOMS. GREAT CURB APPEAL. EXCEPTIONAL CABINETRY IN KITCHEN. CLOSE TO EVERYTHING HAPPENING IN OKC.
Key facts
- Fresh paint
- Spacious backyard
- Updated flooring
Tags
Property features AI
Finance
- Other: Lot size approximately 0.2322 acres; Located in the Stonegate addition; Directions: 122nd and May, south to 112th, east to Miller, north to 113th
- Financial info: Assumable: No; Loan qualification: Yes; Current tax amount listed (financial specifics not included per instructions)
- HOA & community: No mandatory association dues
Exterior
- Parking: 2-car garage
- Security: No storm shelter
- Utilities: No utility details provided
- Home design: Single-family residence; One story; Residential property; Existing construction
- Construction: Brick construction; Composition roof (roof year 2026); Slab foundation
- Exterior features: Covered porch; Open patio; Porch; Outbuildings; Workshop; Rain gutters; Wood fencing; Interior lot
Interior
- Kitchen: No appliance details provided
- Bedrooms: 3 bedrooms (all on one level)
- Flooring: No flooring details provided
- Bathrooms: 2 full bathrooms
- Heating & cooling: No heating or cooling details provided
- Interior features: Masonry fireplace; No in-law plan indicated
- Laundry & utility: No laundry details provided
Neighborhood map
What this means for you Summary
Snapshot
- This is a 3-bed/2.0-bath single-family listed at $220k.
Deal economics
- At list price, monthly cash flow is $-106 ($-1k/yr) — negative.
- To cash-flow at today's rent, offer at most $201k (8.5% below list).
- To meet the 1% rule (rent ≥ 1% of price), the offer needs to be $166k (24.3% below list).
- Recommended offer: $166k (24.3% below list) — sets the bar for 1% rule.
- Cap rate 5.7% vs local median 3.7% in Oklahoma City — top-decile yield for the area; either an underpriced asset or a hidden risk that comps aren't pricing in. Stress-test before assuming the spread holds.
Location & tenants
- Location reads 80/100 on livability (#3 in OK, #1,635 nationally) — a professional / high-income tenant draw. Strengths: amenities A+, commute A+, cost of living A+; Watch: crime F.
- Oklahoma City (urban): math 7% / reading 10% proficiency, ranked #254 of 270 in OK (top 94%) — low school quality limits family demand, transient renter base, plan for 1-2y turnover; 82% free/reduced lunch — lower-income household profile, screen leases tightly.
- Zoned schools: Quail Creek Es (math 17% / reading 17%, grade F, #540 of 845 statewide, top 68%, 543 students, 0% FRL); John Marshall Hs (math 2% / reading 8%, grade F, #430 of 447 statewide, top 99%, 829 students, 0% FRL) — zoned schools average 0% FRL vs 82% district-wide (82 pts lower); this property's tenant base skews higher-income than the district average.
- Market conditions: Rents rising (+2.0%/yr); 333 active listings in the ZIP; 40 comparable units currently listed for rent nearby; rentals at typical pace (median 24d on market — plan ~3-4 weeks tenant-placement turnaround); 5,365 units permitted in Oklahoma County in 2024 (569 in 5+ unit buildings).
- This rent runs 31% of the median local income ($65k/yr) — at the standard rent-burdened threshold; future hikes will face affordability resistance.
Forward outlook
- Local home prices are declining (-3.0%/yr); year-one equity from $2k of loan paydown is wiped out by about $7k of value loss. Plan a longer hold.
- Oklahoma County population projected at +41% by 2050 — long-run rental-demand tailwind backs the buy-and-hold thesis.
Negotiation context
- Only 4 days on market — expect competitive offers; lowballing is unlikely to land.
- 2 sale attempts since 10y ago with the ask held roughly flat each time — persistent listings suggest the price (not the market) is what's stuck; bring a comps-based counter.
Risks & watch-outs
- Climate carrying-cost: extreme-heat days projected 7→19/yr by 2055 (HVAC capex compounding) — expect insurance premiums to compound above CPI over the hold.
Questions for the listing agent
- What do current leases actually rent for vs. the listed asking? Can we see a recent rent roll and the last 12 months of T-12 income?
- Built in 1964 — when were the roof, HVAC, electrical panel, plumbing, and water heater last replaced?
- Is there a deadline driving the sale (1031 exchange, divorce, estate, relocation)? That informs how much negotiation room exists.
- Schools are F-rated, which usually means shorter tenancies and higher turnover. Who's the typical renter profile here, and what's been the actual vacancy rate?
- Crime grade is F in this area — have there been break-ins, vandalism, or insurance claims at this property in the last 3 years? What carrier currently insures it and at what premium?
- The area grade is low — what's the realistic commute time and amenity access for the typical tenant pool here? Any planned neighborhood developments (good or bad) we should know about?
- What's the average days-on-market for RENTAL listings here right now (not sales)? A rising rental-DOM trend means longer vacancies and softer asking-rent achievability than the comps imply.
- What's the recent tenant-quality profile in this submarket — average credit score on applications, eviction rate, late-payment / NSF rate, and stable-employment percentage? A property-management company in the area should have these aggregated.
- How much new for-sale + rental construction is in the pipeline within 1–3 miles? Heavy new supply typically softens prices + rents 12–24 months out; constrained supply supports both.
Investment metrics
- 1% rule
- 0.76% ✗
- Cap rate
- 5.72%
- Cash-on-cash
- -2.06%
- DSCR
- 0.91
- GRM
- 11.0
CMA / ARV
- ARV (median comp)
- $265,243
- List price
- $220,000
- Delta
- -17.06%
- Verdict
- UNDERPRICED
- Comps
- 20 within 1.0 mi
Show comp detail 12 sales within ~0.75 mi
| Address | Dist | Beds/Ba | Sqft | Sold | Price | $/sf | Match |
|---|---|---|---|---|---|---|---|
| 2624 NW 113th St | 0.00mi | 3/2.0 | 1,612 (0%) | 0mo | $220,000 | $136 | 100 |
| 2704 NW 110th St | 0.20mi | 3/2.0 | 1,638 (+2%) | 2mo | $162,500 | $99 | 87 |
| 2524 NW 116th St | 0.28mi | 3/2.0 | 1,593 (-1%) | 3mo | $215,000 | $135 | 83 |
| 11012 Greystone Ave | 0.35mi | 3/2.0 | 1,630 (+1%) | 4mo | $215,000 | $132 | 78 |
| 10820 N Victoria Pl | 0.41mi | 4/2.0 (+1) | 1,627 (+1%) | 4mo | $302,000 | $186 | 71 |
| 2225 NW 114th St | 0.57mi | 3/2.0 | 1,583 (-2%) | 4mo | $250,000 | $158 | 68 |
| 2455 Manchester Dr #37 | 0.67mi | 3/2.0 | 1,605 (-0%) | 2mo | $250,000 | $156 | 66 |
| 2509 NW 111th St | 0.25mi | 4/2.0 (+1) | 1,746 (+8%) | 4mo | $270,000 | $155 | 66 |
| 2401 NW 111th St | 0.45mi | 3/2.0 | 1,742 (+8%) | 4mo | $220,000 | $126 | 63 |
| 2509 Cedar Park Dr | 0.71mi | 3/2.0 | 1,699 (+5%) | 3mo | $235,000 | $138 | 55 |
| 2704 NW 120th Ter | 0.51mi | 3/2.0 | 1,821 (+13%) | 1mo | $290,000 | $159 | 54 |
| 2232 NW 113th St | 0.53mi | 3/2.0 | 1,418 (-12%) | 4mo | $225,000 | $159 | 52 |
Match score weights: distance 35% · size 25% · config 20% · recency 20%. Top-matched comps best support the ARV.
Projected returns pro-forma
-3.0% appreciation · 2.05% rent growth · sell at horizon
- IRR
- -20.7%
- Equity multiple
- 0.29×
- Total profit
- $-43,982
- Equity at exit
- $32,803
- IRR
- -16.2%
- Equity multiple
- 0.13×
- Total profit
- $-53,445
- Equity at exit
- $19,022
Cash invested: $61,600 (down + closing). Projections, not guarantees.
Landlord ↔ Tenant lean methodology
- Overall (STATE)
- 83 Strongly Landlord-Friendly
- State Oklahoma
- 83 Strongly Landlord-Friendly · R+20
- County
- — inherits STATE
- City
- — inherits STATE
ZIP-level market 73120
- Rents YoY
- 2.0%
- Active inventory
- 333
- Price-to-rent
- 11.0×
Monthly cashflow live
- Estimated rent
- $1,665 high interval (Pro) →
- Mortgage (P&I)
- −$1,154
- Tax from tax record
- −$175 /mo · $2,103/yr
- Insurance
- −$92
- HOA
- −$0
- Vacancy / Maint / Mgmt
- −$350
- Net cashflow
- $-106
Break-even live
UW: 25.0% down · 7.5% · 30yr · 1.5% tax · 5.0% vac · 8.0% maint · 8.0% mgmt
Financing live
Cash to close
- Down payment
- $55,000
- Closing costs
- $6,600
- Reserves months
- —
- Total cash needed
- —
Loan-product check · same deal, 3 products live
Conventional
25% down · 7.5% · 30yr
- Down + closing
- —
- Monthly P&I
- —
- Monthly cashflow
- —
- DSCR
- —
- Eligible?
- —
Personal DTI + credit; lowest rate.
DSCR
20% down · 8.5% · 30yr
- Down + closing
- —
- Monthly P&I
- —
- Monthly cashflow
- —
- DSCR
- —
- Eligible?
- —
No personal income docs; deal must DSCR.
Hard money
10% down · 12.0% · 12mo
- Down + closing
- —
- Monthly P&I
- —
- Monthly cashflow
- —
- DSCR
- —
- Eligible?
- —
Short-term bridge; refi at stabilization.
Rent comps 40 comps
| Address | Beds | Baths | Sqft | Rent | $/sqft | DOM | Units | Dist |
|---|---|---|---|---|---|---|---|---|
| 11004 N May Ave Oklahoma City, OK | 1.0–2.0 | 1.0–2.5 | 1129 | $1,170 | $1.04 | 11d | 1 | 0.23mi |
| 11407 N May Ave Oklahoma City, OK | 3.0 | 3.0 | 1613 | $1,450 | $0.90 | 43d | 1 | 0.27mi |
| 11417 N May Ave Unit D Oklahoma City, OK | 3.0 | 2.0 | 1275 | $1,345 | $1.05 | 2d | 1 | 0.29mi |
| 2532 NW 116th St Oklahoma City, OK | 4.0 | 2.0 | 1860 | $2,805 | $1.51 | 23d | 1 | 0.30mi |
| 10904 N Linn Ave Oklahoma City, OK | 3.0 | 2.0 | 1452 | $1,650 | $1.14 | 43d | 1 | 0.31mi |
| 2529 NW 116th St Oklahoma City, OK | 3.0 | 2.0 | 1625 | $1,650 | $1.02 | 43d | 1 | 0.32mi |
| 11007 Greystone Ave Oklahoma City, OK | 2.0 | 2.0 | 1269 | $1,500 | $1.18 | 3d | 1 | 0.32mi |
| 2737 Plymouth Ln Oklahoma City, OK | 3.0 | 1.5 | 1372 | $1,395 | $1.02 | 43d | 1 | 0.55mi |
| 12109 Camelot Dr Oklahoma City, OK | 4.0 | 2.5 | 2033 | $1,825 | $0.90 | 23d | 1 | 0.56mi |
| 10412 Major Ave Oklahoma City, OK | 3.0 | 2.0 | 1286 | $1,750 | $1.36 | 43d | 1 | 0.65mi |
| 2221 NW 117th St Oklahoma City, OK | 3.0 | 2.5 | 1627 | $1,625 | $1.00 | 2d | 1 | 0.67mi |
| 12305 Cedar Springs Ln Oklahoma City, OK | 2.0 | 2.5 | 1472 | $1,250 | $0.85 | 43d | 1 | 0.78mi |
| 3108 Orlando Rd Oklahoma City, OK | 4.0 | 2.0 | 1851 | $1,900 | $1.03 | 1d | 1 | 0.79mi |
| 2700 Indian Creek Blvd Oklahoma City, OK | 1.0–3.0 | 1.0–2.0 | 1261 | $1,549 | $1.23 | 2d | 5 | 0.80mi |
| 2126 NW 118th St Oklahoma City, OK | 2.0 | 2.5 | 1360 | $1,445 | $1.06 | 23d | 1 | 0.80mi |
| 12323 Cedar Springs Ln Oklahoma City, OK | 3.0 | 2.5 | 1524 | $1,500 | $0.98 | 43d | 1 | 0.81mi |
| 12136 Thorn Ridge Rd Oklahoma City, OK | 4.0 | 3.0 | 2188 | $2,600 | $1.19 | 43d | 1 | 0.83mi |
| 11141 Springhollow Rd Oklahoma City, OK | 3.0 | 2.0 | 1330 | $1,499 | $1.13 | 23d | 1 | 0.87mi |
| 11141 Springhollow Rd Unit 251 Oklahoma City, OK | 3.0 | 2.0 | 1330 | $1,499 | $1.13 | 21d | 1 | 0.88mi |
| 11141 Springhollow Rd Unit 208 Oklahoma City, OK | 2.0 | 2.0 | 1088 | $1,125 | $1.03 | 43d | 1 | 0.88mi |
| 2841 Indian Creek Blvd Oklahoma City, OK | 2.0 | 2.0 | 1129 | $1,100 | $0.97 | 15d | 1 | 0.94mi |
| 2841 Indian Creek Blvd Oklahoma City, OK | 2.0 | 2.0 | 1129 | $1,100 | $0.97 | 23d | 1 | 0.94mi |
| 2611 Silvertree Dr Oklahoma City, OK | 3.0 | 2.0 | 1500 | $1,550 | $1.03 | 43d | 1 | 0.94mi |
| 9913 Sunnymeade Pl Oklahoma City, OK | 3.0 | 1.5 | 1284 | $1,695 | $1.32 | 23d | 1 | 0.96mi |
| 10237 Hawthorn Dr Oklahoma City, OK | 3.0 | 2.0 | 1884 | $1,875 | $1.00 | 23d | 1 | 0.97mi |
| 9909 Sunnymeade Pl Oklahoma City, OK | 3.0 | 2.0 | 1325 | $1,695 | $1.28 | 1d | 1 | 0.97mi |
| 2632 Kings Way Oklahoma City, OK | 3.0 | 1.5 | 1496 | $1,600 | $1.07 | 43d | 1 | 0.98mi |
| 1800 NW 115th St Oklahoma City, OK | 1.0–3.0 | 1.0–2.0 | 1019 | $2,050 | $2.01 | 2d | 8 | 1.10mi |
| 2501 Patti Pl Oklahoma City, OK | 3.0 | 2.0 | 1377 | $1,600 | $1.16 | 43d | 1 | 1.12mi |
| 10125 N Pennsylvania Ave The Village, OK | 2.0 | 3.0 | 1680 | $1,295 | $0.77 | 43d | 1 | 1.14mi |
| 2608 Crescent Ave Oklahoma City, OK | 3.0 | 2.5 | 1600 | $2,345 | $1.47 | 21d | 1 | 1.18mi |
| 11308 Bel Air Pl Oklahoma City, OK | 3.0 | 2.0 | 1590 | $1,695 | $1.07 | 43d | 1 | 1.19mi |
| 2000 Lanesboro Dr Oklahoma City, OK | 3.0 | 2.0 | 1236 | $1,550 | $1.25 | 43d | 1 | 1.19mi |
| 2610 Crescent Ave Oklahoma City, OK | 3.0 | 2.5 | 1387 | $2,125 | $1.53 | 21d | 1 | 1.19mi |
| 12831 Stratford Dr Oklahoma City, OK | 1.0–3.0 | 1.0–2.0 | 1122 | $3,736 | $3.33 | 1d | 22 | 1.21mi |
| 2533 NW 129th St Oklahoma City, OK | 3.0 | 2.0 | 1500 | $2,200 | $1.47 | 23d | 1 | 1.24mi |
| 2533 NW 129th St Oklahoma City, OK | 3.0 | 2.5 | 1497 | $2,200 | $1.47 | 3d | 1 | 1.24mi |
| 2544 NW 130th St Oklahoma City, OK | 4.0 | 3.0 | 1950 | $2,499 | $1.28 | 3d | 1 | 1.25mi |
| 2608 Abbey Rd Oklahoma City, OK | 3.0 | 2.0 | 1737 | $1,800 | $1.04 | 2d | 1 | 1.26mi |
| 12701 N Pennsylvania Ave Oklahoma City, OK | 3.0 | 1.0–2.0 | 912 | $1,595 | $1.75 | 1d | 15 | 1.27mi |
Listing history 6 events
-
2026-05-09status Pending 744-char remark
-
2026-05-05$220,000 Active 744-char remark
-
2016-12-20soldstatus $123,000
-
2016-12-14soldstatus $123,000 Sold 187-char remark
Show marketing remark (187 chars)
A VERY NICE HOUSE, IN A VERY NICE NEIGHBORHOOD. PLANTATION SHUTTER THROUGHOUT. SPACIOUS ROOMS. GREAT CURB APPEAL. EXCEPTIONAL CABINETRY IN KITCHEN. CLOSE TO EVERYTHING HAPPENING IN OKC.
-
2016-11-13status Pending 187-char remark
Show marketing remark (187 chars)
A VERY NICE HOUSE, IN A VERY NICE NEIGHBORHOOD. PLANTATION SHUTTER THROUGHOUT. SPACIOUS ROOMS. GREAT CURB APPEAL. EXCEPTIONAL CABINETRY IN KITCHEN. CLOSE TO EVERYTHING HAPPENING IN OKC.
-
2016-11-03$127,900 Active 187-char remark
Show marketing remark (187 chars)
A VERY NICE HOUSE, IN A VERY NICE NEIGHBORHOOD. PLANTATION SHUTTER THROUGHOUT. SPACIOUS ROOMS. GREAT CURB APPEAL. EXCEPTIONAL CABINETRY IN KITCHEN. CLOSE TO EVERYTHING HAPPENING IN OKC.
ⓘ Source: listings_history table (triggers on properties + properties_extension) + one-shot
backfill from property_details.listing_events for pre-trigger history.
Tax reassessment forecast OK · Resets to sale price
- Current annual tax
- $2,103 · $175/mo
- Projected year-2 tax
- $2,103 · $175/mo
- Expected delta
- $0/yr ($0/mo · 0.0%)
ⓘ Screening estimate from a state-policy table — verify with the county assessor before closing.
Climate risk First Street
- Flood 1/10 Low FEMA zone X (unshaded) · 0% chance over 30 yrs
- Wildfire 1/10 Low
- Heat 6/10 Major 7 d/yr ≥107°F today · 19 d/yr by 30 yrs out
- Wind 2/10 Low 2% chance of damaging wind over 30 yrs
- Air quality 2/10 Low 1 unhealthy d/yr today · 1 by 30 yrs out
Nearby sold comps map
Loading sold comps map…
Walkable amenities ~0.75 mi
Loading nearby amenities…
Taxation est. · year 1
- Rental income
- $19,977
- − Mortgage interest
- −$12,323
- − Property taxes
- −$2,103
- − Insurance
- −$1,100
- − Repairs & maintenance
- −$1,598
- − Management
- −$1,598
- − Depreciation
- −$6,400
- Taxable loss
- −$5,146
- Est. tax savings @ 24.0%
- +$1,235
- After-tax cash flow
- $-31/yr
For passive investors: Depreciation is non-cash, so a rental often shows a tax loss while cash-flowing — sheltering income. Rental losses are passive: they offset passive income freely, and up to $25,000/yr can offset ordinary (W-2) income if you actively participate and your MAGI is under $100k (phasing out to $0 by $150k); unused losses carry forward. On sale, claimed depreciation is recaptured at up to 25%, and gains may owe capital-gains tax (a 1031 exchange can defer both). Figures are a year-1 estimate at your 24.0% rate — not tax advice; consult a CPA.
Schools (NCES district)
- District
- Oklahoma City
- NCES district ID
- 4022770
- Math proficiency
- 7% ▼ -5.00%
- Reading proficiency
- 10% ▼ -6.00%
- Median HH income
- $35,606
- Composite
- 7.0/100
- National rank
- #9970
- State rank
- #254 of 270 in OK
Livability — Oklahoma City
- Score
- 80/100
- State rank
- #3
- US rank
- #1635
Category grades
Schools grade is shown separately in the Schools card above.
Census & demographics
- Census place
- Oklahoma City, OK
- County
- Oklahoma County · 771,644 people
- City population
- 498,656
- Metro
- Oklahoma City, OK
- Population (ZIP)
- 35,559
- Household income
- $64,745
- Rent vs Own
- Severe rent burden
- 2029.0
Population outlook (Oklahoma County) Hauer SSP2
- Today (2025)
- 911,875 people
- By 2030
- 982,413 · +7.7%
- By 2040
- 1,130,468 · +24.0%
- By 2050
- 1,288,422 · +41.3%
- By 2075
- 1,711,482 · +87.7%
- By 2100
- 2,088,448 · +129.0%
Race, ethnicity, and origin ACS 2023
- Neighborhood character
- Diverse neighborhood (Simpson 0.62)
- Race & ethnicity
- White 57% Black 21% Two or more races 11% Hispanic / Latino 7% Native American 3% Asian 2%
- Hispanic origin (detail)
- Mexican 4%
- Common ancestry
- Italian 3% Slovak 2% Lithuanian 2%
- Foreign-born
- 7% · Canada, China, Jamaica
- Languages at home
- 92% English-only · Spanish 4% French/Haitian/Cajun 1% Other Asian/Pacific 1%
Political lean MEDSL · Oklahoma
- 2024 margin
- Toss-up / Even · D 48.0% · R 49.7% · Other 2.3%
- 2008→2024 swing
- +15.1pp toward D · 2008: -16.8pp · 2024: -1.7pp
- All cycles
- 2024: R+1.7 2020: R+1.1 2016: R+10.5 2012: R+16.7 2008: R+16.8
Not yet ingested
- Civics
- —
Market trends
- HPI YoY
- ▼ -279.69%
- Current HPI
- 227.2832
- Rent YoY
- ▲ 2.05%
- Metro
- Oklahoma City, OK
- State GDP YoY
- ▲ 1.55%
- F500 in state
- 6
Industry mix (Fortune 500 HQ in OK)
| Industry | F500 HQs | Revenue |
|---|---|---|
| Energy | 3 | $48B |
|
||
Price history
+72.0% since first listed7 events — show timeline
- 2026-06-05 Sold (MLS) $220,000 MLSOK
- 2026-05-09 Pending — MLSOK
- 2026-05-05 Listed $220,000 MLSOK
- 2016-12-20 Sold (Public Records) $123,000 Public Records
- 2016-12-14 Sold (MLS) $123,000 MLSOK
- 2016-11-13 Pending — MLSOK
- 2016-11-03 Listed $127,900 MLSOK
Property tax history
+4.1%/yrLatest (2025): $2,103 · +4.2% YoY. Source: county tax records.
Cash-flow waterfall
monthlySold comps — $/sqft
last 12 mo · ≤1 miLoading sold comps…