 🏷️ Likely Rental
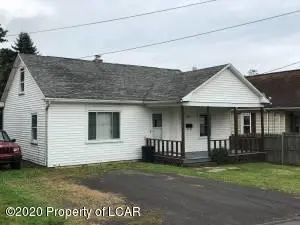
106 Parrish St · Dallas, PA
Flood risk 1/10 · Minimal
- FEMA flood zone
- X (unshaded)
- Chance of flooding over 30 yrs
- 0.0%
- Est. flood insurance / yr
- $507 – $1,088
Fire risk 2/10 · Minimal
- Est. fire insurance / yr
- $511 – $949
Heat risk 3/10 · Minor
- Hot days now (above 93°F)
- 7 days/yr
- Hot days in 30 yrs
- 17 days/yr
Wind risk 3/10 · Minor
- Chance of severe wind over 30 yrs
- 4.0%
Air-quality risk 2/10 · Minimal
- Unhealthy air days now
- 1 days/yr
- Unhealthy air days in 30 yrs
- 1 days/yr
Risk factors via First Street. Map © Google.
Why this score? — see what drove the D+ grade
The composite is a weighted blend of 9 inputs, each scored 0–100. Each bar is that input's sub-score; the figure is the points it added to the 100-point composite (weight × sub-score).
- Cash flow +15.0/30.0
- ARV discount +7.5/15.0
- 1% rule +5.0/10.0
- DSCR +5.0/10.0
- Schools +4.8/10.0
- Livability +3.8/5.0
- Rent growth +2.5/5.0
- Condition / age +2.5/5.0
- Appreciation +0.0/10.0
$1,500
🖨 Deal sheet 📄 Offer letter ✓ Due diligence
Listing remarks
RENTAL , RENTAL Cape Cod in Dallas, . Main living space all on first level. Loft area can be used for office studio or other. Remodeled kitchen with new cabinetry quartz countertop stainless steell sink. Nice size bedrooms. One with Hardwood Floor. Updated bath with new vanity and Modern medicine cabinet. Large rear yard And back deck. No pets. Rent includes sewer and trash. Shed. Updated in May 2004
Key facts
- Quartz countertop
- Stainless steel sink
- Remodeled kitchen
Tags
Property features AI
Finance
- Financial info: Annual tax amount reported
Exterior
- Utilities: Public water; Public sewer
- Home design: Single-family residence; Two levels
- Construction: Vinyl siding
- Exterior features: Shed(s)
Interior
- Kitchen: Eat-in kitchen; Gas water heater
- Bedrooms: Total of 5 rooms (includes bedrooms and living spaces)
- Flooring: Hardwood floors
- Bathrooms: 1 full bathroom
- Heating & cooling: Natural gas heating; Baseboard heat; Ceiling fan(s)
- Interior features: Eat-in kitchen; Full unfinished basement
- Laundry & utility: Gas water heater
Neighborhood map
What this means for you Summary
Snapshot
- This is a 2-bed/1.0-bath single-family listed at $2k.
Deal economics
- At list price, monthly cash flow is $1k ($13k/yr) — positive.
- The deal already cash-flows at list — no discount required.
- Meets the 1% rule at list price ($1k rent vs $2k).
- Cap rate 843.3% vs local median 3.7% in Dallas — top-decile yield for the area; either an underpriced asset or a hidden risk that comps aren't pricing in. Stress-test before assuming the spread holds.
Location & tenants
- Location reads 76/100 on livability (#393 in PA, #3,573 nationally) — a middle-class / working-renter tenant base. Strengths: crime A+, cost of living A+, housing A+; Watch: amenities F, commute F.
- Dallas SD (suburban): math 47% / reading 64% proficiency, ranked #97 of 539 in PA (top 18%) — acceptable for families but not a draw, mixed tenant base, ~2y average lease; only 17% free/reduced lunch — higher-income household profile.
- Market conditions: 86 active listings in the ZIP; 4 comparable units currently listed for rent nearby; rentals leasing fast (median 14d on market — plan ~1-2 weeks tenant-placement turnaround); 349 units permitted in Luzerne County in 2024 (16 in 5+ unit buildings).
Forward outlook
- Local home prices are declining (-3.0%/yr); year-one equity from $10 of loan paydown is wiped out by about $45 of value loss. Plan a longer hold.
- Luzerne County population projected at +4% by 2050 — modest demand growth; plan on rents tracking national, not racing it.
- At projected returns (-3.0% appreciation + 3.0% rent growth), your $420 cash investment doubles in ~1 year — after that, you're playing with house money.
Negotiation context
- Only 5 days on market — expect competitive offers; lowballing is unlikely to land.
- 3 sale attempts since 2y ago; this cycle's ask has dropped $16k (92%) from the opening price — seller is motivated, your offer sets the floor, not the list.
Risks & watch-outs
- Watch-outs: built in 1934 — expect roof / HVAC / electrical / plumbing capex.
Questions for the listing agent
- Built in 1934 — when were the roof, HVAC, electrical panel, plumbing, and water heater last replaced?
- Is there a deadline driving the sale (1031 exchange, divorce, estate, relocation)? That informs how much negotiation room exists.
- Schools are A-rated — typically a magnet for longer-tenancy family renters. What's the average tenant stay here, and is there a school-zone premium baked into asking?
- The area grade is low — what's the realistic commute time and amenity access for the typical tenant pool here? Any planned neighborhood developments (good or bad) we should know about?
- What's the average days-on-market for RENTAL listings here right now (not sales)? A rising rental-DOM trend means longer vacancies and softer asking-rent achievability than the comps imply.
- What's the recent tenant-quality profile in this submarket — average credit score on applications, eviction rate, late-payment / NSF rate, and stable-employment percentage? A property-management company in the area should have these aggregated.
- How much new for-sale + rental construction is in the pipeline within 1–3 miles? Heavy new supply typically softens prices + rents 12–24 months out; constrained supply supports both.
Investment metrics
- 1% rule
- 89.17% ✓
- Cap rate
- 843.32%
- Cash-on-cash
- 2989.38%
- DSCR
- 134.01
- GRM
- 0.1
CMA / ARV
- ARV (on-the-fly)
- $155,792
- Comps found
- 2
Show comp detail 2 sales within ~0.75 mi
| Address | Dist | Beds/Ba | Sqft | Sold | Price | $/sf | Match |
|---|---|---|---|---|---|---|---|
| 118 Jackson St | 0.08mi | 2/1.0 | 795 (-7%) | 11mo | $145,000 | $182 | 75 |
| 190 Davenport St | 0.11mi | 2/1.0 | 952 (+11%) | 12mo | $97,500 | $102 | 66 |
Match score weights: distance 35% · size 25% · config 20% · recency 20%. Top-matched comps best support the ARV.
Projected returns pro-forma
-3.0% appreciation · 3.0% rent growth · sell at horizon
- IRR
- —
- Equity multiple
- 159.13×
- Total profit
- $66,415
- Equity at exit
- $224
- IRR
- —
- Equity multiple
- 343.20×
- Total profit
- $143,723
- Equity at exit
- $130
Cash invested: $420 (down + closing). Projections, not guarantees.
Landlord ↔ Tenant lean methodology
- Overall (STATE)
- 62 Landlord-Friendly
- State Pennsylvania
- 62 Landlord-Friendly · EVEN
- County
- — inherits STATE
- City
- — inherits STATE
ZIP-level market 18612
- Home prices YoY
- -23.2%
- Active inventory
- 86
- Price-to-rent
- 0.1×
Monthly cashflow live
- Estimated rent
- $1,338 medium interval (Pro) →
- Mortgage (P&I)
- −$8
- Tax est. 1.5%
- −$2 /mo · $22/yr
- Insurance
- −$1
- HOA
- −$0
- Vacancy / Maint / Mgmt
- −$281
- Net cashflow
- $1,046
Break-even live
UW: 25.0% down · 7.5% · 30yr · 1.5% tax · 5.0% vac · 8.0% maint · 8.0% mgmt
Financing live
Cash to close
- Down payment
- $375
- Closing costs
- $45
- Reserves months
- —
- Total cash needed
- —
Loan-product check · same deal, 3 products live
Conventional
25% down · 7.5% · 30yr
- Down + closing
- —
- Monthly P&I
- —
- Monthly cashflow
- —
- DSCR
- —
- Eligible?
- —
Personal DTI + credit; lowest rate.
DSCR
20% down · 8.5% · 30yr
- Down + closing
- —
- Monthly P&I
- —
- Monthly cashflow
- —
- DSCR
- —
- Eligible?
- —
No personal income docs; deal must DSCR.
Hard money
10% down · 12.0% · 12mo
- Down + closing
- —
- Monthly P&I
- —
- Monthly cashflow
- —
- DSCR
- —
- Eligible?
- —
Short-term bridge; refi at stabilization.
Rent comps 4 comps
| Address | Beds | Baths | Sqft | Rent | $/sqft | DOM | Units | Dist |
|---|---|---|---|---|---|---|---|---|
| 39 Spring St Shavertown, PA | 2.0 | 1.0 | 900 | $1,300 | $1.44 | 13d | 1 | 0.98mi |
| 125 N Main St Shavertown, PA | 1.0 | 1.0 | 720 | $1,200 | $1.67 | 13d | 1 | 1.25mi |
| 121 N Main St Shavertown, PA | 1.0 | 1.0 | 700 | $1,400 | $2.00 | 13d | 1 | 1.26mi |
| 113 E Center St Shavertown, PA | 2.0 | 1.0 | 1075 | $1,500 | $1.40 | 21d | 1 | 1.47mi |
Listing history 4 events
-
2026-05-22$18,000
-
2026-05-21$1,500 Active
-
2024-07-09historical $1,450
-
2024-06-24$1,450
ⓘ Source: listings_history table (triggers on properties + properties_extension) + one-shot
backfill from property_details.listing_events for pre-trigger history.
Climate risk First Street
- Flood 1/10 Low FEMA zone X (unshaded) · 0% chance over 30 yrs
- Wildfire 2/10 Low
- Heat 3/10 Moderate 7 d/yr ≥93°F today · 17 d/yr by 30 yrs out
- Wind 3/10 Moderate 4% chance of damaging wind over 30 yrs
- Air quality 2/10 Low 1 unhealthy d/yr today · 1 by 30 yrs out
Nearby sold comps map
Loading sold comps map…
Walkable amenities ~0.75 mi
Loading nearby amenities…
Taxation est. · year 1
- Rental income
- $16,050
- − Mortgage interest
- −$84
- − Property taxes
- −$22
- − Insurance
- −$8
- − Repairs & maintenance
- −$1,284
- − Management
- −$1,284
- − Depreciation
- −$44
- Taxable income
- $13,325
- Est. tax owed @ 24.0%
- −$3,198
- After-tax cash flow
- $9,357/yr
For passive investors: Depreciation is non-cash, so a rental often shows a tax loss while cash-flowing — sheltering income. Rental losses are passive: they offset passive income freely, and up to $25,000/yr can offset ordinary (W-2) income if you actively participate and your MAGI is under $100k (phasing out to $0 by $150k); unused losses carry forward. On sale, claimed depreciation is recaptured at up to 25%, and gains may owe capital-gains tax (a 1031 exchange can defer both). Figures are a year-1 estimate at your 24.0% rate — not tax advice; consult a CPA.
Schools (NCES district)
- District
- Dallas SD
- NCES district ID
- 4207200
- Math proficiency
- 47% ▼ -13.00%
- Reading proficiency
- 64% ▼ -11.00%
- Median HH income
- $61,760
- Composite
- 48.4/100
- National rank
- #2138
- State rank
- #97 of 539 in PA
Livability — Dallas
- Score
- 76/100
- State rank
- #393
- US rank
- #3573
Category grades
Schools grade is shown separately in the Schools card above.
Census & demographics
- Census place
- Dallas, PA
- Population (ZIP)
- 17,754
Population outlook (Luzerne County) Hauer SSP2
- Today (2025)
- 319,505 people
- By 2030
- 319,943 · +0.1%
- By 2040
- 322,643 · +1.0%
- By 2050
- 330,817 · +3.5%
- By 2075
- 379,145 · +18.7%
- By 2100
- 431,908 · +35.2%
Race, ethnicity, and origin ACS 2023
- Neighborhood character
- Predominantly White (87%)
- Race & ethnicity
- White 87% Black 6% Hispanic / Latino 3% Two or more races 3%
- Common ancestry
- Romanian 15% Scotch-Irish 2% Italian 2%
- Foreign-born
- 2% · Canada
- Languages at home
- 96% English-only · Spanish 2%
Political lean MEDSL · Luzerne
- 2024 margin
- R (+19.2) · D 40.0% · R 59.2%
- 2008→2024 swing
- -27.6pp toward R · 2008: 8.4pp · 2024: -19.2pp
- All cycles
- 2024: R+19.2 2020: R+14.4 2016: R+19.6 2012: D+4.8 2008: D+8.4
Not yet ingested
- Civics
- —
Market trends
- HPI YoY
- ▼ -75.51%
- Current HPI
- 250.3156
- Rent YoY
- —
- Metro
- —
- State GDP YoY
- ▲ 1.68%
- F500 in state
- 34
Industry mix (Fortune 500 HQ in PA)
| Industry | F500 HQs | Revenue |
|---|---|---|
| Healthcare | 2 | $309B |
|
||
| Insurance | 2 | $27B |
|
||
| Telecommunications / Media | 1 | $124B |
|
||
| Industrial Distribution | 1 | $22B |
|
||
| Financial Services | 1 | $20B |
|
||
| Chemicals / Materials | 1 | $18B |
|
||
Price history
+1141.4% since first listed4 events — show timeline
- 2026-05-22 Listed for Rent $18,000 LCAR
- 2026-05-21 Listed $1,500 LCAR
- 2024-07-09 Rental Removed $1,450 LCAR
- 2024-06-24 Listed for Rent $1,450 LCAR
Property tax history
+2.3%/yrLatest (2026): $1,875 · +5.4% YoY. Source: county tax records.
Cash-flow waterfall
monthlySold comps — $/sqft
last 12 mo · ≤1 miLoading sold comps…