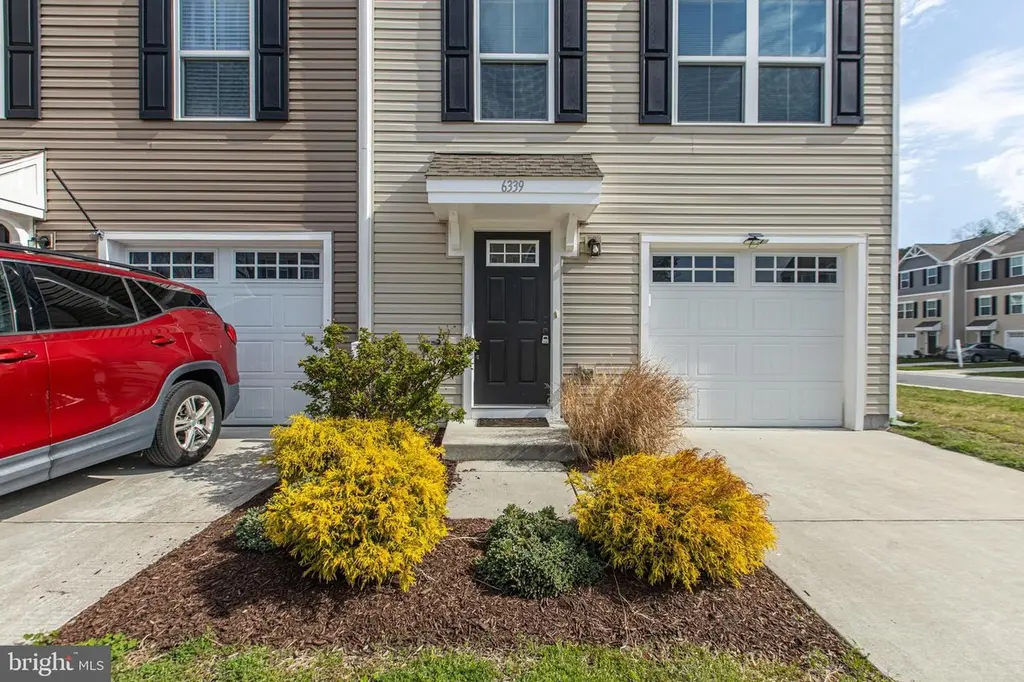
6339 Pebblebrook Dr · Milford, DE
Flood risk 1/10 · Minimal
- FEMA flood zone
- X (unshaded)
- Chance of flooding over 30 yrs
- 0.0%
- Est. flood insurance / yr
- $473 – $860
Fire risk 1/10 · Minimal
- Est. fire insurance / yr
- $476 – $884
Heat risk 8/10 · Major
- Hot days now (above 102°F)
- 7 days/yr
- Hot days in 30 yrs
- 17 days/yr
Wind risk 7/10 · Major
- Chance of severe wind over 30 yrs
- 76.0%
Air-quality risk 2/10 · Minimal
- Unhealthy air days now
- 1 days/yr
- Unhealthy air days in 30 yrs
- 1 days/yr
Risk factors via First Street. Map © Google.
Why this score? — see what drove the F grade
The composite is a weighted blend of 9 inputs, each scored 0–100. Each bar is that input's sub-score; the figure is the points it added to the 100-point composite (weight × sub-score).
- ARV discount +7.5/15.0
- Cash flow +6.4/30.0
- Condition / age +4.0/5.0
- Livability +3.1/5.0
- Rent growth +2.5/5.0
- Schools +2.2/10.0
- DSCR +0.7/10.0
- 1% rule +0.3/10.0
- Appreciation +0.0/10.0
$270,000
🖨 Deal sheet (PDF) 📄 Offer letter ✓ Due diligence
Listing remarks
I am excited to introduce a wonderful new listing in the beautiful Brookstone Trace community. This well-maintained townhouse, built in 2020, features three bedrooms and 2.5 bathrooms. The main level offers a large eat-in kitchen equipped with 30-inch cappuccino cabinets and a four-piece GE stainless steel appliance package. The spacious living room is filled with natural light and features laminate flooring, plush carpeting, and a convenient half bath. On the second floor, you will find three bedrooms, including an owner’s suite complete with a walk-in closet and a private three-piece bathroom. The additional two bedrooms share a second full bathroom, and the floor is finished with a
Key facts
- $15 HOA
- Garage
- Built 2020
Property features AI
Finance
- Other: Total below-grade area approximately 500; Above-grade finished area approximately 1,150; Below-grade finished area approximately 500; Year built source: assessor
- HOA & community: HOA fee $180 annually
Exterior
- Parking: Attached front-entry garage (1 space); Asphalt driveway
- Utilities: Public water; Public sewer
- Home design: Interior townhouse/rowhouse; Fee simple ownership
- Construction: Concrete perimeter foundation (permanent)
- Exterior features: Corner lot/unit; Lot dimensions approximately 44 x 94; Not in a federal flood zone
Interior
- Kitchen: Cooktop; Dishwasher; Microwave; Refrigerator
- Bedrooms: Three bedrooms on the upper level (Master Bedroom, Bedroom 2, Bedroom 3)
- Flooring: Fully carpeted; Vinyl
- Bathrooms: Two full bathrooms and one half bathroom (all on upper level)
- Heating & cooling: Central heating (natural gas); Central air conditioning (natural gas); Tankless hot water
- Interior features: Eat-in kitchen; Two-story ceilings; Basement with drainage system and garage access
- Laundry & utility: Upper-floor laundry; Electric dryer
Neighborhood map
What this means for you Summary
Snapshot
- This is a 3-bed/3.0-bath single-family listed at $270k. Condition is rated good.
Deal economics
- At list price, monthly cash flow is $-463 ($-6k/yr) — negative.
- To cash-flow at today's rent, offer at most $188k (30.3% below list).
- To meet the 1% rule (rent ≥ 1% of price), the offer needs to be $144k (46.7% below list).
- Recommended offer: $144k (46.7% below list) — sets the bar for 1% rule.
Location & tenants
- Location reads 62/100 on livability (#61 in DE) — a middle-class / working-renter tenant base. Strengths: cost of living A+, health & safety A+, housing A-; Watch: schools D+, crime F, amenities F.
- Milford School District (town): math 18% / reading 32% proficiency, ranked #22 of 26 in DE (top 85%) — low school quality limits family demand, transient renter base, plan for 1-2y turnover.
- Market conditions: 207 active listings in the ZIP; 4,354 units permitted in Sussex County in 2024 (344 in 5+ unit buildings).
Forward outlook
- Local home prices are declining (-3.0%/yr); year-one equity from $2k of loan paydown is wiped out by about $8k of value loss. Plan a longer hold.
- Sussex County population projected at +25% by 2050 — long-run rental-demand tailwind backs the buy-and-hold thesis.
Negotiation context
- It's been on market 17 days — a 2% lower offer ($266k) is reasonable based on typical stale-listing flexibility.
Risks & watch-outs
- Climate carrying-cost: major wind risk, 76% chance of damaging wind over 30y; extreme-heat days projected 7→17/yr by 2055 (HVAC capex compounding) — expect insurance premiums to compound above CPI over the hold.
Questions for the listing agent
- What do current leases actually rent for vs. the listed asking? Can we see a recent rent roll and the last 12 months of T-12 income?
- What does the HOA fee cover, when was the last increase, and are there any pending special assessments or reserve-fund shortfalls?
- Is there a deadline driving the sale (1031 exchange, divorce, estate, relocation)? That informs how much negotiation room exists.
- Schools are D-rated, which usually means shorter tenancies and higher turnover. Who's the typical renter profile here, and what's been the actual vacancy rate?
- Crime grade is F in this area — have there been break-ins, vandalism, or insurance claims at this property in the last 3 years? What carrier currently insures it and at what premium?
- The area grade is low — what's the realistic commute time and amenity access for the typical tenant pool here? Any planned neighborhood developments (good or bad) we should know about?
- What's the average days-on-market for RENTAL listings here right now (not sales)? A rising rental-DOM trend means longer vacancies and softer asking-rent achievability than the comps imply.
- What's the recent tenant-quality profile in this submarket — average credit score on applications, eviction rate, late-payment / NSF rate, and stable-employment percentage? A property-management company in the area should have these aggregated.
- How much new for-sale + rental construction is in the pipeline within 1–3 miles? Heavy new supply typically softens prices + rents 12–24 months out; constrained supply supports both.
Investment metrics
- 1% rule
- 0.53% ✗
- Cap rate
- 4.24%
- Cash-on-cash
- -7.34%
- DSCR
- 0.67
- GRM
- 15.6
CMA / ARV
No comps found within radius.
Projected returns pro-forma
-3.0% appreciation · 3.0% rent growth · sell at horizon
- IRR
- -29.2%
- Equity multiple
- 0.03×
- Total profit
- $-73,357
- Equity at exit
- $40,258
- IRR
- -29.8%
- Equity multiple
- -0.35×
- Total profit
- $-102,394
- Equity at exit
- $23,345
Cash invested: $75,600 (down + closing). Projections, not guarantees.
Landlord ↔ Tenant lean methodology
- Overall (STATE)
- 70 Landlord-Friendly
- State Delaware
- 70 Landlord-Friendly · D+7
- County
- — inherits STATE
- City
- — inherits STATE
ZIP-level market 19963
- Active inventory
- 207
- Price-to-rent
- 15.6×
Monthly cashflow live
- Estimated rent
- $1,438 medium interval (Pro) →
- Mortgage (P&I)
- −$1,416
- Tax from tax record
- −$55 /mo · $662/yr
- Insurance
- −$112
- HOA
- −$15
- Vacancy / Maint / Mgmt
- −$302
- Net cashflow
- $-463
Break-even live
Sensitivity live
| Price | -10% $-310 | -5% $-386 | +0% $-463 | +5% $-539 | +10% $-615 |
|---|---|---|---|---|---|
| Rent | -10% $-576 | -5% $-519 | +0% $-463 | +5% $-406 | +10% $-349 |
| Rate | -1.0pp $-327 | -0.5pp $-394 | base $-463 | +0.5pp $-533 | +1.0pp $-604 |
UW: 25.0% down · 7.5% · 30yr · 1.5% tax · 5.0% vac · 8.0% maint · 8.0% mgmt
Financing live
Cash to close
- Down payment
- $67,500
- Closing costs
- $8,100
- Reserves months
- —
- Total cash needed
- —
Loan-product check · same deal, 3 products live
Conventional
25% down · 7.5% · 30yr
- Down + closing
- —
- Monthly P&I
- —
- Monthly cashflow
- —
- DSCR
- —
- Eligible?
- —
Personal DTI + credit; lowest rate.
DSCR
20% down · 8.5% · 30yr
- Down + closing
- —
- Monthly P&I
- —
- Monthly cashflow
- —
- DSCR
- —
- Eligible?
- —
No personal income docs; deal must DSCR.
Hard money
10% down · 12.0% · 12mo
- Down + closing
- —
- Monthly P&I
- —
- Monthly cashflow
- —
- DSCR
- —
- Eligible?
- —
Short-term bridge; refi at stabilization.
HOA detail
- Monthly dues
- $15 · $180/yr
Listing history 3 events
-
2026-04-23status Pending
-
2026-04-06$270,000 Active
-
2026-04-02historical $270,000
ⓘ Source: listings_history table (triggers on properties + properties_extension) + one-shot
backfill from property_details.listing_events for pre-trigger history.
Tax reassessment forecast DE · Partial reset (capped growth)
- Current annual tax
- $662 · $55/mo
- Projected year-2 tax
- $1,114 · $93/mo
- Expected delta
- +$452/yr (+$38/mo · 68.2%)
ⓘ Screening estimate from a state-policy table — verify with the county assessor before closing.
Climate risk First Street
- Flood 1/10 Low FEMA zone X (unshaded) · 0% chance over 30 yrs
- Wildfire 1/10 Low
- Heat 8/10 Severe 7 d/yr ≥102°F today · 17 d/yr by 30 yrs out
- Wind 7/10 Severe 76% chance of damaging wind over 30 yrs
- Air quality 2/10 Low 1 unhealthy d/yr today · 1 by 30 yrs out
Nearby sold comps map
Loading sold comps map…
Walkable amenities ~0.75 mi
Loading nearby amenities…
Taxation est. · year 1
- Rental income
- $17,256
- − Mortgage interest
- −$15,124
- − Property taxes
- −$662
- − Insurance
- −$1,350
- − Repairs & maintenance
- −$1,380
- − Management
- −$1,380
- − HOA
- −$180
- − Depreciation
- −$7,855
- Taxable loss
- −$10,676
- Est. tax savings @ 24.0%
- +$2,562
- After-tax cash flow
- $-2,989/yr
For passive investors: Depreciation is non-cash, so a rental often shows a tax loss while cash-flowing — sheltering income. Rental losses are passive: they offset passive income freely, and up to $25,000/yr can offset ordinary (W-2) income if you actively participate and your MAGI is under $100k (phasing out to $0 by $150k); unused losses carry forward. On sale, claimed depreciation is recaptured at up to 25%, and gains may owe capital-gains tax (a 1031 exchange can defer both). Figures are a year-1 estimate at your 24.0% rate — not tax advice; consult a CPA.
Condition & rehab AI · 6 photos
This well-maintained townhouse in Brookstone Trace offers a good investment opportunity with minor cosmetic updates to enhance its curb appeal and value.
Value-add opportunities
- Resale Paint exterior trim — Enhances curb appeal and value
- Both Replace carpet with hardwood or tile — Improves aesthetics and is easier to maintain
- Both Install smart home devices — Enhances convenience and marketability
Renovation cost estimate screening
Value-add ROI direction
- Resale Paint exterior trim — Enhances curb appeal and value ↑
- Both Replace carpet with hardwood or tile — Improves aesthetics and is easier to maintain ↑
- Both Install smart home devices — Enhances convenience and marketability ↑
ⓘ Cost ranges are severity-bucket heuristics (US national rule-of-thumb). Get contractor quotes + a written scope before underwriting a rehab budget.
Schools (NCES district)
- District
- Milford School District
- NCES district ID
- 1001080
- Math proficiency
- 18% ▼ -26.00%
- Reading proficiency
- 32% ▼ -19.00%
- Median HH income
- $51,794
- Composite
- 22.18/100
- National rank
- #8162
- State rank
- #22 of 26 in DE
Livability — Milford
- Score
- 62/100
- State rank
- #61
- US rank
- #16211
Category grades
Schools grade is shown separately in the Schools card above.
Census & demographics
- Census place
- Milford, DE
- Population (ZIP)
- 22,544
Population outlook (Sussex County) Hauer SSP2
- Today (2025)
- 248,853 people
- By 2030
- 264,464 · +6.3%
- By 2040
- 290,980 · +16.9%
- By 2050
- 311,259 · +25.1%
- By 2075
- 352,488 · +41.6%
- By 2100
- 367,406 · +47.6%
Race, ethnicity, and origin ACS 2023
- Neighborhood character
- Diverse neighborhood (Simpson 0.56)
- Race & ethnicity
- White 62% Black 20% Hispanic / Latino 10% Two or more races 7% Asian 3%
- Hispanic origin (detail)
- Mexican 4% Puerto Rican 2%
- Common ancestry
- Hispanic 3% Romanian 2% Slovak 1%
- Foreign-born
- 11% · Canada, China
- Languages at home
- 84% English-only · Spanish 7% French/Haitian/Cajun 5% Other Indo-European 2%
Political lean MEDSL · Sussex
- 2024 margin
- R (+11.0) · D 43.9% · R 54.9% · Other 1.2%
- 2008→2024 swing
- -2.4pp toward R · 2008: -8.6pp · 2024: -11.0pp
- All cycles
- 2024: R+11.0 2020: R+11.2 2016: R+22.0 2012: R+13.0 2008: R+8.6
Not yet ingested
- Civics
- —
Market trends
- HPI YoY
- ▼ -135.01%
- Current HPI
- 227.2369
- Rent YoY
- —
- Metro
- —
- State GDP YoY
- —
- F500 in state
- 0
Price history
+0.0% since first listed3 events — show timeline
- 2026-04-23 Pending — BRIGHT MLS
- 2026-04-06 Listed $270,000 BRIGHT MLS
- 2026-04-02 Coming Soon $270,000 BRIGHT MLS
Property tax history
-6.0%/yrLatest (2025): $662 · -19.2% YoY. Source: county tax records.
Cash-flow waterfall
monthlySold comps — $/sqft
last 12 mo · ≤1 miLoading sold comps…