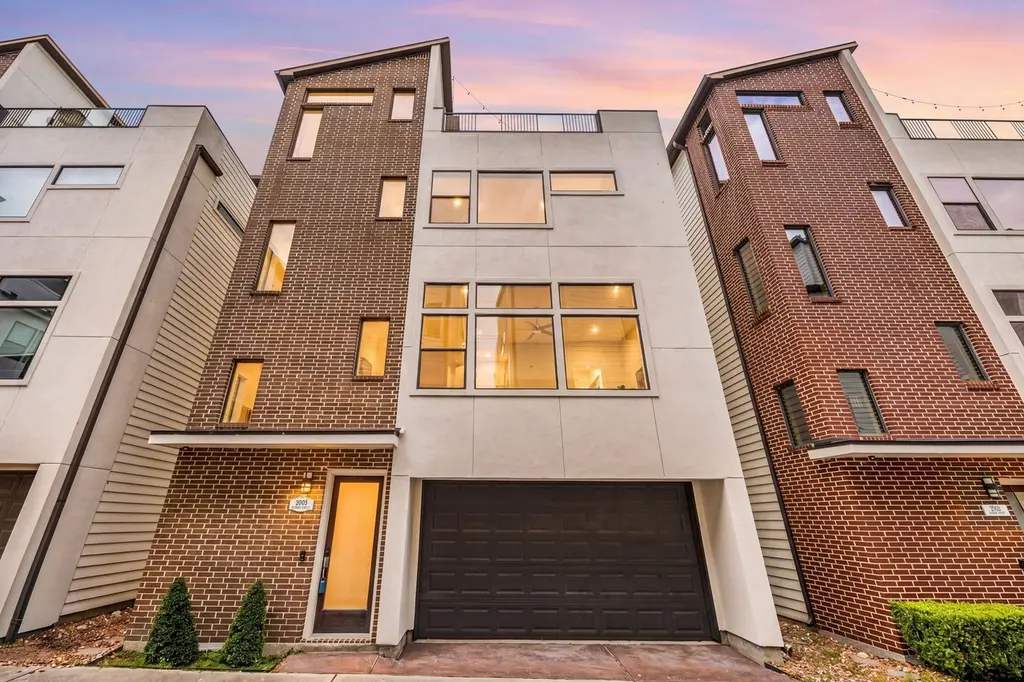
2005 Hickory St · Houston, TX
Flood risk 5/10 · Moderate
- FEMA flood zone
- X (shaded)
- Chance of flooding over 30 yrs
- 0.24%
- Est. flood insurance / yr
- $507 – $1,088
Fire risk 1/10 · Minimal
- Est. fire insurance / yr
- $1,222 – $2,270
Heat risk 9/10 · Severe
- Hot days now (above 109°F)
- 7 days/yr
- Hot days in 30 yrs
- 24 days/yr
Wind risk 9/10 · Severe
- Chance of severe wind over 30 yrs
- 99.0%
Air-quality risk 3/10 · Minor
- Unhealthy air days now
- 2 days/yr
- Unhealthy air days in 30 yrs
- 3 days/yr
Risk factors via First Street. Map © Google.
Why this score? — see what drove the D grade
The composite is a weighted blend of 9 inputs, each scored 0–100. Each bar is that input's sub-score; the figure is the points it added to the 100-point composite (weight × sub-score).
- Cash flow +11.5/30.0
- ARV discount +10.2/15.0
- 1% rule +4.2/10.0
- Livability +3.7/5.0
- DSCR +3.4/10.0
- Schools +2.7/10.0
- Condition / age +2.5/5.0
- Rent growth +2.3/5.0
- Appreciation +0.0/10.0
$439,500
🖨 Deal sheet (PDF) 📄 Offer letter ✓ Due diligence
Listing remarks MLS
Make an appointment today to see this stunning freestanding home in the heart of the Washington Corridor (First Ward) Arts District. Walk to shopping, dining, and happy hour! Located on the Heights Hike/Bike Trail! Granite counters, dark bamboo floors. Brand new carpet (2 bedrooms) and paint throughout. Clean, modern and open, this home is perfect for entertaining. Lots of outdoor space with back yard/patio, balcony off living area and rooftop terrace with downtown view!
Key facts
- 1,591 sq ft lot
- 2 garage spots
- Built 2010
Property features AI
Finance
- HOA & community: Spring Views HOA; HOA fee $60 monthly
Exterior
- Parking: Attached garage (2 spaces)
- Security: Smoke detector(s)
- Utilities: Public sewer
- Home design: Residential property; Living area approximately 2,170; Entry levels on multiple floors
- Construction: Built in 2010; Brick and stucco construction; Composition roof; Slab foundation
- Exterior features: Deck; Rooftop
Interior
- Kitchen: Dishwasher; Electric oven; Gas cooktop; Disposal; Microwave; Refrigerator
- Bedrooms: Primary bedroom (Third level); Bedroom (Third level); Bedroom (First level)
- Flooring: Bamboo; Carpet; Tile
- Bathrooms: 3 full bathrooms; 1 half bathroom
- Heating & cooling: Central heating (Gas); Central air (Electric); Has heating; Has cooling
- Interior features: Balcony; Double vanity; Granite counters; High ceilings; Kitchen island; Kitchen/family room combo; Soaking tub; Separate shower; Walk-in pantry; Ceiling fan(s)
- Laundry & utility: Washer hookup; Gas dryer hookup; Washer; Dryer
Neighborhood map
What this means for you Summary
Snapshot
- This is a 3-bed/4.0-bath single-family listed at $440k.
Deal economics
- At list price, monthly cash flow is $-142 ($-2k/yr) — negative.
- To cash-flow at today's rent, offer at most $414k (5.7% below list).
- To meet the 1% rule (rent ≥ 1% of price), the offer needs to be $405k (8.0% below list).
- Recommended offer: $405k (8.0% below list) — sets the bar for 1% rule.
- Cap rate 5.9% vs local median 3.1% in Houston — top-decile yield for the area; either an underpriced asset or a hidden risk that comps aren't pricing in. Stress-test before assuming the spread holds.
Location & tenants
- Location reads 74/100 on livability (#184 in TX, #4,771 nationally) — a middle-class / working-renter tenant base. Strengths: amenities A+, cost of living A+, housing A+; Watch: crime F.
- Houston ISD (urban): math 27% / reading 35% proficiency, ranked #593 of 826 in TX (top 72%) — families likely to look elsewhere, expect single-tenant / working-renter base with shorter leases; 71% free/reduced lunch — lower-income household profile, screen leases tightly.
- Zoned schools: Crockett El (math 22% / reading 39%, grade F, #2,464 of 4,322 statewide, top 58%, 554 students, 63% FRL); Hogg Middle (math 44% / reading 48%, grade D+, #462 of 1,662 statewide, top 28%, 1,120 students, 52% FRL); Heights H S (math 27% / reading 57%, grade F, #730 of 1,632 statewide, top 47%, 2,476 students, 65% FRL).
- Market conditions: Rents soft (-0.8%/yr); 651 active listings in the ZIP; 40 comparable units currently listed for rent nearby; rentals leasing fast (median 13d on market — plan ~1-2 weeks tenant-placement turnaround); high-income renter base; 29,883 units permitted in Harris County in 2024 (8,621 in 5+ unit buildings).
- This rent runs 33% of the median local income ($145k/yr) — at the standard rent-burdened threshold; future hikes will face affordability resistance.
Forward outlook
- Local home prices are declining (-3.0%/yr); year-one equity from $3k of loan paydown is wiped out by about $13k of value loss. Plan a longer hold.
- Harris County population projected at +47% by 2050 — long-run rental-demand tailwind backs the buy-and-hold thesis.
Negotiation context
- It's been on market 44 days — a 3% lower offer ($426k) is reasonable based on typical stale-listing flexibility.
- 5 sale attempts since 16y ago with the ask held roughly flat each time — persistent listings suggest the price (not the market) is what's stuck; bring a comps-based counter.
- Current owner paid $40k; list at $440k implies a 999% gain — meaningful room to come down on a strong offer.
Risks & watch-outs
- Climate carrying-cost: moderate flood risk; severe wind risk, 99% chance of damaging wind over 30y; extreme-heat days projected 7→24/yr by 2055 (HVAC capex compounding) — expect insurance premiums to compound above CPI over the hold.
Questions for the listing agent
- What do current leases actually rent for vs. the listed asking? Can we see a recent rent roll and the last 12 months of T-12 income?
- It's been on market 44 days. Have you received any prior offers? Is the seller open to a 8% concession, seller financing, or rate buy-down credit?
- What does the HOA fee cover, when was the last increase, and are there any pending special assessments or reserve-fund shortfalls?
- Is there a deadline driving the sale (1031 exchange, divorce, estate, relocation)? That informs how much negotiation room exists.
- Schools are D-rated, which usually means shorter tenancies and higher turnover. Who's the typical renter profile here, and what's been the actual vacancy rate?
- Crime grade is F in this area — have there been break-ins, vandalism, or insurance claims at this property in the last 3 years? What carrier currently insures it and at what premium?
- The area grade is low — what's the realistic commute time and amenity access for the typical tenant pool here? Any planned neighborhood developments (good or bad) we should know about?
- What's the average days-on-market for RENTAL listings here right now (not sales)? A rising rental-DOM trend means longer vacancies and softer asking-rent achievability than the comps imply.
- What's the recent tenant-quality profile in this submarket — average credit score on applications, eviction rate, late-payment / NSF rate, and stable-employment percentage? A property-management company in the area should have these aggregated.
- How much new for-sale + rental construction is in the pipeline within 1–3 miles? Heavy new supply typically softens prices + rents 12–24 months out; constrained supply supports both.
Investment metrics
- 1% rule
- 0.92% ✗
- Cap rate
- 5.91%
- Cash-on-cash
- -1.38%
- DSCR
- 0.94
- GRM
- 9.1
CMA / ARV
- ARV (median comp)
- $467,427
- List price
- $439,500
- Delta
- -5.97%
- Verdict
- FAIR
- Comps
- 20 within 1.0 mi
Show comp detail 12 sales within ~0.75 mi
| Address | Dist | Beds/Ba | Sqft | Sold | Price | $/sf | Match |
|---|---|---|---|---|---|---|---|
| 1510 Johnson St | 0.27mi | 3/3.5 | 2,160 (-0%) | 2mo | $475,000 | $220 | 82 |
| 1817 Crockett St Unit C | 0.33mi | 3/3.5 | 2,132 (-2%) | 3mo | $497,000 | $233 | 77 |
| 1511 Alamo St | 0.11mi | 3/3.5 | 2,397 (+10%) | 1mo | $499,999 | $209 | 74 |
| 1211 Hickory St Unit D | 0.43mi | 3/3.5 | 2,099 (-3%) | 1mo | $465,000 | $222 | 72 |
| 1819 Dart St | 0.50mi | 3/3.5 | 2,198 (+1%) | 2mo | $449,000 | $204 | 71 |
| 1706 Freeman Freeman St | 0.72mi | 3/2.5 | 2,207 (+2%) | 1mo | $469,000 | $213 | 57 |
| 2405 Freeman St | 0.66mi | 3/2.5 | 2,336 (+8%) | 2mo | $425,000 | $182 | 49 |
| 3006 Houston Ave | 0.69mi | 3/2.5 | 1,994 (-8%) | 2mo | $995,000 | $499 | 46 |
| 1810 Kane St | 0.68mi | 4/2.5 (+1) | 2,050 (-6%) | 2mo | $825,000 | $402 | 46 |
| 518 Byrne St | 0.69mi | 4/2.5 (+1) | 2,344 (+8%) | 2mo | $1,220,000 | $520 | 42 |
| 711 Boundary St | 0.74mi | 3/3.5 | 2,447 (+13%) | 1mo | $439,000 | $179 | 41 |
| 414 Woodland St | 0.74mi | 3/2.0 | 2,365 (+9%) | 3mo | $1,100,000 | $465 | 40 |
Match score weights: distance 35% · size 25% · config 20% · recency 20%. Top-matched comps best support the ARV.
Projected returns pro-forma
-3.0% appreciation · 0.0% rent growth · sell at horizon
- IRR
- -22.3%
- Equity multiple
- 0.25×
- Total profit
- $-91,866
- Equity at exit
- $65,531
- IRR
- -27.8%
- Equity multiple
- -0.11×
- Total profit
- $-136,453
- Equity at exit
- $38,000
Cash invested: $123,060 (down + closing). Projections, not guarantees.
Landlord ↔ Tenant lean methodology
- Overall (STATE)
- 87 Strongly Landlord-Friendly
- State Texas
- 87 Strongly Landlord-Friendly · R+5
- County
- — inherits STATE
- City
- — inherits STATE
ZIP-level market 77007
- Rents YoY
- -0.8%
- Active inventory
- 651
- Price-to-rent
- 9.1×
Monthly cashflow live
- Estimated rent
- $4,045 high interval (Pro) →
- Mortgage (P&I)
- −$2,305
- Tax from tax record
- −$790 /mo · $9,478/yr
- Insurance
- −$183
- HOA
- −$60
- Vacancy / Maint / Mgmt
- −$850
- Net cashflow
- $-142
Break-even live
Sensitivity live
| Price | -10% $107 | -5% $-18 | +0% $-142 | +5% $-266 | +10% $-391 |
|---|---|---|---|---|---|
| Rent | -10% $-462 | -5% $-302 | +0% $-142 | +5% $18 | +10% $178 |
| Rate | -1.0pp $79 | -0.5pp $-30 | base $-142 | +0.5pp $-256 | +1.0pp $-372 |
UW: 25.0% down · 7.5% · 30yr · 1.5% tax · 5.0% vac · 8.0% maint · 8.0% mgmt
Financing live
Cash to close
- Down payment
- $109,875
- Closing costs
- $13,185
- Reserves months
- —
- Total cash needed
- —
Loan-product check · same deal, 3 products live
Conventional
25% down · 7.5% · 30yr
- Down + closing
- —
- Monthly P&I
- —
- Monthly cashflow
- —
- DSCR
- —
- Eligible?
- —
Personal DTI + credit; lowest rate.
DSCR
20% down · 8.5% · 30yr
- Down + closing
- —
- Monthly P&I
- —
- Monthly cashflow
- —
- DSCR
- —
- Eligible?
- —
No personal income docs; deal must DSCR.
Hard money
10% down · 12.0% · 12mo
- Down + closing
- —
- Monthly P&I
- —
- Monthly cashflow
- —
- DSCR
- —
- Eligible?
- —
Short-term bridge; refi at stabilization.
Rent comps 40 comps
| Address | Beds | Baths | Sqft | Rent | $/sqft | DOM | Units | Dist |
|---|---|---|---|---|---|---|---|---|
| 1510 Crockett St Houston, TX | 2.0 | 3.0 | 1912 | $2,800 | $1.46 | 45d | 1 | 0.14mi |
| 1512 Crockett St Unit A Houston, TX | 2.0 | 2.5 | 1808 | $2,800 | $1.55 | 45d | 1 | 0.15mi |
| 2114 Sabine St Unit 1257735P Houston, TX | 3.0 | 3.5 | 2594 | $6,588 | $2.54 | 45d | 1 | 0.23mi |
| 2114 Sabine St Houston, TX | 3.0 | 4.0 | 2020 | $3,200 | $1.58 | 45d | 1 | 0.23mi |
| 2018 Crockett St Unit 1029793P Houston, TX | 3.0 | 3.5 | 2507 | $6,482 | $2.59 | 7d | 1 | 0.44mi |
| 2018 Crockett St Unit 2018 Houston, TX | 3.0 | 3.5 | 2514 | $8,000 | $3.18 | 45d | 1 | 0.44mi |
| 410 James St Houston, TX | 3.0 | 2.0 | 1602 | $6,750 | $4.21 | 45d | 1 | 0.53mi |
| 410 James St Unit 1031793P Houston, TX | 3.0 | 2.0 | 1593 | $5,668 | $3.56 | 1d | 1 | 0.53mi |
| 825 Usener St Houston, TX | 2.0 | 1.0–2.0 | 1050 | $2,925 | $2.79 | 0d | 27 | 0.63mi |
| 1625 N Main St Houston, TX | 3.0 | 1.0–3.0 | 994 | $2,354 | $2.37 | 0d | 40 | 0.68mi |
| 2403 Everett St Unit A Houston, TX | 3.0 | 3.5 | 2093 | $2,800 | $1.34 | 45d | 1 | 0.71mi |
| 150 Sabine St Houston, TX | 1.0–2.0 | 1.0–2.0 | 1187 | $2,882 | $2.43 | 5d | 15 | 0.97mi |
| 2013 Cochran St Houston, TX | 3.0 | 4.0 | 1888 | $2,600 | $1.38 | 0d | 1 | 0.98mi |
| 414 Milam St Unit 2162 Houston, TX | 2.0 | 2.0 | 1585 | $3,833 | $2.42 | 7d | 1 | 1.07mi |
| 414 Milam St Unit 437 Houston, TX | 2.0 | 2.0 | 1585 | $3,857 | $2.43 | 13d | 1 | 1.07mi |
| 414 Milam St Unit 2165 Houston, TX | 2.0 | 2.0 | 1585 | $3,817 | $2.41 | 1d | 1 | 1.07mi |
| 414 Milam St Unit 447 Houston, TX | 3.0 | 2.0 | 2421 | $8,973 | $3.71 | 45d | 1 | 1.07mi |
| 414 Milam St Unit 447 Houston, TX | 3.0 | 2.0 | 2421 | $8,991 | $3.71 | 13d | 1 | 1.07mi |
| 414 Milam St Unit 422 Houston, TX | 2.0 | 2.0 | 1585 | $3,833 | $2.42 | 9d | 1 | 1.07mi |
| 414 Milam St Unit 2187 Houston, TX | 2.0 | 2.0 | 1585 | $3,857 | $2.43 | 5d | 1 | 1.07mi |
| 414 Milam St Unit 510 Houston, TX | 3.0 | 2.0 | 2421 | $9,230 | $3.81 | 16d | 1 | 1.07mi |
| 414 Milam St Unit 3165 Houston, TX | 3.0 | 2.0 | 2421 | $9,002 | $3.72 | 0d | 1 | 1.07mi |
| 414 Milam St Unit 2148 Houston, TX | 2.0 | 2.0 | 1585 | $3,868 | $2.44 | 0d | 1 | 1.07mi |
| 414 Milam St Unit B1-2003 Houston, TX | 2.0 | 2.0 | 1585 | $4,513 | $2.85 | 45d | 1 | 1.07mi |
| 414 Milam St Ph 2-4602 Houston, TX | 2.0 | 2.0 | 2158 | $8,990 | $4.17 | 45d | 1 | 1.07mi |
| 414 Milam St Houston, TX | 2.0 | 2.5 | 1585 | $3,845 | $2.43 | 24d | 1 | 1.07mi |
| 1116 Woodland St Houston, TX | 3.0 | 2.0 | 2400 | $4,000 | $1.67 | 45d | 1 | 1.11mi |
| 409 Travis St Unit 432 Houston, TX | 2.0 | 2.0 | 1495 | $3,316 | $2.22 | 13d | 1 | 1.15mi |
| 409 Travis St Unit 2187 Houston, TX | 2.0 | 2.0 | 1495 | $3,317 | $2.22 | 1d | 1 | 1.15mi |
| 409 Travis St Unit 425 Houston, TX | 2.0 | 2.0 | 1495 | $3,327 | $2.23 | 0d | 1 | 1.15mi |
| 409 Travis St Unit 424 Houston, TX | 2.0 | 2.0 | 1495 | $3,292 | $2.20 | 9d | 1 | 1.15mi |
| 413 Travis St Houston, TX | 2.0 | 2.0 | 1495 | $4,000 | $2.68 | 45d | 1 | 1.16mi |
| 909 Texas Ave Houston, TX | 2.0 | 1.0–2.0 | 1262 | $3,129 | $2.48 | 3d | 36 | 1.17mi |
| 2706 Cochran St Houston, TX | 3.0 | 3.5 | 1791 | $2,700 | $1.51 | 21d | 1 | 1.19mi |
| 3010 S Heights Hollow Ln Houston, TX | 2.0 | 2.0 | 1442 | $2,400 | $1.66 | 45d | 1 | 1.22mi |
| 915 Texas Ave Unit 420 Houston, TX | 3.0 | 2.0 | 2366 | $4,655 | $1.97 | 45d | 1 | 1.22mi |
| 915 Texas Ave Unit 420 Houston, TX | 3.0 | 2.0 | 2366 | $4,655 | $1.97 | 21d | 1 | 1.22mi |
| 3275 Summer St Houston, TX | 1.0–2.0 | 1.0–2.5 | 995 | $2,570 | $2.58 | 1d | 16 | 1.27mi |
| 616 Memorial Heights Dr Houston, TX | 1.0–2.0 | 1.0–2.0 | 1070 | $2,254 | $2.11 | 0d | 44 | 1.28mi |
| 401 Walton St Houston, TX | 3.0 | 2.0 | 2112 | $2,500 | $1.18 | 17d | 1 | 1.28mi |
HOA detail
- Monthly dues
- $60 · $720/yr
Listing history 31 events
-
2026-06-21days on market $439,500 Active 44 DOM
-
2026-06-18days on market $439,500 Active 41 DOM
-
2026-06-17days on market $439,500 Active 40 DOM
-
2026-06-16days on market $439,500 Active 39 DOM
-
2026-06-15days on market $439,500 Active 38 DOM
-
2026-06-13days on market $439,500 Active 36 DOM
-
2026-06-10days on market $439,500 Active 32 DOM
-
2026-06-08days on market $439,500 Active 31 DOM
-
2026-06-07days on market $439,500 Active 30 DOM
-
2026-06-04days on market $439,500 Active 27 DOM
-
2026-06-01days on market $439,500 Active 24 DOM
-
2026-05-31days on market $439,500 Active 23 DOM
-
2026-05-08$439,500 Active 752-char remark
-
2026-05-06historical
-
2026-03-13price $447,000
-
2026-02-03status Active
-
2026-02-01status Pending
-
2026-01-26status Pending
-
2025-12-05price $457,000
-
2025-11-06$467,000 Active
-
2017-03-06soldstatus
-
2017-03-03soldstatus Sold
Show marketing remark (477 chars)
Make an appointment today to see this stunning freestanding home in the heart of the Washington Corridor (First Ward) Arts District. Walk to shopping, dining, and happy hour! Located on the Heights Hike/Bike Trail! Granite counters, dark bamboo floors. Brand new carpet (2 bedrooms) and paint throughout. Clean, modern and open, this home is perfect for entertaining. Lots of outdoor space with back yard/patio, balcony off living area and rooftop terrace with downtown view!
-
2017-02-07status Pending
Show marketing remark (477 chars)
Make an appointment today to see this stunning freestanding home in the heart of the Washington Corridor (First Ward) Arts District. Walk to shopping, dining, and happy hour! Located on the Heights Hike/Bike Trail! Granite counters, dark bamboo floors. Brand new carpet (2 bedrooms) and paint throughout. Clean, modern and open, this home is perfect for entertaining. Lots of outdoor space with back yard/patio, balcony off living area and rooftop terrace with downtown view!
-
2017-01-26status Option Pending
Show marketing remark (477 chars)
Make an appointment today to see this stunning freestanding home in the heart of the Washington Corridor (First Ward) Arts District. Walk to shopping, dining, and happy hour! Located on the Heights Hike/Bike Trail! Granite counters, dark bamboo floors. Brand new carpet (2 bedrooms) and paint throughout. Clean, modern and open, this home is perfect for entertaining. Lots of outdoor space with back yard/patio, balcony off living area and rooftop terrace with downtown view!
-
2017-01-03price $389,000
Show marketing remark (477 chars)
Make an appointment today to see this stunning freestanding home in the heart of the Washington Corridor (First Ward) Arts District. Walk to shopping, dining, and happy hour! Located on the Heights Hike/Bike Trail! Granite counters, dark bamboo floors. Brand new carpet (2 bedrooms) and paint throughout. Clean, modern and open, this home is perfect for entertaining. Lots of outdoor space with back yard/patio, balcony off living area and rooftop terrace with downtown view!
-
2016-11-11$399,000 Active
Show marketing remark (477 chars)
Make an appointment today to see this stunning freestanding home in the heart of the Washington Corridor (First Ward) Arts District. Walk to shopping, dining, and happy hour! Located on the Heights Hike/Bike Trail! Granite counters, dark bamboo floors. Brand new carpet (2 bedrooms) and paint throughout. Clean, modern and open, this home is perfect for entertaining. Lots of outdoor space with back yard/patio, balcony off living area and rooftop terrace with downtown view!
-
2010-11-19soldstatus
-
2010-10-28historical
-
2010-01-25$288,900
-
2003-12-09soldstatus $40,000
-
1997-06-10soldstatus
ⓘ Source: listings_history table (triggers on properties + properties_extension) + one-shot
backfill from property_details.listing_events for pre-trigger history.
Tax reassessment forecast TX · Resets to sale price
- Current annual tax
- $9,478 · $790/mo
- Projected year-2 tax
- $9,478 · $790/mo
- Expected delta
- $0/yr ($0/mo · 0.0%)
ⓘ Screening estimate from a state-policy table — verify with the county assessor before closing.
Climate risk First Street
- Flood 5/10 Major FEMA zone X (shaded) · 24% chance over 30 yrs
- Wildfire 1/10 Low
- Heat 9/10 Extreme 7 d/yr ≥109°F today · 24 d/yr by 30 yrs out
- Wind 9/10 Extreme 99% chance of damaging wind over 30 yrs
- Air quality 3/10 Moderate 2 unhealthy d/yr today · 3 by 30 yrs out
Nearby sold comps map
Loading sold comps map…
Walkable amenities ~0.75 mi
Loading nearby amenities…
Taxation est. · year 1
- Rental income
- $48,545
- − Mortgage interest
- −$24,619
- − Property taxes
- −$9,478
- − Insurance
- −$2,198
- − Repairs & maintenance
- −$3,884
- − Management
- −$3,884
- − HOA
- −$720
- − Depreciation
- −$12,785
- Taxable loss
- −$9,023
- Est. tax savings @ 24.0%
- +$2,165
- After-tax cash flow
- $462/yr
For passive investors: Depreciation is non-cash, so a rental often shows a tax loss while cash-flowing — sheltering income. Rental losses are passive: they offset passive income freely, and up to $25,000/yr can offset ordinary (W-2) income if you actively participate and your MAGI is under $100k (phasing out to $0 by $150k); unused losses carry forward. On sale, claimed depreciation is recaptured at up to 25%, and gains may owe capital-gains tax (a 1031 exchange can defer both). Figures are a year-1 estimate at your 24.0% rate — not tax advice; consult a CPA.
Schools (NCES district)
- District
- Houston ISD
- NCES district ID
- 4823640
- Math proficiency
- 27% ▼ -18.00%
- Reading proficiency
- 35% ▼ -6.00%
- Median HH income
- $46,054
- Composite
- 26.63/100
- National rank
- #7173
- State rank
- #593 of 826 in TX
Livability — Houston
- Score
- 74/100
- State rank
- #184
- US rank
- #4771
Category grades
Schools grade is shown separately in the Schools card above.
Census & demographics
- Census place
- Houston, TX
- County
- Harris County · 4,702,590 people
- City population
- 3,226,434
- Metro
- Houston-The Woodlands-Sugar Land, TX
- Population (ZIP)
- 47,808
- Household income
- $144,911
- Rent vs Own
- Severe rent burden
- 1812.0
Population outlook (Harris County) Hauer SSP2
- Today (2025)
- 5,571,493 people
- By 2030
- 6,089,821 · +9.3%
- By 2040
- 7,142,806 · +28.2%
- By 2050
- 8,185,864 · +46.9%
- By 2075
- 10,574,329 · +89.8%
- By 2100
- 12,109,958 · +117.4%
Race, ethnicity, and origin ACS 2023
- Neighborhood character
- Diverse neighborhood (Simpson 0.63)
- Race & ethnicity
- White 57% Hispanic / Latino 17% Two or more races 13% Asian 11% Black 9%
- Hispanic origin (detail)
- Mexican 12%
- Common ancestry
- Slovak 3% Romanian 3% Italian 3%
- Foreign-born
- 19% · Canada, China, South Korea
- Languages at home
- 75% English-only · Spanish 12% Other Indo-European 4% Chinese 2%
Political lean MEDSL · Harris
- 2024 margin
- Lean D (+5.5) · D 52.0% · R 46.4% · Other 1.6%
- 2008→2024 swing
- +3.9pp toward D · 2008: 1.6pp · 2024: 5.5pp
- All cycles
- 2024: D+5.5 2020: D+13.3 2016: D+12.4 2012: D+0.1 2008: D+1.6
Not yet ingested
- Civics
- —
Market trends
- HPI YoY
- ▼ -219.42%
- Current HPI
- 159.8157
- Rent YoY
- ▼ -0.83%
- Metro
- Houston-The Woodlands-Sugar Land, TX
- State GDP YoY
- ▲ 3.95%
- F500 in state
- 110
Industry mix (Fortune 500 HQ in TX)
| Industry | F500 HQs | Revenue |
|---|---|---|
| Energy | 16 | $1,198B |
|
||
| Technology | 5 | $198B |
|
||
| Engineering / Construction | 4 | $72B |
|
||
| Energy Services | 3 | $60B |
|
||
| Utilities | 3 | $41B |
|
||
| Healthcare | 2 | $330B |
|
||
Price history
+998.8% since first listed19 events — show timeline
- 2026-05-08 Listed $439,500 HARMLS
- 2026-05-06 Listing Removed — HARMLS
- 2026-03-13 Price Changed $447,000 HARMLS
- 2026-02-03 Relisted — HARMLS
- 2026-02-01 Pending — HARMLS
- 2026-01-26 Pending — HARMLS
- 2025-12-05 Price Changed $457,000 HARMLS
- 2025-11-06 Listed $467,000 HARMLS
- 2017-03-06 Sold (Public Records) — Public Records
- 2017-03-03 Sold (MLS) — HARMLS
- 2017-02-07 Pending — HARMLS
- 2017-01-26 Pending — HARMLS
- 2017-01-03 Price Changed $389,000 HARMLS
- 2016-11-11 Listed $399,000 HARMLS
- 2010-11-19 Sold (MLS) — HARMLS
- 2010-10-28 Listing Removed — HARMLS
- 2010-01-25 Listed $288,900 HARMLS
- 2003-12-09 Sold (Public Records) $40,000 Public Records
- 1997-06-10 Sold (Public Records) — Public Records
Property tax history
+11.8%/yrLatest (2025): $9,478 · -1.7% YoY. Source: county tax records.
Cash-flow waterfall
monthlySold comps — $/sqft
last 12 mo · ≤1 miLoading sold comps…