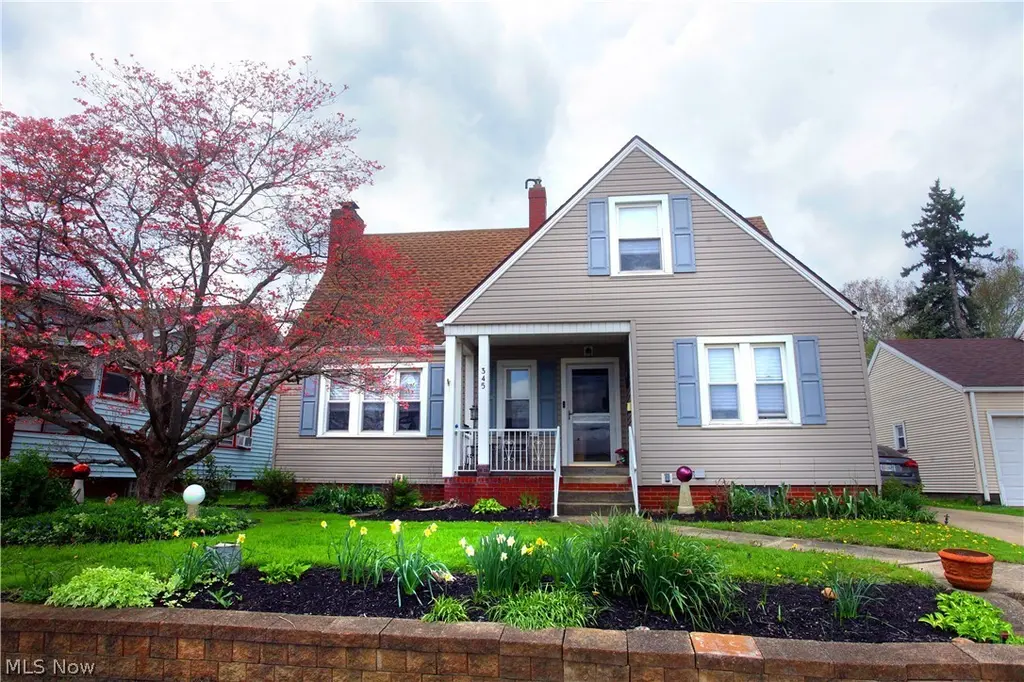
345 Roslyn Ave NW · Canton, OH
Flood risk 1/10 · Minimal
- FEMA flood zone
- X (unshaded)
- Chance of flooding over 30 yrs
- 0.0%
- Est. flood insurance / yr
- $473 – $860
Fire risk 1/10 · Minimal
- Est. fire insurance / yr
- $713 – $1,323
Heat risk 3/10 · Minor
- Hot days now (above 96°F)
- 7 days/yr
- Hot days in 30 yrs
- 17 days/yr
Wind risk 1/10 · Minimal
- Chance of severe wind over 30 yrs
- —
Air-quality risk 2/10 · Minimal
- Unhealthy air days now
- 0 days/yr
- Unhealthy air days in 30 yrs
- 1 days/yr
Risk factors via First Street. Map © Google.
Why this score? — see what drove the F grade
The composite is a weighted blend of 9 inputs, each scored 0–100. Each bar is that input's sub-score; the figure is the points it added to the 100-point composite (weight × sub-score).
- Cash flow +9.9/30.0
- ARV discount +7.3/15.0
- Rent growth +4.2/5.0
- Livability +3.6/5.0
- DSCR +2.8/10.0
- 1% rule +2.5/10.0
- Condition / age +2.5/5.0
- Schools +1.7/10.0
- Appreciation +0.0/10.0
$145,900
🖨 Deal sheet (PDF) 📄 Offer letter ✓ Due diligence
Listing remarks
Welcome to this well-maintained 4-bedroom, 2-bath home. With 1 bedroom and 1 bath on the main floor this property is a great opportunity for homeowners or investors alike. You'll find inside a functional layout with spacious living areas and plenty of natural light throughout. The home has been cared for, making it move-in ready while still offering potential to add your own personal touches. Property also features a two-car garage, providing ample parking and storage space. Whether you're looking for your first home or a solid investment, this property delivers value, space, and convenience. Schedule your private showing today!
Key facts
- 5,100 sq ft lot
- 2 garage spots
- Built 1939
Property features AI
Exterior
- Parking: Detached 2-car garage; Driveway and on-street parking available
- Utilities: Public water; Public sewer
- Home design: Vinyl and wood siding exterior; Asphalt roof
- Construction: Vinyl siding and wood siding construction; Asphalt roof
- Exterior features: Rear covered porch; Front porch; Hot tub / spa
Interior
- Kitchen: Range; Refrigerator
- Bedrooms: One main-level bedroom; Multiple second-level bedrooms
- Flooring: Wood flooring in living room, some bedrooms, and basement areas; Laminate flooring in one first-level room; Linoleum flooring in kitchen, dining room, entry/foyer, and a bathroom
- Bathrooms: Two full bathrooms; One full bathroom on the main level
- Heating & cooling: Gas heating; Central air conditioning
- Interior features: Partially finished basement with sump pump; Fireplace in living room; Rear covered porch and front porch
- Laundry & utility: Washer; Dryer
Neighborhood map
What this means for you Summary
Snapshot
- This is a 3-bed/1.5-bath single-family listed at $146k.
Deal economics
- At list price, monthly cash flow is $-90 ($-1k/yr) — negative.
- To cash-flow at today's rent, offer at most $130k (11.0% below list).
- To meet the 1% rule (rent ≥ 1% of price), the offer needs to be $109k (25.1% below list).
- Recommended offer: $109k (25.1% below list) — sets the bar for 1% rule.
Location & tenants
- Location reads 71/100 on livability (#441 in OH) — a middle-class / working-renter tenant base. Strengths: commute A+, cost of living A+, housing A; Watch: crime F, employment F.
- Canton City (urban): math 17% / reading 26% proficiency, ranked #627 of 656 in OH (top 96%) — low school quality limits family demand, transient renter base, plan for 1-2y turnover; 76% free/reduced lunch — lower-income household profile, screen leases tightly.
- Market conditions: Rents rising fast (+6.7%/yr); 120 active listings in the ZIP; 21 comparable units currently listed for rent nearby; rentals at typical pace (median 22d on market — plan ~3-4 weeks tenant-placement turnaround); 43% of comp listings sitting > 30 days — soft ceiling on asking rent; 528 units permitted in Stark County in 2024 (84 in 5+ unit buildings).
Forward outlook
- Local home prices are declining (-3.0%/yr); year-one equity from $1k of loan paydown is wiped out by about $4k of value loss. Plan a longer hold.
- Stark County population projected to shrink 8% by 2050 — rents likely to lag national; underwrite the cash flow, not the appreciation.
Negotiation context
- It's been on market 36 days — a 3% lower offer ($142k) is reasonable based on typical stale-listing flexibility.
Risks & watch-outs
- Watch-outs: built in 1939 — expect roof / HVAC / electrical / plumbing capex.
Questions for the listing agent
- What do current leases actually rent for vs. the listed asking? Can we see a recent rent roll and the last 12 months of T-12 income?
- It's been on market 36 days. Have you received any prior offers? Is the seller open to a 25% concession, seller financing, or rate buy-down credit?
- Built in 1939 — when were the roof, HVAC, electrical panel, plumbing, and water heater last replaced?
- Is there a deadline driving the sale (1031 exchange, divorce, estate, relocation)? That informs how much negotiation room exists.
- Crime grade is F in this area — have there been break-ins, vandalism, or insurance claims at this property in the last 3 years? What carrier currently insures it and at what premium?
- The area grade is low — what's the realistic commute time and amenity access for the typical tenant pool here? Any planned neighborhood developments (good or bad) we should know about?
- What's the average days-on-market for RENTAL listings here right now (not sales)? A rising rental-DOM trend means longer vacancies and softer asking-rent achievability than the comps imply.
- What's the recent tenant-quality profile in this submarket — average credit score on applications, eviction rate, late-payment / NSF rate, and stable-employment percentage? A property-management company in the area should have these aggregated.
- How much new for-sale + rental construction is in the pipeline within 1–3 miles? Heavy new supply typically softens prices + rents 12–24 months out; constrained supply supports both.
Investment metrics
- 1% rule
- 0.75% ✗
- Cap rate
- 5.55%
- Cash-on-cash
- -2.66%
- DSCR
- 0.88
- GRM
- 11.1
CMA / ARV
- ARV (on-the-fly)
- $145,152
- Comps found
- 12
Show comp detail 12 sales within ~0.75 mi
| Address | Dist | Beds/Ba | Sqft | Sold | Price | $/sf | Match |
|---|---|---|---|---|---|---|---|
| 345 Roslyn Ave NW | 0.00mi | 4/2.0 (+1) | 1,296 (0%) | 1mo | $145,900 | $113 | 92 |
| 131 Roslyn Ave NW | 0.22mi | 3/1.5 | 1,352 (+4%) | 3mo | $178,500 | $132 | 80 |
| 222 Montrose Ave NW | 0.22mi | 3/1.0 | 1,368 (+6%) | 1mo | $175,000 | $128 | 78 |
| 3014 2nd St NW | 0.26mi | 3/1.0 | 1,200 (-7%) | 2mo | $95,000 | $79 | 72 |
| 3115 2nd St NW | 0.17mi | 2/1.5 (-1) | 1,160 (-10%) | 1mo | $130,000 | $112 | 69 |
| 354 Clarendon Ave NW | 0.47mi | 2/1.0 (-1) | 1,317 (+2%) | 0mo | $93,500 | $71 | 68 |
| 3016 9th St SW | 0.60mi | 4/1.5 (+1) | 1,296 (0%) | 1mo | $170,000 | $131 | 66 |
| 814 Lakeview Ave NW | 0.71mi | 3/1.0 | 1,296 (0%) | 0mo | $190,000 | $147 | 65 |
| 2322 9th St NW | 0.71mi | 3/2.0 | 1,296 (0%) | 1mo | $75,000 | $58 | 64 |
| 519 Columbus Ave NW | 0.54mi | 3/2.0 | 1,228 (-5%) | 2mo | $105,000 | $86 | 62 |
| 824 Smith Ave NW | 0.74mi | 3/1.0 | 1,264 (-2%) | 0mo | $126,000 | $100 | 59 |
| 1014 Roslyn Ave SW | 0.64mi | 3/1.0 | 1,128 (-13%) | 2mo | $107,500 | $95 | 45 |
Match score weights: distance 35% · size 25% · config 20% · recency 20%. Top-matched comps best support the ARV.
Projected returns pro-forma
-3.0% appreciation · 6.73% rent growth · sell at horizon
- IRR
- -16.9%
- Equity multiple
- 0.38×
- Total profit
- $-25,170
- Equity at exit
- $21,754
- IRR
- -3.4%
- Equity multiple
- 0.74×
- Total profit
- $-10,567
- Equity at exit
- $12,615
Cash invested: $40,852 (down + closing). Projections, not guarantees.
Landlord ↔ Tenant lean methodology
- Overall (STATE)
- 73 Landlord-Friendly
- State Ohio
- 73 Landlord-Friendly · R+6
- County
- — inherits STATE
- City
- — inherits STATE
ZIP-level market 44708
- Rents YoY
- 6.7%
- Active inventory
- 120
- Price-to-rent
- 11.1×
Monthly cashflow live
- Estimated rent
- $1,092 high interval (Pro) →
- Mortgage (P&I)
- −$765
- Tax from tax record
- −$127 /mo · $1,528/yr
- Insurance
- −$61
- HOA
- −$0
- Vacancy / Maint / Mgmt
- −$229
- Net cashflow
- $-90
Break-even live
Sensitivity live
| Price | -10% $-8 | -5% $-49 | +0% $-90 | +5% $-132 | +10% $-173 |
|---|---|---|---|---|---|
| Rent | -10% $-177 | -5% $-134 | +0% $-90 | +5% $-47 | +10% $-4 |
| Rate | -1.0pp $-17 | -0.5pp $-53 | base $-90 | +0.5pp $-128 | +1.0pp $-167 |
UW: 25.0% down · 7.5% · 30yr · 1.5% tax · 5.0% vac · 8.0% maint · 8.0% mgmt
Financing live
Cash to close
- Down payment
- $36,475
- Closing costs
- $4,377
- Reserves months
- —
- Total cash needed
- —
Loan-product check · same deal, 3 products live
Conventional
25% down · 7.5% · 30yr
- Down + closing
- —
- Monthly P&I
- —
- Monthly cashflow
- —
- DSCR
- —
- Eligible?
- —
Personal DTI + credit; lowest rate.
DSCR
20% down · 8.5% · 30yr
- Down + closing
- —
- Monthly P&I
- —
- Monthly cashflow
- —
- DSCR
- —
- Eligible?
- —
No personal income docs; deal must DSCR.
Hard money
10% down · 12.0% · 12mo
- Down + closing
- —
- Monthly P&I
- —
- Monthly cashflow
- —
- DSCR
- —
- Eligible?
- —
Short-term bridge; refi at stabilization.
Rent comps 21 comps
| Address | Beds | Baths | Sqft | Rent | $/sqft | DOM | Units | Dist |
|---|---|---|---|---|---|---|---|---|
| 2525 6th St NW Unit NA Canton, OH | 2.0 | 1.0 | 950 | $700 | $0.74 | 44d | 1 | 0.51mi |
| 521 Columbus Ave NW Unit 2 Canton, OH | 2.0 | 1.0 | 900 | $875 | $0.97 | 44d | 1 | 0.53mi |
| 521 Columbus Ave NW Canton, OH | 2.0 | 1.0 | 900 | $775 | $0.86 | 21d | 1 | 0.53mi |
| 900 Roslyn Ave SW Canton, OH | 3.0 | 1.0 | 1320 | $1,175 | $0.89 | 14d | 1 | 0.54mi |
| 1005 Broad Ave NW Unit 201 Canton, OH | 3.0 | 1.0 | 1200 | $800 | $0.67 | 21d | 1 | 0.55mi |
| 1005 Broad Ave NW Unit 100 Canton, OH | 2.0 | 1.0 | 1200 | $850 | $0.71 | 21d | 1 | 0.55mi |
| 3034 12th St NW Canton, OH | 2.0 | 1.0 | 1724 | $1,125 | $0.65 | 21d | 1 | 0.59mi |
| 1014 Roslyn Ave SW Canton, OH | 3.0 | 1.0 | 1128 | $1,150 | $1.02 | 21d | 1 | 0.63mi |
| 2510 10th St NW Canton, OH | 3.0 | 1.5 | 1468 | $1,175 | $0.80 | 21d | 1 | 0.64mi |
| 2316 2nd St SW Canton, OH | 3.0 | 1.0 | 1125 | $1,095 | $0.97 | 44d | 1 | 0.66mi |
| 2237 Tuscarawas St W Unit 7 Canton, OH | 2.0 | 1.0 | 1035 | $725 | $0.70 | 44d | 1 | 0.69mi |
| 2237 Tuscarawas St W Canton, OH | 2.0 | 1.0 | 1035 | $700 | $0.68 | 21d | 1 | 0.69mi |
| 202 Smith Ave SW Canton, OH | 2.0 | 1.0 | 1236 | $995 | $0.81 | 44d | 1 | 0.72mi |
| 1117 Arlington Ave SW Canton, OH | 3.0 | 1.0 | 1240 | $1,200 | $0.97 | 14d | 1 | 0.95mi |
| 1023 Harrison Ave SW Canton, OH | 3.0 | 1.0 | 1224 | $1,250 | $1.02 | 21d | 1 | 1.00mi |
| 1241 Bedford Ave SW Canton, OH | 3.0 | 2.0 | 1152 | $1,200 | $1.04 | 14d | 1 | 1.04mi |
| 2901 17th St NW Canton, OH | 2.0 | 1.0 | 1000 | $885 | $0.89 | 21d | 1 | 1.14mi |
| 1229 Lawn Ave SW Canton, OH | 2.0 | 1.0 | 936 | $950 | $1.01 | 44d | 1 | 1.23mi |
| 1137 7th St NW Canton, OH | 3.0 | 1.0 | 1736 | $1,095 | $0.63 | 44d | 1 | 1.42mi |
| 1520 Bryan Ave SW Canton, OH | 3.0 | 1.0 | 1040 | $1,100 | $1.06 | 44d | 1 | 1.46mi |
| 1100 5th St SW Canton, OH | 4.0 | 1.0 | 1397 | $1,200 | $0.86 | 44d | 1 | 1.47mi |
Listing history 3 events
-
2026-05-24status Pending
-
2026-04-21historical Contingent
-
2026-04-18$145,900 Active
ⓘ Source: listings_history table (triggers on properties + properties_extension) + one-shot
backfill from property_details.listing_events for pre-trigger history.
Tax reassessment forecast OH · Partial reset (capped growth)
- Current annual tax
- $1,528 · $127/mo
- Projected year-2 tax
- $1,902 · $158/mo
- Expected delta
- +$374/yr (+$31/mo · 24.5%)
ⓘ Screening estimate from a state-policy table — verify with the county assessor before closing.
Climate risk First Street
- Flood 1/10 Low FEMA zone X (unshaded) · 0% chance over 30 yrs
- Wildfire 1/10 Low
- Heat 3/10 Moderate 7 d/yr ≥96°F today · 17 d/yr by 30 yrs out
- Wind 1/10 Low
- Air quality 2/10 Low 0 unhealthy d/yr today · 1 by 30 yrs out
Nearby sold comps map
Loading sold comps map…
Walkable amenities ~0.75 mi
Loading nearby amenities…
Taxation est. · year 1
- Rental income
- $13,105
- − Mortgage interest
- −$8,173
- − Property taxes
- −$1,528
- − Insurance
- −$730
- − Repairs & maintenance
- −$1,048
- − Management
- −$1,048
- − Depreciation
- −$4,244
- Taxable loss
- −$3,666
- Est. tax savings @ 24.0%
- +$880
- After-tax cash flow
- $-206/yr
For passive investors: Depreciation is non-cash, so a rental often shows a tax loss while cash-flowing — sheltering income. Rental losses are passive: they offset passive income freely, and up to $25,000/yr can offset ordinary (W-2) income if you actively participate and your MAGI is under $100k (phasing out to $0 by $150k); unused losses carry forward. On sale, claimed depreciation is recaptured at up to 25%, and gains may owe capital-gains tax (a 1031 exchange can defer both). Figures are a year-1 estimate at your 24.0% rate — not tax advice; consult a CPA.
Schools (NCES district)
- District
- Canton City
- NCES district ID
- 3904371
- Math proficiency
- 17% ▼ -17.00%
- Reading proficiency
- 26% ▼ -12.00%
- Median HH income
- $28,825
- Composite
- 17.1/100
- National rank
- #9116
- State rank
- #627 of 656 in OH
Livability — Canton
- Score
- 71/100
- State rank
- #441
- US rank
- #7259
Category grades
Schools grade is shown separately in the Schools card above.
Census & demographics
- Census place
- Canton, OH
- County
- Stark County · 272,865 people
- City population
- 103,614
- Metro
- Canton-Massillon, OH
- Population (ZIP)
- 24,285
- Household income
- $63,706
- Rent vs Own
- Severe rent burden
- 725.0
Population outlook (Stark County) Hauer SSP2
- Today (2025)
- 373,708 people
- By 2030
- 371,245 · -0.7%
- By 2040
- 361,331 · -3.3%
- By 2050
- 345,290 · -7.6%
- By 2075
- 302,669 · -19.0%
- By 2100
- 238,870 · -36.1%
Race, ethnicity, and origin ACS 2023
- Neighborhood character
- Predominantly White (80%)
- Race & ethnicity
- White 80% Black 8% Two or more races 8% Hispanic / Latino 4% Asian 3%
- Common ancestry
- Italian 8% Romanian 2% Slovak 2%
- Foreign-born
- 4% · Canada, South Korea, Vietnam
- Languages at home
- 95% English-only · Spanish 2% Other Indo-European 1% Tagalog/Filipino 1%
Political lean MEDSL · Stark
- 2024 margin
- Strong R (+21.9) · D 38.6% · R 60.5%
- 2008→2024 swing
- -27.4pp toward R · 2008: 5.5pp · 2024: -21.9pp
- All cycles
- 2024: R+21.9 2020: R+18.5 2016: R+17.4 2012: R+0.4 2008: D+5.5
Not yet ingested
- Civics
- —
Market trends
- HPI YoY
- ▼ -168.35%
- Current HPI
- 206.298
- Rent YoY
- ▲ 6.73%
- Metro
- Canton-Massillon, OH
- State GDP YoY
- ▲ 1.98%
- F500 in state
- 48
Industry mix (Fortune 500 HQ in OH)
| Industry | F500 HQs | Revenue |
|---|---|---|
| Insurance | 3 | $145B |
|
||
| Industrial Machinery | 3 | $49B |
|
||
| Financial Services | 3 | $24B |
|
||
| Consumer Goods | 2 | $93B |
|
||
| Aerospace / Defense | 2 | $47B |
|
||
| Utilities | 2 | $33B |
|
||
Price history
3 events — show timeline
- 2026-05-24 Pending — MLSNOW
- 2026-04-21 Contingent — MLSNOW
- 2026-04-18 Listed $145,900 MLSNOW
Property tax history
+1.6%/yrLatest (2024): $1,528 · -22.7% YoY. Source: county tax records.
Cash-flow waterfall
monthlySold comps — $/sqft
last 12 mo · ≤1 miLoading sold comps…