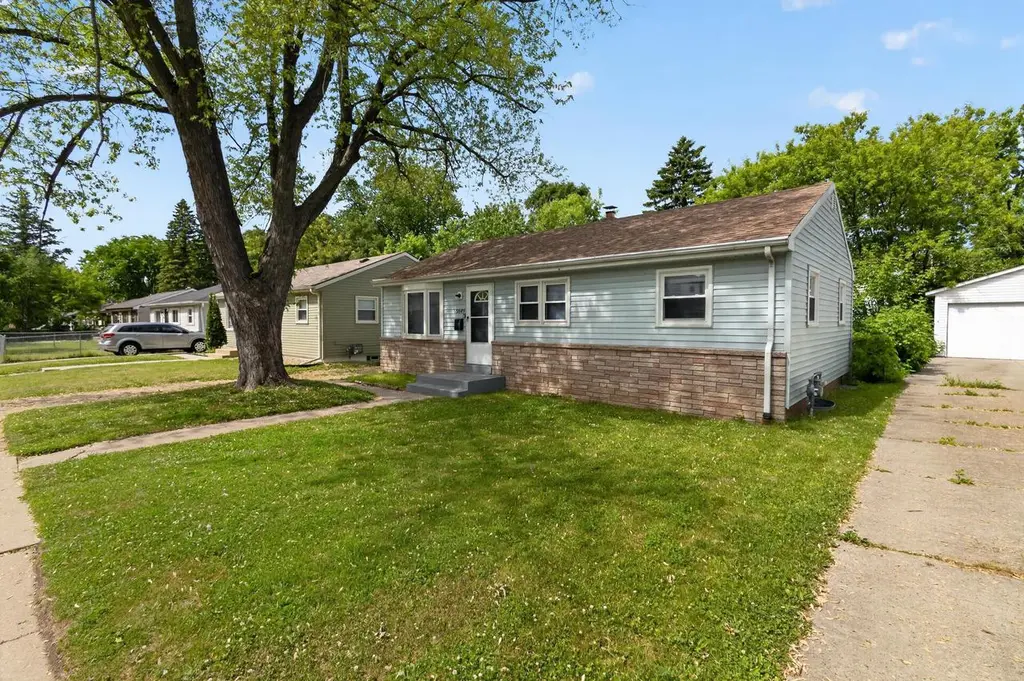
5849 N 62nd St · Milwaukee, WI
Flood risk 1/10 · Minimal
- FEMA flood zone
- X (unshaded)
- Chance of flooding over 30 yrs
- 0.0%
- Est. flood insurance / yr
- $473 – $860
Fire risk 1/10 · Minimal
- Est. fire insurance / yr
- $636 – $1,182
Heat risk 2/10 · Minimal
- Hot days now (above 100°F)
- 7 days/yr
- Hot days in 30 yrs
- 13 days/yr
Wind risk 2/10 · Minimal
- Chance of severe wind over 30 yrs
- —
Air-quality risk 2/10 · Minimal
- Unhealthy air days now
- 2 days/yr
- Unhealthy air days in 30 yrs
- 2 days/yr
Risk factors via First Street. Map © Google.
Why this score? — see what drove the D- grade
The composite is a weighted blend of 9 inputs, each scored 0–100. Each bar is that input's sub-score; the figure is the points it added to the 100-point composite (weight × sub-score).
- Cash flow +13.6/30.0
- ARV discount +4.6/15.0
- DSCR +4.1/10.0
- 1% rule +4.0/10.0
- Livability +4.0/5.0
- Rent growth +3.8/5.0
- Condition / age +2.5/5.0
- Schools +1.2/10.0
- Appreciation +0.0/10.0
$149,900
🖨 Deal sheet (PDF) 📄 Offer letter ✓ Due diligence
Listing remarks
Welcome to this charming Milwaukee home offering comfort, functionality, and convenience. The interior features a practical layout with inviting living spaces filled with natural light. The kitchen provides ample room for meal preparation and storage, while the bedrooms offer comfortable accommodations for a variety of living needs. Outside, the yard provides space for outdoor enjoyment, gardening, or entertaining. Conveniently located near schools, parks, shopping, dining, and major roadways, this property offers easy access to everyday amenities and commuting routes.
Key facts
- 6,098 sq ft lot
- Garage
- Built 1957
Tags
Property features AI
Exterior
- Parking: Detached 1-car garage
- Utilities: Municipal water; Municipal sewer; Natural gas
- Home design: Single-family, 1 story
- Construction: Information source lists year built in public records
- Exterior features: Vinyl exterior; Lot approximately 0.14 acres; Zoned residential
Interior
- Kitchen: Range; Refrigerator
- Bedrooms: Master bedroom on main level (10 x 11); Second bedroom on main level (8 x 11); Third bedroom on main level (12 x 9)
- Bathrooms: 1 full bathroom
- Heating & cooling: Central air
- Interior features: Full basement
- Laundry & utility: Natural gas heating
Neighborhood map
What this means for you Summary
Snapshot
- This is a 3-bed/1.0-bath single-family listed at $150k.
Deal economics
- At list price, monthly cash flow is $8 ($99/yr) — positive.
- The deal already cash-flows at list — no discount required.
- To meet the 1% rule (rent ≥ 1% of price), the offer needs to be $135k (9.7% below list).
- Recommended offer: $135k (9.7% below list) — sets the bar for 1% rule.
- Cap rate 6.4% vs local median 5.1% in Milwaukee — meaningfully above typical; check what's discounted (condition, days-on-market, listing class) to confirm the premium yield is real.
Location & tenants
- Location reads 81/100 on livability (#55 in WI, #1,534 nationally) — a professional / high-income tenant draw. Strengths: amenities A+, commute A+, cost of living A+; Watch: employment D+, crime F.
- Milwaukee School District (urban): math 10% / reading 18% proficiency, ranked #337 of 342 in WI (top 98%) — low school quality limits family demand, transient renter base, plan for 1-2y turnover; 77% free/reduced lunch — lower-income household profile, screen leases tightly.
- Zoned schools: Kluge Elementary (math 5% / reading 5%, grade F, #968 of 1,041 statewide, top 98%, 325 students, 90% FRL); James Madison Academic Campus (math 5% / reading 5%, grade F, #467 of 483 statewide, top 100%, 686 students, 89% FRL).
- Market conditions: Rents rising fast (+5.3%/yr); 152 active listings in the ZIP; 31 comparable units currently listed for rent nearby; rentals at typical pace (median 25d on market — plan ~3-4 weeks tenant-placement turnaround); 45% of comp listings sitting > 30 days — soft ceiling on asking rent; 1,017 units permitted in Milwaukee County in 2024 (803 in 5+ unit buildings).
- This rent runs 36% of the median local income ($46k/yr) — at the standard rent-burdened threshold; future hikes will face affordability resistance.
Forward outlook
- Local home prices are declining (-3.0%/yr); year-one equity from $1k of loan paydown is wiped out by about $4k of value loss. Plan a longer hold.
- Milwaukee County population projected at +4% by 2050 — modest demand growth; plan on rents tracking national, not racing it.
Negotiation context
- It's been on market 16 days — a 2% lower offer ($148k) is reasonable based on typical stale-listing flexibility.
- Current owner paid $67k; list at $150k implies a 124% gain — meaningful room to come down on a strong offer.
Risks & watch-outs
- Watch-outs: built in 1957 — expect roof / HVAC / electrical / plumbing capex.
Questions for the listing agent
- Built in 1957 — when were the roof, HVAC, electrical panel, plumbing, and water heater last replaced?
- Is there a deadline driving the sale (1031 exchange, divorce, estate, relocation)? That informs how much negotiation room exists.
- Schools are F-rated, which usually means shorter tenancies and higher turnover. Who's the typical renter profile here, and what's been the actual vacancy rate?
- Crime grade is F in this area — have there been break-ins, vandalism, or insurance claims at this property in the last 3 years? What carrier currently insures it and at what premium?
- The area grade is low — what's the realistic commute time and amenity access for the typical tenant pool here? Any planned neighborhood developments (good or bad) we should know about?
- What's the average days-on-market for RENTAL listings here right now (not sales)? A rising rental-DOM trend means longer vacancies and softer asking-rent achievability than the comps imply.
- What's the recent tenant-quality profile in this submarket — average credit score on applications, eviction rate, late-payment / NSF rate, and stable-employment percentage? A property-management company in the area should have these aggregated.
- How much new for-sale + rental construction is in the pipeline within 1–3 miles? Heavy new supply typically softens prices + rents 12–24 months out; constrained supply supports both.
Investment metrics
- 1% rule
- 0.90% ✗
- Cap rate
- 6.36%
- Cash-on-cash
- 0.24%
- DSCR
- 1.01
- GRM
- 9.2
CMA / ARV
- ARV (on-the-fly)
- $140,910
- Comps found
- 12
Show comp detail 12 sales within ~0.75 mi
| Address | Dist | Beds/Ba | Sqft | Sold | Price | $/sf | Match |
|---|---|---|---|---|---|---|---|
| 5863 N 62nd St | 0.02mi | 3/1.0 | 905 (-1%) | 1mo | $180,000 | $199 | 97 |
| 5919 N 67th St | 0.34mi | 3/1.0 | 988 (+8%) | 1mo | $155,000 | $157 | 70 |
| 5359 N 62nd St | 0.62mi | 3/1.0 | 936 (+2%) | 3mo | $111,375 | $119 | 65 |
| 5272 N 65th St | 0.74mi | 3/1.0 | 912 (-0%) | 1mo | $127,000 | $139 | 64 |
| 5729 N 56th St | 0.32mi | 4/1.0 (+1) | 1,026 (+12%) | 2mo | $125,000 | $122 | 59 |
| 5720 W Thurston Ave | 0.33mi | 2/1.0 (-1) | 792 (-13%) | 2mo | $164,900 | $208 | 56 |
| 5728 N 57th St | 0.29mi | 4/1.0 (+1) | 1,045 (+14%) | 3mo | $175,000 | $167 | 56 |
| 5351 N 55th St | 0.73mi | 3/1.0 | 845 (-8%) | 3mo | $128,000 | $151 | 51 |
| 5323 N 57 St | 0.71mi | 4/1.0 (+1) | 978 (+7%) | 2mo | $126,000 | $129 | 48 |
| 5525 N 52nd St | 0.68mi | 2/1.0 (-1) | 987 (+8%) | 2mo | $152,000 | $154 | 48 |
| 5353 N 56th St | 0.70mi | 3/3.0 | 832 (-9%) | 1mo | $125,000 | $150 | 44 |
| 5479 N 53rd St | 0.67mi | 3/2.0 | 1,037 (+13%) | 2mo | $214,000 | $206 | 41 |
Match score weights: distance 35% · size 25% · config 20% · recency 20%. Top-matched comps best support the ARV.
Projected returns pro-forma
-3.0% appreciation · 5.29% rent growth · sell at horizon
- IRR
- -13.3%
- Equity multiple
- 0.51×
- Total profit
- $-20,540
- Equity at exit
- $22,351
- IRR
- -1.1%
- Equity multiple
- 0.92×
- Total profit
- $-3,345
- Equity at exit
- $12,961
Cash invested: $41,972 (down + closing). Projections, not guarantees.
Landlord ↔ Tenant lean methodology
- Overall (STATE)
- 73 Landlord-Friendly
- State Wisconsin
- 73 Landlord-Friendly · R+2
- County
- — inherits STATE
- City
- — inherits STATE
ZIP-level market 53218
- Home prices YoY
- -19.0%
- Rents YoY
- 5.3%
- Active inventory
- 152
- Price-to-rent
- 9.2×
Monthly cashflow live
- Estimated rent
- $1,354 high interval (Pro) →
- Mortgage (P&I)
- −$786
- Tax from tax record
- −$213 /mo · $2,551/yr
- Insurance
- −$62
- HOA
- −$0
- Vacancy / Maint / Mgmt
- −$284
- Net cashflow
- $8
Break-even live
Sensitivity live
| Price | -10% $93 | -5% $51 | +0% $8 | +5% $-34 | +10% $-77 |
|---|---|---|---|---|---|
| Rent | -10% $-99 | -5% $-45 | +0% $8 | +5% $62 | +10% $115 |
| Rate | -1.0pp $84 | -0.5pp $46 | base $8 | +0.5pp $-31 | +1.0pp $-70 |
UW: 25.0% down · 7.5% · 30yr · 1.5% tax · 5.0% vac · 8.0% maint · 8.0% mgmt
Financing live
Cash to close
- Down payment
- $37,475
- Closing costs
- $4,497
- Reserves months
- —
- Total cash needed
- —
Loan-product check · same deal, 3 products live
Conventional
25% down · 7.5% · 30yr
- Down + closing
- —
- Monthly P&I
- —
- Monthly cashflow
- —
- DSCR
- —
- Eligible?
- —
Personal DTI + credit; lowest rate.
DSCR
20% down · 8.5% · 30yr
- Down + closing
- —
- Monthly P&I
- —
- Monthly cashflow
- —
- DSCR
- —
- Eligible?
- —
No personal income docs; deal must DSCR.
Hard money
10% down · 12.0% · 12mo
- Down + closing
- —
- Monthly P&I
- —
- Monthly cashflow
- —
- DSCR
- —
- Eligible?
- —
Short-term bridge; refi at stabilization.
Rent comps 31 comps
| Address | Beds | Baths | Sqft | Rent | $/sqft | DOM | Units | Dist |
|---|---|---|---|---|---|---|---|---|
| 5830 N 61st St Milwaukee, WI | 3.0 | 1.0 | 1024 | $1,450 | $1.42 | 45d | 1 | 0.10mi |
| 6026 W Carmen Ave Milwaukee, WI | 2.0 | 1.0 | 672 | $1,195 | $1.78 | 25d | 1 | 0.13mi |
| 5820 N 65th St #5822 Milwaukee, WI | 2.0 | 1.0 | 700 | $1,245 | $1.78 | 45d | 1 | 0.16mi |
| 5831 N 65th St Unit 5831 Milwaukee, WI | 3.0 | 1.0 | 900 | $1,195 | $1.33 | 45d | 1 | 0.18mi |
| 5823 N 65th St Unit Upper Milwaukee, WI | 2.0 | 1.0 | 768 | $1,295 | $1.69 | 45d | 1 | 0.18mi |
| 6221 W Thurston Ave #6223 Milwaukee, WI | 3.0 | 1.0 | 800 | $1,100 | $1.38 | 21d | 1 | 0.20mi |
| 5905 N 66th St Unit 66th Lower Milwaukee, WI | 3.0 | 1.0 | 1000 | $1,600 | $1.60 | 17d | 1 | 0.25mi |
| 5659 N 64th St Unit 5659A Milwaukee, WI | 2.0 | 1.0 | 1091 | $1,300 | $1.19 | 45d | 1 | 0.25mi |
| 5657 N 60th St #5659 Milwaukee, WI | 3.0 | 1.0 | 878 | $995 | $1.13 | 18d | 1 | 0.26mi |
| 5956 N 67th St Milwaukee, WI | 2.0 | 1.0 | 925 | $1,250 | $1.35 | 45d | 1 | 0.31mi |
| 5958 N 67th St Milwaukee, WI | 2.0 | 1.0 | 925 | $1,250 | $1.35 | 5d | 1 | 0.31mi |
| 5688 N 56th St Milwaukee, WI | 3.0 | 1.0 | 850 | $1,445 | $1.70 | 14d | 1 | 0.38mi |
| 5950 N 69th St Unit 1 Milwaukee, WI | 2.0 | 1.0 | 1100 | $1,100 | $1.00 | 45d | 1 | 0.43mi |
| 6535 N 58th St Milwaukee, WI | 2.0 | 1.0 | 962 | $1,195 | $1.24 | 18d | 1 | 0.90mi |
| 7632 W Leon Ter Unit C Milwaukee, WI | 2.0 | 1.5 | 1000 | $1,200 | $1.20 | 25d | 1 | 1.04mi |
| 5955 N 79th St Unit 1 Milwaukee, WI | 3.0 | 1.0 | 1100 | $1,650 | $1.50 | 45d | 1 | 1.07mi |
| 5908 N 80th St Milwaukee, WI | 3.0 | 1.0 | 1056 | $1,550 | $1.47 | 25d | 1 | 1.10mi |
| 8023 W Thurston Ave Unit 2 Milwaukee, WI | 2.0 | 1.0 | 850 | $850 | $1.00 | 45d | 1 | 1.17mi |
| 8037 W Thurston Ave Milwaukee, WI | 3.0 | 1.0 | 1040 | $1,600 | $1.54 | 45d | 1 | 1.19mi |
| 7348 W Medford Ave Unit 7348A Milwaukee, WI | 2.0 | 1.0 | 1095 | $950 | $0.87 | 25d | 1 | 1.19mi |
| 5696 N 42nd St Milwaukee, WI | 4.0 | 1.0 | 1023 | $1,495 | $1.46 | 25d | 1 | 1.26mi |
| 4610 W Eggert Pl #4612 Milwaukee, WI | 3.0 | 1.0 | 852 | $1,095 | $1.29 | 25d | 1 | 1.29mi |
| 6518 W Hampton Ave Unit 2 Milwaukee, WI | 2.0 | 1.0 | 1100 | $1,200 | $1.09 | 45d | 1 | 1.32mi |
| 5165-5167 N 45th St Unit 5165 Milwaukee, WI | 3.0 | 1.0 | 1020 | $1,200 | $1.18 | 18d | 1 | 1.33mi |
| 5050 N 47th St Milwaukee, WI | 2.0 | 1.0 | 1092 | $1,700 | $1.56 | 45d | 1 | 1.35mi |
| 4340 W Eggert Pl Milwaukee, WI | 4.0 | 1.0 | 1066 | $1,695 | $1.59 | 25d | 1 | 1.39mi |
| 4334 W Eggert Pl Milwaukee, WI | 4.0 | 1.0 | 1077 | $1,695 | $1.57 | 25d | 1 | 1.40mi |
| 4843 N 72nd St Milwaukee, WI | 3.0 | 1.0 | 1014 | $1,485 | $1.46 | 45d | 1 | 1.41mi |
| 5435 N 40th St Milwaukee, WI | 2.0 | 1.0 | 850 | $1,150 | $1.35 | 18d | 1 | 1.43mi |
| 6110 N 39th St Milwaukee, WI | 2.0 | 1.0 | 703 | $1,395 | $1.98 | 5d | 1 | 1.48mi |
| 6148 N 39th St Milwaukee, WI | 2.0 | 1.0 | 792 | $1,175 | $1.48 | 45d | 1 | 1.49mi |
Listing history 11 events
-
2026-06-21days on market $149,900 Active 16 DOM
-
2026-06-18days on market $149,900 Active 13 DOM
-
2026-06-17days on market $149,900 Active 12 DOM
-
2026-06-16days on market $149,900 Active 11 DOM
-
2026-06-15days on market $149,900 Active 10 DOM
-
2026-06-13days on market $149,900 Active 8 DOM
-
2026-06-13days on market $149,900 Active 7 DOM
-
2026-06-09days on market $149,900 Active 4 DOM
-
2026-06-08days on market $149,900 Active 3 DOM
-
2026-06-07remarks 575-char remark
-
2026-06-07$149,900 Active 2 DOM
ⓘ Source: listings_history table (triggers on properties + properties_extension) + one-shot
backfill from property_details.listing_events for pre-trigger history.
Tax reassessment forecast WI · Partial reset (capped growth)
- Current annual tax
- $2,551 · $213/mo
- Projected year-2 tax
- $2,662 · $222/mo
- Expected delta
- +$111/yr (+$9/mo · 4.4%)
ⓘ Screening estimate from a state-policy table — verify with the county assessor before closing.
Climate risk First Street
- Flood 1/10 Low FEMA zone X (unshaded) · 0% chance over 30 yrs
- Wildfire 1/10 Low
- Heat 2/10 Low 7 d/yr ≥100°F today · 13 d/yr by 30 yrs out
- Wind 2/10 Low
- Air quality 2/10 Low 2 unhealthy d/yr today · 2 by 30 yrs out
Nearby sold comps map
Loading sold comps map…
Walkable amenities ~0.75 mi
Loading nearby amenities…
Taxation est. · year 1
- Rental income
- $16,244
- − Mortgage interest
- −$8,397
- − Property taxes
- −$2,551
- − Insurance
- −$750
- − Repairs & maintenance
- −$1,299
- − Management
- −$1,299
- − Depreciation
- −$4,361
- Taxable loss
- −$2,413
- Est. tax savings @ 24.0%
- +$579
- After-tax cash flow
- $678/yr
For passive investors: Depreciation is non-cash, so a rental often shows a tax loss while cash-flowing — sheltering income. Rental losses are passive: they offset passive income freely, and up to $25,000/yr can offset ordinary (W-2) income if you actively participate and your MAGI is under $100k (phasing out to $0 by $150k); unused losses carry forward. On sale, claimed depreciation is recaptured at up to 25%, and gains may owe capital-gains tax (a 1031 exchange can defer both). Figures are a year-1 estimate at your 24.0% rate — not tax advice; consult a CPA.
Schools (NCES district)
- District
- Milwaukee School District
- NCES district ID
- 5509600
- Math proficiency
- 10% ▼ -5.00%
- Reading proficiency
- 18% ▬ 0.00%
- Median HH income
- $36,339
- Composite
- 11.61/100
- National rank
- #9696
- State rank
- #337 of 342 in WI
Livability — Milwaukee
- Score
- 81/100
- State rank
- #55
- US rank
- #1534
Category grades
Schools grade is shown separately in the Schools card above.
Census & demographics
- Census place
- Milwaukee, WI
- County
- Milwaukee County · 926,379 people
- City population
- 573,768
- Metro
- Milwaukee-Waukesha, WI
- Population (ZIP)
- 41,196
- Household income
- $45,642
- Rent vs Own
- Severe rent burden
- 2421.0
Population outlook (Milwaukee County) Hauer SSP2
- Today (2025)
- 995,758 people
- By 2030
- 1,009,124 · +1.3%
- By 2040
- 1,028,128 · +3.3%
- By 2050
- 1,040,066 · +4.4%
- By 2075
- 1,057,849 · +6.2%
- By 2100
- 1,039,774 · +4.4%
Race, ethnicity, and origin ACS 2023
- Neighborhood character
- Predominantly Black (72%)
- Race & ethnicity
- Black 72% Asian 10% White 10% Hispanic / Latino 5% Two or more races 3%
- Common ancestry
- Romanian 1% Lithuanian 1%
- Foreign-born
- 6% · Philippines, Canada
- Languages at home
- 89% English-only · Other Asian/Pacific 7% Spanish 3%
Political lean MEDSL · Milwaukee
- 2024 margin
- Solid D (+38.5) · D 68.3% · R 29.8% · Other 1.8%
- 2008→2024 swing
- +2.7pp toward D · 2008: 35.9pp · 2024: 38.5pp
- All cycles
- 2024: D+38.5 2020: D+39.9 2016: D+37.5 2012: D+34.6 2008: D+35.9
Not yet ingested
- Civics
- —
Market trends
- HPI YoY
- ▼ -76.44%
- Current HPI
- 325.1975
- Rent YoY
- ▲ 5.29%
- Metro
- Milwaukee-Waukesha, WI
- State GDP YoY
- ▲ 2.10%
- F500 in state
- 20
Industry mix (Fortune 500 HQ in WI)
| Industry | F500 HQs | Revenue |
|---|---|---|
| Industrial Machinery | 4 | $23B |
|
||
| Industrial Technology | 2 | $36B |
|
||
| Insurance | 1 | $36B |
|
||
| Professional Services | 1 | $19B |
|
||
| Utilities | 1 | $9B |
|
||
| Consumer Goods | 1 | $3B |
|
||
Price history
+294.5% since first listed4 events — show timeline
- 2026-06-05 Listed $149,900 METROMLS
- 2020-07-21 Sold (Public Records) $67,000 Public Records
- 1995-09-01 Sold (Public Records) $37,000 Public Records
- 1984-08-01 Sold (Public Records) $38,000 Public Records
Property tax history
+2.9%/yrLatest (2024): $2,551 · -25.5% YoY. Source: county tax records.
Cash-flow waterfall
monthlySold comps — $/sqft
last 12 mo · ≤1 miLoading sold comps…