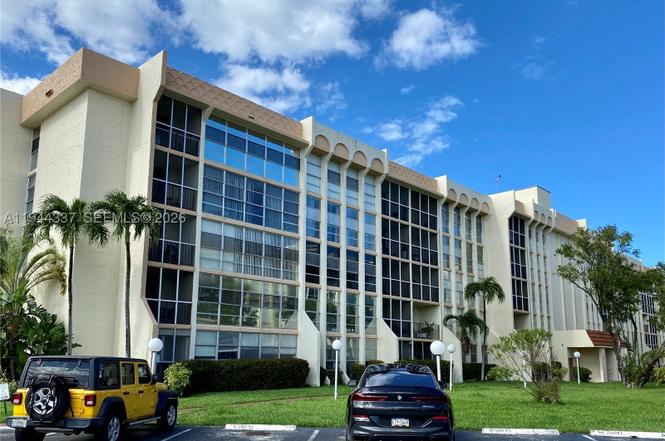
851 Three Islands Blvd #106 · Hallandale Beach, FL
Flood risk 7/10 · Major
- FEMA flood zone
- AE
- Chance of flooding over 30 yrs
- 0.76%
- Est. flood insurance / yr
- $1,737 – $8,500
Fire risk 1/10 · Minimal
- Est. fire insurance / yr
- $947 – $1,759
Heat risk 10/10 · Severe
- Hot days now (above 104°F)
- 7 days/yr
- Hot days in 30 yrs
- 27 days/yr
Wind risk 10/10 · Severe
- Chance of severe wind over 30 yrs
- 99.0%
Air-quality risk 2/10 · Minimal
- Unhealthy air days now
- 1 days/yr
- Unhealthy air days in 30 yrs
- 2 days/yr
Risk factors via First Street. Map © Google.
Why this score? — see what drove the B grade
The composite is a weighted blend of 9 inputs, each scored 0–100. Each bar is that input's sub-score; the figure is the points it added to the 100-point composite (weight × sub-score).
- Cash flow +30.0/30.0
- 1% rule +10.0/10.0
- DSCR +10.0/10.0
- ARV discount +7.5/15.0
- Schools +4.1/10.0
- Livability +4.0/5.0
- Rent growth +2.6/5.0
- Condition / age +2.5/5.0
- Appreciation +0.0/10.0
$173,000
🖨 Deal sheet 📄 Offer letter ✓ Due diligence
Listing remarks
GREAT INVESTMENT!!! * * * Beautiful 1BD/1 BATH apartment located in heart of Hallandale Beach * * * Upgraded kitchen and bathroom, tile floors, NEW vinyl flooring in the bedroom, walk-in closet, large bedroom, freshly painted * * * Building offers a heated pool, clubhouse, tennis courts. Located across the street from the park and playground for kids. Less than a mile from the beach. Walking distance to the shopping plazas, restaurants, Walmart, Publix, Starbucks and CVS. GREAT LOCATION! * * CAN BE RENTED RIGHT AWAY AFTER THE CLOSING * * * Currently tenant occupied UNTIL October 25, 2026 ($1,750/month)
Key facts
- Clubhouse
- Upgraded kitchen
- Tennis courts
Tags
Property features AI
Finance
- Other: Association-managed pool
- Financial info: Lease considered; No pets allowed
- HOA & community: Monthly association fee; Association fee covers amenities, common areas, cable TV, hot water, parking, pool(s), sewer, trash, and water; Community amenities include clubhouse, elevators, pool, and tennis courts
Exterior
- Parking: Assigned parking (1 space); Covered parking (1 space); 1-car garage
- Security: Closed-circuit cameras; Fire alarm; Smoke detectors
- Utilities: Cable available
- Home design: Condo/Apartment (5-story building); Entry on level 1
- Construction: Block construction
- Exterior features: Balcony; Open balcony/patio
Interior
- Kitchen: Dishwasher; Electric range; Microwave; Refrigerator
- Bedrooms: Bedroom on main level
- Flooring: Laminate flooring; Tile flooring
- Bathrooms: 1 full bathroom
- Heating & cooling: Central heating; Central air conditioning
- Interior features: Kitchen island; Combined living/dining area; Walk-in closet(s)
Neighborhood map
What this means for you Summary
Snapshot
- This is a 1-bed/1.0-bath condo listed at $173k.
Deal economics
- At list price, monthly cash flow is $843 ($10k/yr) — positive.
- The deal already cash-flows at list — no discount required.
- Meets the 1% rule at list price ($4k rent vs $173k).
- Recommended offer: $152k (12.0% below list) — sets the bar for market timing.
- Cap rate 15.1% vs local median 5.2% in Hallandale Beach — top-decile yield for the area; either an underpriced asset or a hidden risk that comps aren't pricing in. Stress-test before assuming the spread holds.
Location & tenants
- Location reads 81/100 on livability (#86 in FL, #1,400 nationally) — a professional / high-income tenant draw. Strengths: commute A+, health & safety A+, crime B+; Watch: schools C-, employment D-.
- Broward (suburban): math 42% / reading 53% proficiency, ranked #46 of 73 in FL (top 63%) — families likely to look elsewhere, expect single-tenant / working-renter base with shorter leases.
- Market conditions: Rents flat; 1373 active listings in the ZIP; 40 comparable units currently listed for rent nearby; rentals at typical pace (median 20d on market — plan ~3-4 weeks tenant-placement turnaround); 2,111 units permitted in Broward County in 2024 (1,265 in 5+ unit buildings).
- At $3,953/mo this rent would consume 91% of the median local household income ($52k/yr) (locally 3293% of renters already pay >50% of income on rent) — very limited rent-growth headroom before tenants either downsize or default.
Forward outlook
- Local home prices are declining (-3.0%/yr); year-one equity from $1k of loan paydown is wiped out by about $5k of value loss. Plan a longer hold.
- Broward County population projected at +34% by 2050 — long-run rental-demand tailwind backs the buy-and-hold thesis.
- At projected returns (-3.0% appreciation + 0.4% rent growth), your $48k cash investment doubles in ~8 years — after that, you're playing with house money.
Negotiation context
- It's been on market 157 days — a 12% lower offer ($152k) is reasonable based on typical stale-listing flexibility.
- 8 sale attempts since 13y ago; this cycle's ask has dropped $10k (5%) from the opening price — seller is motivated, your offer sets the floor, not the list.
Risks & watch-outs
- Watch-outs: flood insurance adds $427/mo.
- Climate carrying-cost: in FEMA flood zone AE (mandatory federal flood insurance); severe wind risk, 99% chance of damaging wind over 30y; extreme-heat days projected 7→27/yr by 2055 (HVAC capex compounding) — expect insurance premiums to compound above CPI over the hold.
Questions for the listing agent
- It's been on market 157 days. Have you received any prior offers? Is the seller open to a 12% concession, seller financing, or rate buy-down credit?
- Built in 1975 — when were the roof, HVAC, electrical panel, plumbing, and water heater last replaced?
- What's the actual annual flood-insurance premium (NFIP or private), and is the property in a SFHA with mandatory coverage?
- What does the HOA fee cover, when was the last increase, and are there any pending special assessments or reserve-fund shortfalls?
- Any open or pending special assessments — roof, HVAC, plumbing, elevator, façade? What's the per-unit balance and payoff schedule, and is the seller paying it off at close or rolling it to the buyer?
- Why hasn't it sold? Are there any deal-killer items the seller is aware of (foundation, flood, title, zoning, code violations)?
- Is there a deadline driving the sale (1031 exchange, divorce, estate, relocation)? That informs how much negotiation room exists.
- What's the average days-on-market for RENTAL listings here right now (not sales)? A rising rental-DOM trend means longer vacancies and softer asking-rent achievability than the comps imply.
- What's the recent tenant-quality profile in this submarket — average credit score on applications, eviction rate, late-payment / NSF rate, and stable-employment percentage? A property-management company in the area should have these aggregated.
- How much new apartment / multifamily construction is in the pipeline within 1–3 miles? Heavy new supply (>2% of stock underway) typically softens rents 12–24 months out; light construction supports rent growth.
Investment metrics
- 1% rule
- 2.28% ✓
- Cap rate
- 15.10%
- Cash-on-cash
- 31.44%
- DSCR
- 2.40
- GRM
- 3.6
CMA / ARV
No comps found within radius.
Projected returns pro-forma
-3.0% appreciation · 0.43% rent growth · sell at horizon
- IRR
- 9.0%
- Equity multiple
- 1.34×
- Total profit
- $16,400
- Equity at exit
- $25,795
- IRR
- 14.7%
- Equity multiple
- 1.98×
- Total profit
- $47,500
- Equity at exit
- $14,958
Cash invested: $48,440 (down + closing). Projections, not guarantees.
Landlord ↔ Tenant lean methodology
- Overall (STATE)
- 87 Strongly Landlord-Friendly
- State Florida
- 87 Strongly Landlord-Friendly · R+3
- County
- — inherits STATE
- City
- — inherits STATE
ZIP-level market 33009
- Rents YoY
- 0.4%
- Active inventory
- 1373
- Price-to-rent
- 3.6×
Monthly cashflow live
- Estimated rent
- $3,953 high interval (Pro) →
- Mortgage (P&I)
- −$907
- Tax from tax record
- −$333 /mo · $3,999/yr
- Insurance
- −$72
- Flood insurance flood zone
- −$427 /mo · $5,118/yr
- HOA
- −$541
- Vacancy / Maint / Mgmt
- −$830
- Net cashflow
- $843
Break-even live
UW: 25.0% down · 7.5% · 30yr · 1.5% tax · 5.0% vac · 8.0% maint · 8.0% mgmt
Financing live
Cash to close
- Down payment
- $43,250
- Closing costs
- $5,190
- Reserves months
- —
- Total cash needed
- —
Loan-product check · same deal, 3 products live
Conventional
25% down · 7.5% · 30yr
- Down + closing
- —
- Monthly P&I
- —
- Monthly cashflow
- —
- DSCR
- —
- Eligible?
- —
Personal DTI + credit; lowest rate.
DSCR
20% down · 8.5% · 30yr
- Down + closing
- —
- Monthly P&I
- —
- Monthly cashflow
- —
- DSCR
- —
- Eligible?
- —
No personal income docs; deal must DSCR.
Hard money
10% down · 12.0% · 12mo
- Down + closing
- —
- Monthly P&I
- —
- Monthly cashflow
- —
- DSCR
- —
- Eligible?
- —
Short-term bridge; refi at stabilization.
Rent comps 40 comps
| Address | Beds | Baths | Sqft | Rent | $/sqft | DOM | Units | Dist |
|---|---|---|---|---|---|---|---|---|
| 101 Diplomat Pkwy Hallandale Beach, FL | 1.0 | 1.0 | 859 | $3,740 | $4.35 | 24d | 1 | 0.52mi |
| 3505 S Ocean Dr Hollywood, FL | 1.0–2.0 | 1.5–2.0 | 1085 | $3,900 | $3.59 | 13d | 17 | 0.58mi |
| 3505 S Ocean Dr Hollywood, FL | 1.0–2.0 | 1.5–2.0 | 1085 | $3,600 | $3.32 | 10d | 18 | 0.58mi |
| 3505 S Ocean Dr Unit 1049820P Hollywood, FL | 1.0 | 1.0 | 785 | $4,827 | $6.15 | 3d | 1 | 0.59mi |
| 2501 S Ocean Dr Hollywood, FL | 1.0–2.0 | 1.0–2.0 | 971 | $3,800 | $3.91 | 19d | 8 | 0.61mi |
| 2501 S Ocean Dr Hollywood, FL | 1.0–2.0 | 1.0–2.0 | 971 | $4,200 | $4.32 | 14d | 7 | 0.61mi |
| 2501 S Ocean Dr Hollywood, FL | 1.0–2.0 | 1.0–2.0 | 971 | $4,000 | $4.12 | 8d | 7 | 0.61mi |
| 2501 S Ocean Dr Hollywood, FL | 1.0–2.0 | 1.0–2.0 | 971 | $4,400 | $4.53 | 10d | 6 | 0.61mi |
| 3725 S Ocean Dr Hollywood, FL | 2.0–3.0 | 2.0 | 1377 | $4,000 | $2.90 | 3d | 7 | 0.66mi |
| 3725 S Ocean Dr Hollywood, FL | 2.0–3.0 | 2.0 | 1377 | $4,000 | $2.90 | 14d | 8 | 0.66mi |
| 4010 S Ocean Dr Hollywood, FL | 1.0–3.0 | 1.0–3.5 | 1078 | $5,000 | $4.64 | 24d | 5 | 0.67mi |
| 2601 E Hallandale Beach Blvd Unit 1227344P Hallandale Beach, FL | 1.0–2.0 | 1.0–2.0 | 844 | $2,465 | $2.92 | 2d | 2 | 0.67mi |
| 2602 E Hallandale Beach Blvd Hallandale Beach, FL | 1.0–2.0 | 1.0–2.0 | 1092 | $4,750 | $4.35 | 24d | 3 | 0.68mi |
| 2602 E Hallandale Beach Blvd Hallandale Beach, FL | 1.0–2.0 | 1.0–2.0 | 1070 | $4,219 | $3.94 | 21d | 4 | 0.68mi |
| 2602 E Hallandale Beach Blvd Hallandale Beach, FL | 3.0 | 1.0–3.0 | 1011 | $3,862 | $3.82 | 2d | 5 | 0.68mi |
| 2600 E Hallandale Beach Blvd Unit T3208 Hallandale Beach, FL | 2.0 | 2.0 | 1030 | $6,950 | $6.75 | 24d | 1 | 0.68mi |
| 2600 E Hallandale Beach Blvd Unit T3110 Hallandale Beach, FL | 2.0 | 2.0 | 1028 | $3,650 | $3.55 | 24d | 1 | 0.68mi |
| 2600 E Hallandale Beach Blvd Unit T3307 Hallandale Beach, FL | 2.0 | 2.0 | 1030 | $4,500 | $4.37 | 24d | 1 | 0.68mi |
| 4010 S Ocean Dr Unit 1388506P Hollywood, FL | 2.0 | 2.0 | 1097 | $4,881 | $4.45 | 8d | 1 | 0.69mi |
| 4010 S Ocean Dr Unit 1227485P Hollywood, FL | 2.0–3.0 | 2.0 | 1118 | $5,049 | $4.51 | 15d | 2 | 0.69mi |
| 4010 S Ocean Dr Unit R2102 Hollywood, FL | 2.0 | 2.0 | 1075 | $6,500 | $6.05 | 24d | 1 | 0.69mi |
| 4010 S Ocean Dr Unit T3609 Hollywood, FL | 2.0 | 2.0 | 1060 | $6,300 | $5.94 | 24d | 1 | 0.69mi |
| 4010 S Ocean Dr Unit T3609 Hollywood, FL | 2.0 | 2.0 | 1060 | $6,300 | $5.94 | 3d | 1 | 0.69mi |
| 4010 S Ocean Dr Unit T3509 Hollywood, FL | 2.0 | 2.0 | 1060 | $6,000 | $5.66 | 22d | 1 | 0.69mi |
| 3801 S Ocean Dr Unit 4R Hollywood, FL | 1.0 | 1.0 | 812 | $3,850 | $4.74 | 24d | 1 | 0.69mi |
| 2721 E Hallandale Beach Blvd Unit 1049818P Hollywood, FL | 1.0–2.0 | 1.0–2.0 | 946 | $3,355 | $3.54 | 4d | 2 | 0.70mi |
| 3901 S Ocean Dr Unit 11M Hollywood, FL | 1.0 | 1.0 | 874 | $4,400 | $5.03 | 4d | 1 | 0.72mi |
| 3901 S Ocean Dr Unit 10Z Hollywood, FL | 1.0 | 1.0 | 874 | $4,000 | $4.58 | 4d | 1 | 0.72mi |
| 3901 S Ocean Dr Unit 10Z Hollywood, FL | 1.0 | 1.0 | 874 | $4,000 | $4.58 | 24d | 1 | 0.72mi |
| 3901 S Ocean Dr Unit 11M Hollywood, FL | 1.0 | 1.0 | 874 | $4,400 | $5.03 | 24d | 1 | 0.72mi |
| 3901 S Ocean Dr Unit 1227197P Hollywood, FL | 1.0–2.0 | 1.0–2.0 | 1054 | $2,727 | $2.59 | 2d | 2 | 0.72mi |
| 3901 S Ocean Dr Unit 10M Hollywood, FL | 1.0 | 1.0 | 874 | $5,000 | $5.72 | 24d | 1 | 0.72mi |
| 4001 S Ocean Dr Hollywood, FL | 2.0–3.0 | 1.5–3.0 | 1471 | $4,000 | $2.72 | 22d | 4 | 0.74mi |
| 4001 S Ocean Dr Hollywood, FL | 2.0–3.0 | 1.5–3.0 | 1471 | $4,800 | $3.26 | 24d | 3 | 0.74mi |
| 4111 S Ocean Dr Unit 1557596P Hollywood, FL | 1.0 | 1.0 | 796 | $5,356 | $6.73 | 8d | 1 | 0.77mi |
| 4111 S Ocean Dr Unit 1022181P Hollywood, FL | 1.0–2.0 | 1.0–2.0 | 968 | $4,407 | $4.55 | 17d | 2 | 0.77mi |
| 4111 S Ocean Dr #1810 Hollywood, FL | 1.0 | 1.0 | 1000 | $5,500 | $5.50 | 24d | 1 | 0.77mi |
| 1800 S Ocean Dr #909 Hallandale Beach, FL | 2.0 | 1.0 | 1086 | $4,000 | $3.68 | 24d | 1 | 0.84mi |
| 1800 S Ocean Dr #4209 Hallandale Beach, FL | 2.0 | 1.0 | 1086 | $4,000 | $3.68 | 21d | 1 | 0.84mi |
| 1800 S Ocean Dr #4209 Hallandale Beach, FL | 2.0 | 1.0 | 1086 | $4,000 | $3.68 | 2d | 1 | 0.84mi |
HOA detail condo
- Monthly dues
- $541 · $6,492/yr
- Likely covers
- pool
- Assessments
- None detected in remarks — confirm with the listing agent.
Listing history 42 events
-
2026-06-18days on market $173,000 Active 157 DOM
-
2026-06-17days on market $173,000 Active 156 DOM
-
2026-06-16days on market $173,000 Active 155 DOM
-
2026-06-15remarks 620-char remark
-
2026-06-15days on market $173,000 Active 154 DOM
-
2026-06-13days on market $173,000 Active 152 DOM
-
2026-06-09days on market $173,000 Active 148 DOM
-
2026-06-07days on market $173,000 Active 146 DOM
-
2026-06-04days on market $173,000 Active 143 DOM
-
2026-06-03days on market $173,000 Active 142 DOM
-
2026-06-02days on market $173,000 Active 141 DOM
-
2026-06-01days on market $173,000 Active 140 DOM
-
2026-05-31days on market $173,000 Active 139 DOM
-
2026-04-28price $173,000
-
2026-04-10price $170,000
-
2026-03-03price $179,000
-
2026-01-12$183,000 Active
-
2025-12-11historical
-
2025-09-23price $195,000
-
2025-04-19historical $1,750
-
2025-03-25price $1,750
-
2025-03-24price $199,000
-
2025-03-21price $1,850
-
2025-03-05price $209,000
-
2025-02-14price $214,000
-
2025-02-01$1,950
-
2025-01-07historical $1,950
-
2025-01-02$219,000 Active
-
2024-12-27$1,950
-
2023-09-05status Active
-
2023-05-30$248,000 Active
-
2022-04-14soldstatus $195,000
-
2018-08-21soldstatus $142,000
-
2018-07-13soldstatus $142,000 Sold
-
2018-06-05status Pending
-
2018-03-28price $149,500
-
2017-11-07$165,000 Active
-
2013-12-09historical
-
2013-09-04$150,000 Active
-
2011-07-05soldstatus $62,000
-
2002-08-21soldstatus $83,900
-
1994-11-04soldstatus $32,000
ⓘ Source: listings_history table (triggers on properties + properties_extension) + one-shot
backfill from property_details.listing_events for pre-trigger history.
Tax reassessment forecast FL · Resets to sale price
- Current annual tax
- $3,999 · $333/mo
- Projected year-2 tax
- $3,999 · $333/mo
- Expected delta
- $0/yr ($0/mo · 0.0%)
ⓘ Screening estimate from a state-policy table — verify with the county assessor before closing.
Climate risk First Street
- Flood 7/10 Severe FEMA zone AE · 76% chance over 30 yrs
- Wildfire 1/10 Low
- Heat 10/10 Extreme 7 d/yr ≥104°F today · 27 d/yr by 30 yrs out
- Wind 10/10 Extreme 99% chance of damaging wind over 30 yrs
- Air quality 2/10 Low 1 unhealthy d/yr today · 2 by 30 yrs out
Nearby sold comps map
Loading sold comps map…
Walkable amenities ~0.75 mi
Loading nearby amenities…
Taxation est. · year 1
- Rental income
- $47,436
- − Mortgage interest
- −$9,691
- − Property taxes
- −$3,999
- − Insurance
- −$5,984
- − Repairs & maintenance
- −$3,795
- − Management
- −$3,795
- − HOA
- −$6,492
- − Depreciation
- −$5,033
- Taxable income
- $8,648
- Est. tax owed @ 24.0%
- −$2,075
- After-tax cash flow
- $8,037/yr
For passive investors: Depreciation is non-cash, so a rental often shows a tax loss while cash-flowing — sheltering income. Rental losses are passive: they offset passive income freely, and up to $25,000/yr can offset ordinary (W-2) income if you actively participate and your MAGI is under $100k (phasing out to $0 by $150k); unused losses carry forward. On sale, claimed depreciation is recaptured at up to 25%, and gains may owe capital-gains tax (a 1031 exchange can defer both). Figures are a year-1 estimate at your 24.0% rate — not tax advice; consult a CPA.
Schools (NCES district)
- District
- Broward
- NCES district ID
- 1200180
- Math proficiency
- 42% ▼ -18.00%
- Reading proficiency
- 53% ▼ -5.00%
- Median HH income
- $52,139
- Composite
- 40.88/100
- National rank
- #3621
- State rank
- #46 of 73 in FL
Livability — Hallandale Beach
- Score
- 81/100
- State rank
- #86
- US rank
- #1400
Category grades
Schools grade is shown separately in the Schools card above.
Census & demographics
- Census place
- Hallandale Beach, FL
- County
- Broward County · 1,963,430 people
- City population
- 44,021
- Metro
- Miami-Fort Lauderdale-Pompano Beach, FL
- Population (ZIP)
- 44,502
- Household income
- $52,079
- Rent vs Own
- Severe rent burden
- 3293.0
Population outlook (Broward County) Hauer SSP2
- Today (2025)
- 2,207,033 people
- By 2030
- 2,360,704 · +7.0%
- By 2040
- 2,661,208 · +20.6%
- By 2050
- 2,946,698 · +33.5%
- By 2075
- 3,602,273 · +63.2%
- By 2100
- 3,970,984 · +79.9%
Race, ethnicity, and origin ACS 2023
- Neighborhood character
- Diverse neighborhood (Simpson 0.67)
- Race & ethnicity
- Hispanic / Latino 39% White 39% Two or more races 24% Black 17% Asian 1%
- Hispanic origin (detail)
- Mexican 2% Puerto Rican 3% Cuban 9% Dominican 3% Salvadoran 2%
- Common ancestry
- Scotch-Irish 5% Hispanic 5% Subsaharan African 3%
- Foreign-born
- 51% · Canada, Jamaica, Dominican Republic
- Languages at home
- 38% English-only · Spanish 36% Russian/Polish/Slavic 12% French/Haitian/Cajun 7%
Political lean MEDSL · Broward
- 2024 margin
- D (+17.0) · D 58.0% · R 41.0%
- 2008→2024 swing
- -17.8pp toward R · 2008: 34.7pp · 2024: 17.0pp
- All cycles
- 2024: D+17.0 2020: D+29.8 2016: D+35.0 2012: D+34.9 2008: D+34.7
Not yet ingested
- Civics
- —
Market trends
- HPI YoY
- ▼ -299.13%
- Current HPI
- 329.9081
- Rent YoY
- ▲ 0.43%
- Metro
- Miami-Fort Lauderdale-Pompano Beach, FL
- State GDP YoY
- ▲ 3.28%
- F500 in state
- 36
Industry mix (Fortune 500 HQ in FL)
| Industry | F500 HQs | Revenue |
|---|---|---|
| Industrial Technology | 2 | $29B |
|
||
| Insurance | 2 | $17B |
|
||
| Retail | 1 | $60B |
|
||
| Technology Distribution | 1 | $58B |
|
||
| Homebuilding | 1 | $35B |
|
||
| Technology Manufacturing | 1 | $35B |
|
||
Price history
+440.6% since first listed29 events — show timeline
- 2026-04-28 Price Changed $173,000 MARMLS
- 2026-04-10 Price Changed $170,000 MARMLS
- 2026-03-03 Price Changed $179,000 MARMLS
- 2026-01-12 Listed $183,000 MARMLS
- 2025-12-11 Listing Removed — MARMLS
- 2025-09-23 Price Changed $195,000 MARMLS
- 2025-04-19 Rental Removed $1,750 MARMLS
- 2025-03-25 Price Changed $1,750 MARMLS
- 2025-03-24 Price Changed $199,000 MARMLS
- 2025-03-21 Price Changed $1,850 MARMLS
- 2025-03-05 Price Changed $209,000 MARMLS
- 2025-02-14 Price Changed $214,000 MARMLS
- 2025-02-01 Listed for Rent $1,950 MARMLS
- 2025-01-07 Rental Removed $1,950 MARMLS
- 2025-01-02 Listed $219,000 MARMLS
- 2024-12-27 Listed for Rent $1,950 MARMLS
- 2023-09-05 Relisted — MARMLS
- 2023-05-30 Listed $248,000 MARMLS
- 2022-04-14 Sold (Public Records) $195,000 Public Records
- 2018-08-21 Sold (Public Records) $142,000 Public Records
- 2018-07-13 Sold (MLS) $142,000 MARMLS
- 2018-06-05 Pending — MARMLS
- 2018-03-28 Price Changed $149,500 MARMLS
- 2017-11-07 Listed $165,000 MARMLS
- 2013-12-09 Listing Removed — MARMLS
- 2013-09-04 Listed $150,000 MARMLS
- 2011-07-05 Sold (MLS) $62,000 MARMLS
- 2002-08-21 Sold (Public Records) $83,900 Public Records
- 1994-11-04 Sold (Public Records) $32,000 Public Records
Property tax history
+8.2%/yrLatest (2025): $3,999 · -5.8% YoY. Source: county tax records.
Cash-flow waterfall
monthlySold comps — $/sqft
last 12 mo · ≤1 miLoading sold comps…