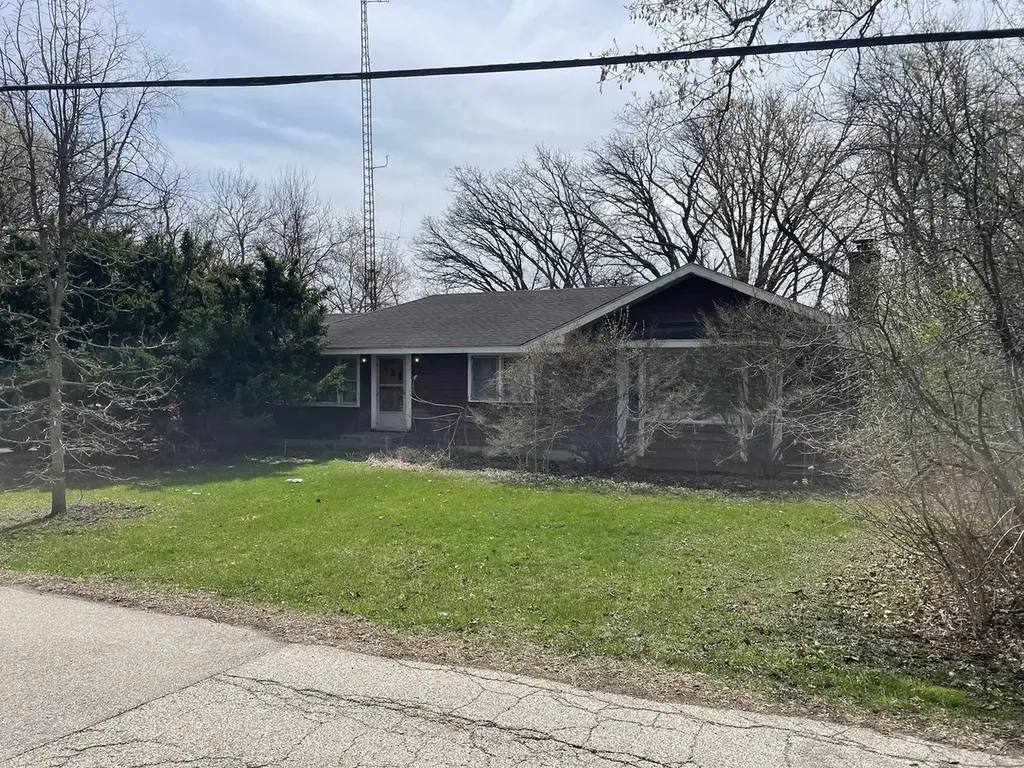
1613 South St · Prairie Grove, IL
Flood risk 1/10 · Minimal
- FEMA flood zone
- X (unshaded)
- Chance of flooding over 30 yrs
- 0.0%
- Est. flood insurance / yr
- $507 – $1,088
Fire risk 1/10 · Minimal
- Est. fire insurance / yr
- $804 – $1,492
Heat risk 2/10 · Minimal
- Hot days now (above 100°F)
- 7 days/yr
- Hot days in 30 yrs
- 14 days/yr
Wind risk 2/10 · Minimal
- Chance of severe wind over 30 yrs
- 0.0%
Air-quality risk 2/10 · Minimal
- Unhealthy air days now
- 1 days/yr
- Unhealthy air days in 30 yrs
- 2 days/yr
Risk factors via First Street. Map © Google.
Why this score? — see what drove the C+ grade
The composite is a weighted blend of 9 inputs, each scored 0–100. Each bar is that input's sub-score; the figure is the points it added to the 100-point composite (weight × sub-score).
- Cash flow +20.8/30.0
- ARV discount +15.0/15.0
- DSCR +6.6/10.0
- 1% rule +5.2/10.0
- Schools +3.9/10.0
- Rent growth +3.5/5.0
- Livability +2.9/5.0
- Condition / age +2.5/5.0
- Appreciation +0.0/10.0
$200,000
🖨 Deal sheet (PDF) 📄 Offer letter ✓ Due diligence
Listing remarks
Estate Sale Sold AS-IS
Key facts
- 0.34 acre lot
- 2 garage spots
- Built 1989
Property features AI
Finance
- Other: Parcel numbers on file
- HOA & community: HOA fee approximately $60 (includes other services)
Exterior
- Parking: Detached garage; Gravel parking areas; 2 garage spaces, 4 parking spaces total
- Utilities: Well water; Septic tank
- Home design: Detached single-family home; One-story layout; Fee simple ownership with HOA
- Construction: Cedar construction; Estimated age 31–40 years; Not rebuilt or rehabilitated
- Exterior features: Lot dimensions approximately 100 x 150; Less than 0.25-acre lot; School bus service available
Interior
- Kitchen: Kitchen (11 x 13, main level); Range; Refrigerator
- Bedrooms: Master bedroom (15 x 20, main level) with full bath; Second bedroom (10 x 11, main level); Additional bedrooms listed
- Bathrooms: 2 full bathrooms
- Heating & cooling: Natural gas heating; Central air conditioning
- Interior features: 7 total rooms; Unfinished partial basement; Office (10 x 10, main level)
- Laundry & utility: Main-level laundry; Washer; Dryer
Neighborhood map
What this means for you Summary
Snapshot
- This is a 2-bed/2.0-bath single-family listed at $200k.
Deal economics
- At list price, monthly cash flow is $273 ($3k/yr) — positive.
- The deal already cash-flows at list — no discount required.
- Meets the 1% rule at list price ($2k rent vs $200k).
Location & tenants
- Location reads 58/100 on livability (#1,107 in IL) — a working-class tenant base; expect higher turnover. Strengths: employment A+, housing A+, crime A; Watch: amenities F, commute F, cost of living F.
- Chsd 155 (suburban): math 41% / reading 42% proficiency, ranked #98 of 620 in IL (top 16%) — families likely to look elsewhere, expect single-tenant / working-renter base with shorter leases.
- Zoned schools: Prairie Grove Elem School (math 27% / reading 37%, grade F, #586 of 2,056 statewide, top 31%, 492 students, 0% FRL); Prairie Grove Junior High School (math 22% / reading 42%, grade F, #226 of 665 statewide, top 34%, 321 students, 0% FRL); Prairie Ridge High School (math 52% / reading 51%, grade D+, #38 of 693 statewide, top 6%, 1,140 students, 0% FRL).
- Market conditions: Rents rising (+3.9%/yr); 150 active listings in the ZIP; 1 comparable units currently listed for rent nearby; solid renter incomes; 1,595 units permitted in McHenry County in 2024 (485 in 5+ unit buildings).
Forward outlook
- Local home prices are declining (-3.0%/yr); year-one equity from $1k of loan paydown is wiped out by about $6k of value loss. Plan a longer hold.
- McHenry County population projected at -12% by 2050 — secular population decline; favor cash flow + early exit over multi-decade hold.
Negotiation context
- Only 1 days on market — expect competitive offers; lowballing is unlikely to land.
Questions for the listing agent
- Is there a deadline driving the sale (1031 exchange, divorce, estate, relocation)? That informs how much negotiation room exists.
- What's the average days-on-market for RENTAL listings here right now (not sales)? A rising rental-DOM trend means longer vacancies and softer asking-rent achievability than the comps imply.
- What's the recent tenant-quality profile in this submarket — average credit score on applications, eviction rate, late-payment / NSF rate, and stable-employment percentage? A property-management company in the area should have these aggregated.
- How much new for-sale + rental construction is in the pipeline within 1–3 miles? Heavy new supply typically softens prices + rents 12–24 months out; constrained supply supports both.
Investment metrics
- 1% rule
- 1.02% ✓
- Cap rate
- 7.93%
- Cash-on-cash
- 5.86%
- DSCR
- 1.26
- GRM
- 8.1
CMA / ARV
- ARV (on-the-fly)
- $354,016
- Comps found
- 11
Show comp detail 11 sales within ~0.75 mi
| Address | Dist | Beds/Ba | Sqft | Sold | Price | $/sf | Match |
|---|---|---|---|---|---|---|---|
| 1613 South St | 0.00mi | 2/2.0 | 2,000 (+4%) | 0mo | $195,000 | $98 | 93 |
| 4321 Bay View Dr | 0.36mi | 3/1.5 (+1) | 1,932 (+0%) | 9mo | $306,000 | $158 | 68 |
| 1721 IL Route 176 Rd | 0.39mi | 3/3.5 (+1) | 1,900 (-1%) | 8mo | $393,000 | $207 | 62 |
| 4505 Giant Oak Dr | 0.70mi | 3/2.0 (+1) | 1,900 (-1%) | 3mo | $685,000 | $361 | 58 |
| 4120 Newport Dr | 0.67mi | 3/2.5 (+1) | 1,948 (+1%) | 2mo | $376,000 | $193 | 58 |
| 3811 Hale Ln | 0.48mi | 3/2.0 (+1) | 1,717 (-11%) | 2mo | $369,900 | $215 | 53 |
| 911 Wembley Dr | 0.65mi | 3/2.0 (+1) | 1,750 (-9%) | 1mo | $353,500 | $202 | 49 |
| 4211 Hale Ln | 0.66mi | 3/2.5 (+1) | 1,948 (+1%) | 17mo | $290,000 | $149 | 46 |
| 3818 Burton Trl | 0.25mi | 3/1.5 (+1) | 2,154 (+12%) | 20mo | $312,000 | $145 | 44 |
| 1112 Wembley Dr | 0.49mi | 3/1.5 (+1) | 1,800 (-6%) | 24mo | $320,000 | $178 | 40 |
| 4208 Hale Ln | 0.65mi | 3/2.5 (+1) | 1,685 (-12%) | 22mo | $310,000 | $184 | 24 |
Match score weights: distance 35% · size 25% · config 20% · recency 20%. Top-matched comps best support the ARV.
Projected returns pro-forma
-3.0% appreciation · 3.89% rent growth · sell at horizon
- IRR
- -6.3%
- Equity multiple
- 0.77×
- Total profit
- $-13,139
- Equity at exit
- $29,821
- IRR
- 4.4%
- Equity multiple
- 1.33×
- Total profit
- $18,741
- Equity at exit
- $17,292
Cash invested: $56,000 (down + closing). Projections, not guarantees.
Landlord ↔ Tenant lean methodology
- Overall (STATE)
- 43 Moderately Tenant-Leaning
- State Illinois
- 43 Moderately Tenant-Leaning · D+7
- County
- — inherits STATE
- City
- — inherits STATE
ZIP-level market 60014
- Rents YoY
- 3.9%
- Active inventory
- 150
- Price-to-rent
- 8.1×
Monthly cashflow live
- Estimated rent
- $2,048 medium interval (Pro) →
- Mortgage (P&I)
- −$1,049
- Tax from tax record
- −$212 /mo · $2,547/yr
- Insurance
- −$83
- HOA
- −$0
- Vacancy / Maint / Mgmt
- −$430
- Net cashflow
- $273
Break-even live
Sensitivity live
| Price | -10% $387 | -5% $330 | +0% $273 | +5% $217 | +10% $160 |
|---|---|---|---|---|---|
| Rent | -10% $112 | -5% $192 | +0% $273 | +5% $354 | +10% $435 |
| Rate | -1.0pp $374 | -0.5pp $324 | base $273 | +0.5pp $222 | +1.0pp $169 |
UW: 25.0% down · 7.5% · 30yr · 1.5% tax · 5.0% vac · 8.0% maint · 8.0% mgmt
Financing live
Cash to close
- Down payment
- $50,000
- Closing costs
- $6,000
- Reserves months
- —
- Total cash needed
- —
Loan-product check · same deal, 3 products live
Conventional
25% down · 7.5% · 30yr
- Down + closing
- —
- Monthly P&I
- —
- Monthly cashflow
- —
- DSCR
- —
- Eligible?
- —
Personal DTI + credit; lowest rate.
DSCR
20% down · 8.5% · 30yr
- Down + closing
- —
- Monthly P&I
- —
- Monthly cashflow
- —
- DSCR
- —
- Eligible?
- —
No personal income docs; deal must DSCR.
Hard money
10% down · 12.0% · 12mo
- Down + closing
- —
- Monthly P&I
- —
- Monthly cashflow
- —
- DSCR
- —
- Eligible?
- —
Short-term bridge; refi at stabilization.
Rent comps 1 comps
| Address | Beds | Baths | Sqft | Rent | $/sqft | DOM | Units | Dist |
|---|---|---|---|---|---|---|---|---|
| 3416 Greenwich Ln Island Lake, IL | 3.0 | 1.5 | 1309 | $1,975 | $1.51 | 21d | 1 | 0.72mi |
Listing history 2 events
-
2026-06-02remarks 23-char remark
-
2026-06-02$200,000 Pending 1 DOM
ⓘ Source: listings_history table (triggers on properties + properties_extension) + one-shot
backfill from property_details.listing_events for pre-trigger history.
Tax reassessment forecast IL · Partial reset (capped growth)
- Current annual tax
- $2,547 · $212/mo
- Projected year-2 tax
- $3,544 · $295/mo
- Expected delta
- +$996/yr (+$83/mo · 39.1%)
ⓘ Screening estimate from a state-policy table — verify with the county assessor before closing.
Climate risk First Street
- Flood 1/10 Low FEMA zone X (unshaded) · 0% chance over 30 yrs
- Wildfire 1/10 Low
- Heat 2/10 Low 7 d/yr ≥100°F today · 14 d/yr by 30 yrs out
- Wind 2/10 Low 0% chance of damaging wind over 30 yrs
- Air quality 2/10 Low 1 unhealthy d/yr today · 2 by 30 yrs out
Nearby sold comps map
Loading sold comps map…
Walkable amenities ~0.75 mi
Loading nearby amenities…
Taxation est. · year 1
- Rental income
- $24,574
- − Mortgage interest
- −$11,203
- − Property taxes
- −$2,547
- − Insurance
- −$1,000
- − Repairs & maintenance
- −$1,966
- − Management
- −$1,966
- − Depreciation
- −$5,818
- Taxable income
- $74
- Est. tax owed @ 24.0%
- −$18
- After-tax cash flow
- $3,263/yr
For passive investors: Depreciation is non-cash, so a rental often shows a tax loss while cash-flowing — sheltering income. Rental losses are passive: they offset passive income freely, and up to $25,000/yr can offset ordinary (W-2) income if you actively participate and your MAGI is under $100k (phasing out to $0 by $150k); unused losses carry forward. On sale, claimed depreciation is recaptured at up to 25%, and gains may owe capital-gains tax (a 1031 exchange can defer both). Figures are a year-1 estimate at your 24.0% rate — not tax advice; consult a CPA.
Schools (NCES district)
- District
- Chsd 155
- NCES district ID
- 1711370
- Math proficiency
- 41% ▼ -9.00%
- Reading proficiency
- 42% ▼ -7.00%
- Median HH income
- $87,560
- Composite
- 39.33/100
- National rank
- #3982
- State rank
- #98 of 620 in IL
Livability — Prairie Grove
- Score
- 58/100
- State rank
- #1107
- US rank
- #20962
Category grades
Schools grade is shown separately in the Schools card above.
Census & demographics
- County
- McHenry County · 204,279 people
- Metro
- Chicago-Naperville-Elgin, IL-IN-WI
- Population (ZIP)
- 48,590
- Household income
- $109,016
- Rent vs Own
- Severe rent burden
- 922.0
Population outlook (McHenry County) Hauer SSP2
- Today (2025)
- 305,342 people
- By 2030
- 301,491 · -1.3%
- By 2040
- 288,211 · -5.6%
- By 2050
- 268,430 · -12.1%
- By 2075
- 226,209 · -25.9%
- By 2100
- 181,247 · -40.6%
Race, ethnicity, and origin ACS 2023
- Neighborhood character
- Predominantly White (80%)
- Race & ethnicity
- White 80% Hispanic / Latino 13% Two or more races 8% Asian 3%
- Hispanic origin (detail)
- Mexican 9% Puerto Rican 1%
- Common ancestry
- Romanian 12% Portuguese 2% Lithuanian 2%
- Foreign-born
- 10% · Canada, Jamaica, Vietnam
- Languages at home
- 85% English-only · Spanish 10% Russian/Polish/Slavic 2% Other Indo-European 1%
Political lean MEDSL · McHenry
- 2024 margin
- Lean R (+5.3) · D 46.6% · R 51.9% · Other 1.5%
- 2008→2024 swing
- -10.6pp toward R · 2008: 5.3pp · 2024: -5.3pp
- All cycles
- 2024: R+5.3 2020: R+2.5 2016: R+8.1 2012: R+8.8 2008: D+5.3
Not yet ingested
- Civics
- —
Market trends
- HPI YoY
- ▼ -247.92%
- Current HPI
- 207.5209
- Rent YoY
- ▲ 3.89%
- Metro
- Chicago-Naperville-Elgin, IL-IN-WI
- State GDP YoY
- ▲ 1.59%
- F500 in state
- 60
Industry mix (Fortune 500 HQ in IL)
| Industry | F500 HQs | Revenue |
|---|---|---|
| Insurance | 4 | $201B |
|
||
| Consumer Goods | 4 | $87B |
|
||
| Industrial Machinery | 3 | $64B |
|
||
| Healthcare | 2 | $55B |
|
||
| Retail / Pharmacy | 1 | $148B |
|
||
| Agriculture / Food | 1 | $86B |
|
||
Price history
2 events — show timeline
- 2026-06-02 Pending — MRED as Distributed by MLS Grid
- 2026-06-02 Listed $200,000 MRED as Distributed by MLS Grid
Property tax history
-2.4%/yrLatest (2024): $2,547 · -9.7% YoY. Source: county tax records.
Cash-flow waterfall
monthlySold comps — $/sqft
last 12 mo · ≤1 miLoading sold comps…