1216 N Hendrix Ave · Diboll, TX
Flood risk 1/10 · Minimal
- FEMA flood zone
- X (unshaded)
- Chance of flooding over 30 yrs
- 0.0%
- Est. flood insurance / yr
- $507 – $1,088
Fire risk 3/10 · Minor
- Est. fire insurance / yr
- $1,222 – $2,270
Heat risk 8/10 · Major
- Hot days now (above 110°F)
- 7 days/yr
- Hot days in 30 yrs
- 24 days/yr
Wind risk 8/10 · Major
- Chance of severe wind over 30 yrs
- 80.0%
Air-quality risk 1/10 · Minimal
- Unhealthy air days now
- 0 days/yr
- Unhealthy air days in 30 yrs
- 0 days/yr
Risk factors via First Street. Map © Google.
Why this score? — see what drove the B- grade
The composite is a weighted blend of 9 inputs, each scored 0–100. Each bar is that input's sub-score; the figure is the points it added to the 100-point composite (weight × sub-score).
- Cash flow +30.0/30.0
- 1% rule +10.0/10.0
- DSCR +10.0/10.0
- ARV discount +7.5/15.0
- Schools +3.5/10.0
- Livability +3.2/5.0
- Rent growth +2.5/5.0
- Condition / age +2.5/5.0
- Appreciation +0.0/10.0
$75,000
🖨 Deal sheet 📄 Offer letter ✓ Due diligence
Listing remarks MLS
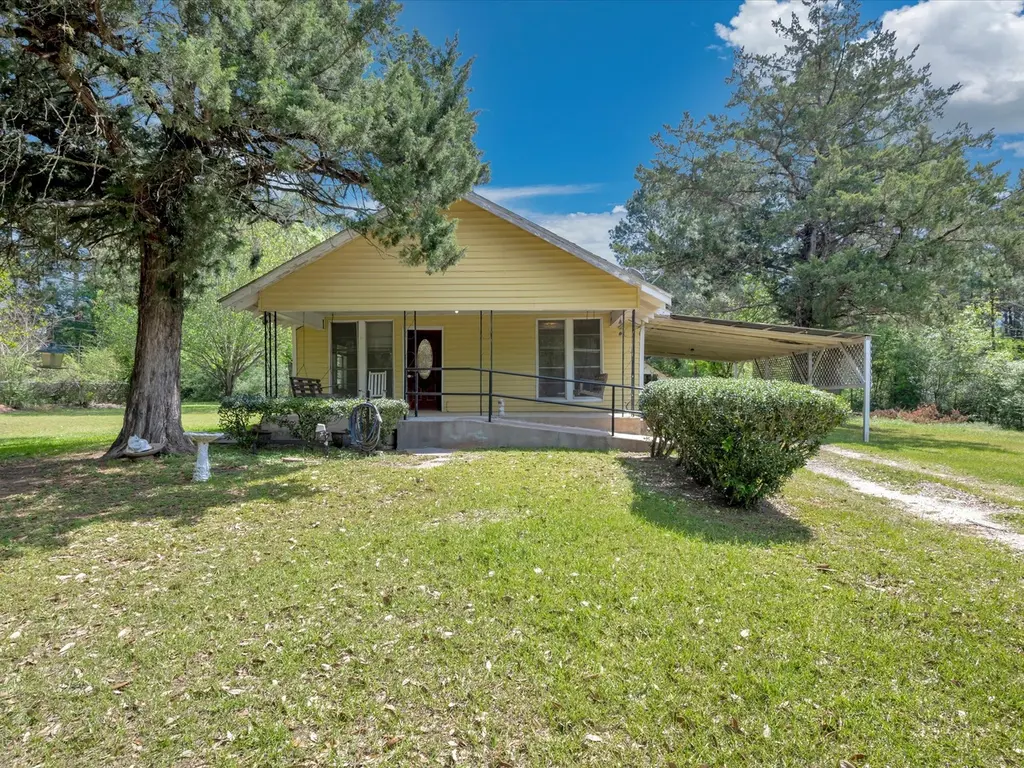
Tucked into the heart of Diboll, Texas, 1216 N Hendrick Avenue offers a comfortable blend of small-town charm and everyday convenience just minutes from Lufkin. This inviting property features a spacious layout with abundant natural light, functional living areas, and a welcoming exterior framed by mature East Texas surroundings. Inside, you’ll find practical design and livable flow, ideal for both homeowners and investors seeking value in the growing Diboll market. Located within Diboll Independent School District, the home provides access to local schools while maintaining close proximity to major employers, shopping, dining, and medical facilities in Lufkin. Easy access to US-59 enhances commuting and connectivity. Whether you're searching for a primary residence or rental opportunity in East Texas, this property delivers location, accessibility, and potential.
Key facts
- Easy access to us-59
- 0.75 acre lot
- Parking
Tags
Neighborhood map
What this means for you Summary
Snapshot
- This is a 3-bed/1.0-bath single-family listed at $75k.
Deal economics
- At list price, monthly cash flow is $434 ($5k/yr) — positive.
- The deal already cash-flows at list — no discount required.
- Meets the 1% rule at list price ($1k rent vs $75k).
- Recommended offer: $70k (6.0% below list) — sets the bar for market timing.
Location & tenants
- Location reads 65/100 on livability (#708 in TX) — a middle-class / working-renter tenant base. Strengths: cost of living A+, housing A+; Watch: schools F, amenities F, commute F.
- Diboll ISD (town): math 45% / reading 37% proficiency, ranked #394 of 826 in TX (top 48%) — families likely to look elsewhere, expect single-tenant / working-renter base with shorter leases; 66% free/reduced lunch — lower-income household profile, screen leases tightly.
- Market conditions: 53 active listings in the ZIP; 120 units permitted in Angelina County in 2024 (0 in 5+ unit buildings).
Forward outlook
- Local home prices are declining (-3.0%/yr); year-one equity from $519 of loan paydown is wiped out by about $2k of value loss. Plan a longer hold.
- At projected returns (-3.0% appreciation + 3.0% rent growth), your $21k cash investment doubles in ~5 years — after that, you're playing with house money.
Negotiation context
- It's been on market 71 days — a 6% lower offer ($70k) is reasonable based on typical stale-listing flexibility.
Risks & watch-outs
- Watch-outs: property tax is 2.8% of price; built in 1945 — expect roof / HVAC / electrical / plumbing capex.
- Climate carrying-cost: severe wind risk, 80% chance of damaging wind over 30y; extreme-heat days projected 7→24/yr by 2055 (HVAC capex compounding) — expect insurance premiums to compound above CPI over the hold.
Questions for the listing agent
- It's been on market 71 days. Have you received any prior offers? Is the seller open to a 6% concession, seller financing, or rate buy-down credit?
- Built in 1945 — when were the roof, HVAC, electrical panel, plumbing, and water heater last replaced?
- Property tax is high relative to price — has the assessment been appealed recently, and will the sale trigger a re-assessment?
- Why hasn't it sold? Are there any deal-killer items the seller is aware of (foundation, flood, title, zoning, code violations)?
- Is there a deadline driving the sale (1031 exchange, divorce, estate, relocation)? That informs how much negotiation room exists.
- Schools are F-rated, which usually means shorter tenancies and higher turnover. Who's the typical renter profile here, and what's been the actual vacancy rate?
- What's the average days-on-market for RENTAL listings here right now (not sales)? A rising rental-DOM trend means longer vacancies and softer asking-rent achievability than the comps imply.
- What's the recent tenant-quality profile in this submarket — average credit score on applications, eviction rate, late-payment / NSF rate, and stable-employment percentage? A property-management company in the area should have these aggregated.
- How much new for-sale + rental construction is in the pipeline within 1–3 miles? Heavy new supply typically softens prices + rents 12–24 months out; constrained supply supports both.
Investment metrics
- 1% rule
- 1.75% ✓
- Cap rate
- 13.23%
- Cash-on-cash
- 24.78%
- DSCR
- 2.10
- GRM
- 4.8
CMA / ARV
- ARV (median comp)
- $167,943
- List price
- $75,000
- Delta
- -55.34%
- Verdict
- UNDERPRICED
- Comps
- 4 within 1.0 mi
Show comp detail 1 sale within ~0.75 mi
| Address | Dist | Beds/Ba | Sqft | Sold | Price | $/sf | Match |
|---|---|---|---|---|---|---|---|
| 1000 Holubec | 0.70mi | 3/2.0 | 1,350 (+15%) | 1mo | $247,500 | $183 | 38 |
Match score weights: distance 35% · size 25% · config 20% · recency 20%. Top-matched comps best support the ARV.
Projected returns pro-forma
-3.0% appreciation · 3.0% rent growth · sell at horizon
- IRR
- 18.2%
- Equity multiple
- 1.74×
- Total profit
- $15,533
- Equity at exit
- $11,183
- IRR
- 26.7%
- Equity multiple
- 3.35×
- Total profit
- $49,373
- Equity at exit
- $6,485
Cash invested: $21,000 (down + closing). Projections, not guarantees.
Landlord ↔ Tenant lean methodology
- Overall (STATE)
- 87 Strongly Landlord-Friendly
- State Texas
- 87 Strongly Landlord-Friendly · R+5
- County
- — inherits STATE
- City
- — inherits STATE
ZIP-level market 75941
- Home prices YoY
- -22.6%
- Active inventory
- 53
- Price-to-rent
- 4.8×
Monthly cashflow live
- Estimated rent
- $1,310 medium interval (Pro) →
- Mortgage (P&I)
- −$393
- Tax from tax record
- −$177 /mo · $2,124/yr
- Insurance
- −$31
- HOA
- −$0
- Vacancy / Maint / Mgmt
- −$275
- Net cashflow
- $434
Break-even live
UW: 25.0% down · 7.5% · 30yr · 1.5% tax · 5.0% vac · 8.0% maint · 8.0% mgmt
Financing live
Cash to close
- Down payment
- $18,750
- Closing costs
- $2,250
- Reserves months
- —
- Total cash needed
- —
Loan-product check · same deal, 3 products live
Conventional
25% down · 7.5% · 30yr
- Down + closing
- —
- Monthly P&I
- —
- Monthly cashflow
- —
- DSCR
- —
- Eligible?
- —
Personal DTI + credit; lowest rate.
DSCR
20% down · 8.5% · 30yr
- Down + closing
- —
- Monthly P&I
- —
- Monthly cashflow
- —
- DSCR
- —
- Eligible?
- —
No personal income docs; deal must DSCR.
Hard money
10% down · 12.0% · 12mo
- Down + closing
- —
- Monthly P&I
- —
- Monthly cashflow
- —
- DSCR
- —
- Eligible?
- —
Short-term bridge; refi at stabilization.
Listing history 12 events
-
2026-06-13statusdays on market $75,000 Pending 71 DOM
-
2026-06-10days on market $75,000 Active 70 DOM
-
2026-06-09days on market $75,000 Active 69 DOM
-
2026-06-08days on market $75,000 Active 68 DOM
-
2026-06-07days on market $75,000 Active 67 DOM
-
2026-06-05days on market $75,000 Active 64 DOM
-
2026-06-02days on market $75,000 Active 62 DOM
-
2026-06-01days on market $75,000 Active 61 DOM
-
2026-05-31days on market $75,000 Active 60 DOM
-
2026-05-30days on market $75,000 Active 59 DOM
-
2026-05-07price $82,000 882-char remark
Show marketing remark (882 chars)
Tucked into the heart of Diboll, Texas, 1216 N Hendrick Avenue offers a comfortable blend of small-town charm and everyday convenience just minutes from Lufkin. This inviting property features a spacious layout with abundant natural light, functional living areas, and a welcoming exterior framed by mature East Texas surroundings. Inside, you’ll find practical design and livable flow, ideal for both homeowners and investors seeking value in the growing Diboll market. Located within Diboll Independent School District, the home provides access to local schools while maintaining close proximity to major employers, shopping, dining, and medical facilities in Lufkin. Easy access to US-59 enhances commuting and connectivity. Whether you're searching for a primary residence or rental opportunity in East Texas, this property delivers location, accessibility, and potential.
-
2026-04-01$89,900 Active 882-char remark
Show marketing remark (882 chars)
Tucked into the heart of Diboll, Texas, 1216 N Hendrick Avenue offers a comfortable blend of small-town charm and everyday convenience just minutes from Lufkin. This inviting property features a spacious layout with abundant natural light, functional living areas, and a welcoming exterior framed by mature East Texas surroundings. Inside, you’ll find practical design and livable flow, ideal for both homeowners and investors seeking value in the growing Diboll market. Located within Diboll Independent School District, the home provides access to local schools while maintaining close proximity to major employers, shopping, dining, and medical facilities in Lufkin. Easy access to US-59 enhances commuting and connectivity. Whether you're searching for a primary residence or rental opportunity in East Texas, this property delivers location, accessibility, and potential.
ⓘ Source: listings_history table (triggers on properties + properties_extension) + one-shot
backfill from property_details.listing_events for pre-trigger history.
Tax reassessment forecast TX · Resets to sale price
- Current annual tax
- $2,124 · $177/mo
- Projected year-2 tax
- $2,124 · $177/mo
- Expected delta
- $0/yr ($0/mo · 0.0%)
ⓘ Screening estimate from a state-policy table — verify with the county assessor before closing.
Climate risk First Street
- Flood 1/10 Low FEMA zone X (unshaded) · 0% chance over 30 yrs
- Wildfire 3/10 Moderate
- Heat 8/10 Severe 7 d/yr ≥110°F today · 24 d/yr by 30 yrs out
- Wind 8/10 Severe 80% chance of damaging wind over 30 yrs
- Air quality 1/10 Low 0 unhealthy d/yr today · 0 by 30 yrs out
Nearby sold comps map
Loading sold comps map…
Walkable amenities ~0.75 mi
Loading nearby amenities…
Taxation est. · year 1
- Rental income
- $15,723
- − Mortgage interest
- −$4,201
- − Property taxes
- −$2,124
- − Insurance
- −$375
- − Repairs & maintenance
- −$1,258
- − Management
- −$1,258
- − Depreciation
- −$2,182
- Taxable income
- $4,326
- Est. tax owed @ 24.0%
- −$1,038
- After-tax cash flow
- $4,165/yr
For passive investors: Depreciation is non-cash, so a rental often shows a tax loss while cash-flowing — sheltering income. Rental losses are passive: they offset passive income freely, and up to $25,000/yr can offset ordinary (W-2) income if you actively participate and your MAGI is under $100k (phasing out to $0 by $150k); unused losses carry forward. On sale, claimed depreciation is recaptured at up to 25%, and gains may owe capital-gains tax (a 1031 exchange can defer both). Figures are a year-1 estimate at your 24.0% rate — not tax advice; consult a CPA.
Schools (NCES district)
- District
- Diboll ISD
- NCES district ID
- 4817040
- Math proficiency
- 45% ▼ -5.00%
- Reading proficiency
- 37% ▼ -2.00%
- Median HH income
- $42,667
- Composite
- 34.67/100
- National rank
- #5142
- State rank
- #394 of 826 in TX
Livability — Diboll
- Score
- 65/100
- State rank
- #708
- US rank
- #13209
Category grades
Schools grade is shown separately in the Schools card above.
Census & demographics
- Census place
- Diboll, TX
- Population (ZIP)
- 8,712
Population outlook (Angelina County) Hauer SSP2
- Today (2025)
- 90,174 people
- By 2030
- 90,697 · +0.6%
- By 2040
- 91,291 · +1.2%
- By 2050
- 91,168 · +1.1%
- By 2075
- 88,961 · -1.3%
- By 2100
- 80,590 · -10.6%
Race, ethnicity, and origin ACS 2023
- Neighborhood character
- Diverse neighborhood (Simpson 0.65)
- Race & ethnicity
- White 41% Hispanic / Latino 40% Two or more races 27% Black 16%
- Hispanic origin (detail)
- Mexican 36%
- Common ancestry
- Lithuanian 1% Serbian 1% Slovak 1%
- Foreign-born
- 13% · Canada, Vietnam
- Languages at home
- 66% English-only · Spanish 33% Vietnamese 1%
Political lean MEDSL · Angelina
- 2024 margin
- Solid R (+52.0) · D 23.7% · R 75.7%
- 2008→2024 swing
- -17.0pp toward R · 2008: -35.0pp · 2024: -52.0pp
- All cycles
- 2024: R+52.0 2020: R+46.1 2016: R+47.3 2012: R+43.9 2008: R+35.0
Not yet ingested
- Civics
- —
Market trends
- HPI YoY
- ▼ -58.36%
- Current HPI
- 200.1079
- Rent YoY
- —
- Metro
- —
- State GDP YoY
- ▲ 3.95%
- F500 in state
- 110
Industry mix (Fortune 500 HQ in TX)
| Industry | F500 HQs | Revenue |
|---|---|---|
| Energy | 16 | $1,198B |
|
||
| Technology | 5 | $198B |
|
||
| Engineering / Construction | 4 | $72B |
|
||
| Energy Services | 3 | $60B |
|
||
| Utilities | 3 | $41B |
|
||
| Healthcare | 2 | $330B |
|
||
Price history
-8.8% since first listed2 events — show timeline
- 2026-05-07 Price Changed $82,000 HARMLS
- 2026-04-01 Listed $89,900 HARMLS
Property tax history
+4.8%/yrLatest (2025): $2,124 · +8.1% YoY. Source: county tax records.
Cash-flow waterfall
monthlySold comps — $/sqft
last 12 mo · ≤1 miLoading sold comps…