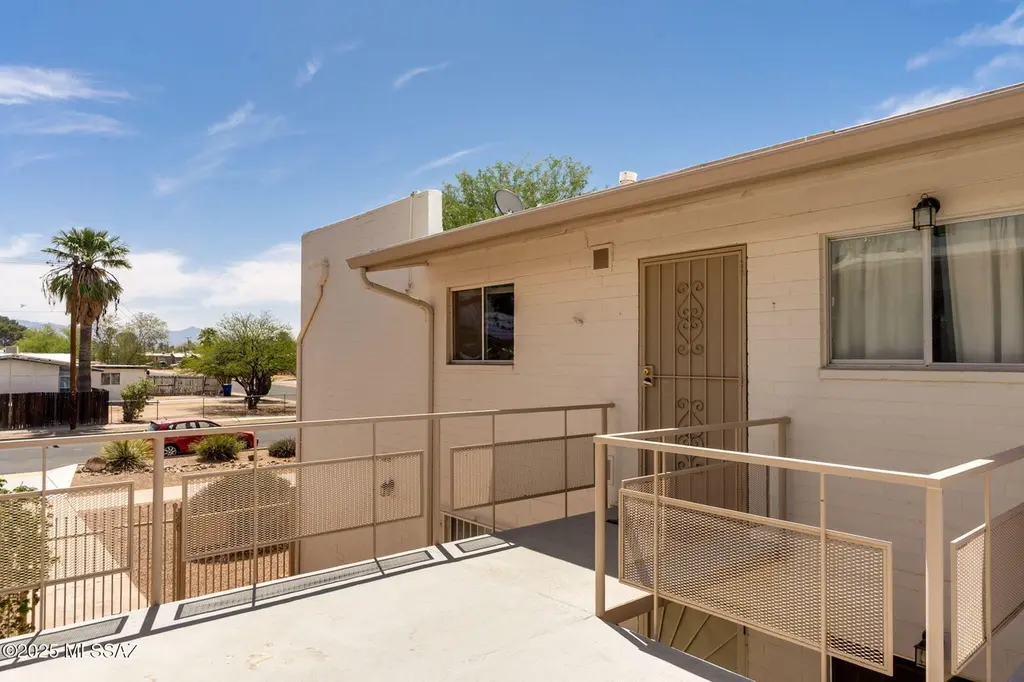
1470 S Palo Verde Ave Unit J 201 · Tucson, AZ
Flood risk 1/10 · Minimal
- FEMA flood zone
- X (unshaded)
- Chance of flooding over 30 yrs
- 0.0%
- Est. flood insurance / yr
- $507 – $1,088
Fire risk 2/10 · Minimal
- Est. fire insurance / yr
- $610 – $1,132
Heat risk 8/10 · Major
- Hot days now (above 105°F)
- 6 days/yr
- Hot days in 30 yrs
- 15 days/yr
Wind risk 1/10 · Minimal
- Chance of severe wind over 30 yrs
- —
Air-quality risk 1/10 · Minimal
- Unhealthy air days now
- 0 days/yr
- Unhealthy air days in 30 yrs
- 0 days/yr
Risk factors via First Street. Map © Google.
Why this score? — see what drove the C grade
The composite is a weighted blend of 9 inputs, each scored 0–100. Each bar is that input's sub-score; the figure is the points it added to the 100-point composite (weight × sub-score).
- Cash flow +20.0/30.0
- 1% rule +10.0/10.0
- ARV discount +8.1/15.0
- DSCR +6.3/10.0
- Condition / age +3.8/5.0
- Livability +3.7/5.0
- Rent growth +2.6/5.0
- Schools +1.6/10.0
- Appreciation +0.0/10.0
$61,990
🖨 Deal sheet 📄 Offer letter ✓ Due diligence
Listing remarks MLS
Move in ready 1 bed/1 bath located in Central Tucson, just south of Reid Park, with plenty of walking/biking paths and shopping nearby! Brand new carpet throughout, new paint, newer AC Wall unit and Evap cooler and even a screened in patio! This corner unit is located close to the Laundry, mailboxes and Swimming Pool for your convenience. Monthly fee includes seasonal pads/maintenance on cooler, roof/structural, pest control, taxes, water, sewer, trash, pool/grounds and 1 covered parking spot.
Key facts
- Swimming pool
- Walking biking paths
- Corner unit
Tags
Neighborhood map
What this means for you Summary
Snapshot
- This is a 1-bed/1.0-bath condo listed at $62k. Condition is rated good.
Deal economics
- At list price, monthly cash flow is $76 ($915/yr) — positive.
- The deal already cash-flows at list — no discount required.
- Meets the 1% rule at list price ($936 rent vs $62k).
- Recommended offer: $55k (12.0% below list) — sets the bar for market timing.
- Cap rate 7.8% vs local median 3.7% in Tucson — top-decile yield for the area; either an underpriced asset or a hidden risk that comps aren't pricing in. Stress-test before assuming the spread holds.
Location & tenants
- Location reads 74/100 on livability (#17 in AZ, #4,502 nationally) — a middle-class / working-renter tenant base. Strengths: commute A+, cost of living A+, housing A+; Watch: health & safety C-, schools D+, crime F.
- Tucson Unified District (4403) (urban): math 14% / reading 23% proficiency, ranked #190 of 249 in AZ (top 76%) — low school quality limits family demand, transient renter base, plan for 1-2y turnover.
- Market conditions: Rents flat; 264 active listings in the ZIP; 36 comparable units currently listed for rent nearby; rentals lingering (median 44d on market — plan ~5-8 weeks vacancy on turnover, expect pricing pressure); 53% of comp listings sitting > 30 days — soft ceiling on asking rent; 5,268 units permitted in Pima County in 2024 (996 in 5+ unit buildings).
Forward outlook
- Local home prices are declining (-3.0%/yr); year-one equity from $428 of loan paydown is wiped out by about $2k of value loss. Plan a longer hold.
- Pima County population projected at +8% by 2050 — modest demand growth; plan on rents tracking national, not racing it.
Negotiation context
- It's been on market 384 days — a 12% lower offer ($55k) is reasonable based on typical stale-listing flexibility.
Risks & watch-outs
- Watch-outs: HOA is 25% of rent.
- Climate carrying-cost: extreme-heat days projected 6→15/yr by 2055 (HVAC capex compounding) — expect insurance premiums to compound above CPI over the hold.
Questions for the listing agent
- It's been on market 384 days. Have you received any prior offers? Is the seller open to a 12% concession, seller financing, or rate buy-down credit?
- Built in 1962 — when were the roof, HVAC, electrical panel, plumbing, and water heater last replaced?
- What does the HOA fee cover, when was the last increase, and are there any pending special assessments or reserve-fund shortfalls?
- Any open or pending special assessments — roof, HVAC, plumbing, elevator, façade? What's the per-unit balance and payoff schedule, and is the seller paying it off at close or rolling it to the buyer?
- Why hasn't it sold? Are there any deal-killer items the seller is aware of (foundation, flood, title, zoning, code violations)?
- Is there a deadline driving the sale (1031 exchange, divorce, estate, relocation)? That informs how much negotiation room exists.
- Schools are D-rated, which usually means shorter tenancies and higher turnover. Who's the typical renter profile here, and what's been the actual vacancy rate?
- Crime grade is F in this area — have there been break-ins, vandalism, or insurance claims at this property in the last 3 years? What carrier currently insures it and at what premium?
- What's the average days-on-market for RENTAL listings here right now (not sales)? A rising rental-DOM trend means longer vacancies and softer asking-rent achievability than the comps imply.
- What's the recent tenant-quality profile in this submarket — average credit score on applications, eviction rate, late-payment / NSF rate, and stable-employment percentage? A property-management company in the area should have these aggregated.
- How much new apartment / multifamily construction is in the pipeline within 1–3 miles? Heavy new supply (>2% of stock underway) typically softens rents 12–24 months out; light construction supports rent growth.
Investment metrics
- 1% rule
- 1.51% ✓
- Cap rate
- 7.77%
- Cash-on-cash
- 5.27%
- DSCR
- 1.23
- GRM
- 5.5
CMA / ARV
- ARV (median comp)
- $62,841
- List price
- $61,990
- Delta
- -1.35%
- Verdict
- FAIR
- Comps
- 20 within 1.0 mi
Projected returns pro-forma
-3.0% appreciation · 0.21% rent growth · sell at horizon
- IRR
- -12.6%
- Equity multiple
- 0.56×
- Total profit
- $-7,586
- Equity at exit
- $9,243
- IRR
- -11.3%
- Equity multiple
- 0.45×
- Total profit
- $-9,630
- Equity at exit
- $5,360
Cash invested: $17,357 (down + closing). Projections, not guarantees.
Landlord ↔ Tenant lean methodology
- Overall (STATE)
- 87 Strongly Landlord-Friendly
- State Arizona
- 87 Strongly Landlord-Friendly · R+3
- County
- — inherits STATE
- City
- — inherits STATE
ZIP-level market 85713
- Home prices YoY
- -24.5%
- Rents YoY
- 0.2%
- Active inventory
- 264
- Price-to-rent
- 5.5×
Monthly cashflow live
- Estimated rent
- $936 high interval (Pro) →
- Mortgage (P&I)
- −$325
- Tax est. 1.5%
- −$77 /mo · $930/yr
- Insurance
- −$26
- HOA
- −$235
- Vacancy / Maint / Mgmt
- −$197
- Net cashflow
- $76
Break-even live
UW: 25.0% down · 7.5% · 30yr · 1.5% tax · 5.0% vac · 8.0% maint · 8.0% mgmt
Financing live
Cash to close
- Down payment
- $15,498
- Closing costs
- $1,860
- Reserves months
- —
- Total cash needed
- —
Loan-product check · same deal, 3 products live
Conventional
25% down · 7.5% · 30yr
- Down + closing
- —
- Monthly P&I
- —
- Monthly cashflow
- —
- DSCR
- —
- Eligible?
- —
Personal DTI + credit; lowest rate.
DSCR
20% down · 8.5% · 30yr
- Down + closing
- —
- Monthly P&I
- —
- Monthly cashflow
- —
- DSCR
- —
- Eligible?
- —
No personal income docs; deal must DSCR.
Hard money
10% down · 12.0% · 12mo
- Down + closing
- —
- Monthly P&I
- —
- Monthly cashflow
- —
- DSCR
- —
- Eligible?
- —
Short-term bridge; refi at stabilization.
Rent comps 36 comps
| Address | Beds | Baths | Sqft | Rent | $/sqft | DOM | Units | Dist |
|---|---|---|---|---|---|---|---|---|
| 2921 E 17th St Tucson, AZ | 1.0 | 1.0 | 625 | $1,075 | $1.72 | 43d | 1 | 0.90mi |
| 2921 E 17th St Tucson, AZ | 1.0 | 1.0 | 625 | $975 | $1.56 | 21d | 1 | 0.90mi |
| 2843 E 17th St Unit 13 Tucson, AZ | 1.0 | 1.0 | 520 | $900 | $1.73 | 43d | 1 | 0.91mi |
| 2843 E 17th St Unit 13 Tucson, AZ | 1.0 | 1.0 | 560 | $900 | $1.61 | 23d | 1 | 0.91mi |
| 4170 E 32nd St Tucson, AZ | 2.0 | 1.0 | 725 | $1,095 | $1.51 | 16d | 1 | 1.00mi |
| 4170 E 32nd St Tucson, AZ | 2.0 | 1.0 | 725 | $1,095 | $1.51 | 14d | 1 | 1.00mi |
| 1524 S Columbus Blvd Tucson, AZ | 1.0 | 1.0 | 689 | $825 | $1.20 | 3d | 1 | 1.03mi |
| 4255 E 29th St Tucson, AZ | 2.0 | 1.0 | 585 | $849 | $1.45 | 3d | 7 | 1.04mi |
| 4250 E 29th St Tucson, AZ | 1.0 | 1.0 | 418 | $874 | $2.09 | 43d | 1 | 1.05mi |
| 3051 E Proctor Vis Tucson, AZ | 1.0 | 1.0 | 600 | $950 | $1.58 | 43d | 1 | 1.07mi |
| 3049 E Proctor Vis Unit ProctorVista3051 Tucson, AZ | 1.0 | 1.0 | 600 | $800 | $1.33 | 43d | 1 | 1.07mi |
| 3049 E Proctor Vis Tucson, AZ | 1.0 | 1.0 | 600 | $950 | $1.58 | 43d | 1 | 1.07mi |
| 3043 E Proctor Vis Tucson, AZ | 1.0 | 1.0 | 600 | $750 | $1.25 | 16d | 1 | 1.08mi |
| 850 S Tucson Blvd Unit Tucson886 Tucson, AZ | 1.0 | 1.0 | 525 | $800 | $1.52 | 43d | 1 | 1.08mi |
| 725 S Tucson Blvd Tucson, AZ | 2.0 | 1.0 | 538 | $1,232 | $2.29 | 43d | 1 | 1.11mi |
| 4150 E Brown Way Tucson, AZ | — | 1.0 | 400 | $750 | $1.88 | 43d | 1 | 1.17mi |
| 460 S Bryant Ave Tucson, AZ | 1.0 | 1.0 | 600 | $743 | $1.24 | 3d | 1 | 1.17mi |
| 4148 E Brown Way Tucson, AZ | — | 1.0 | 400 | $750 | $1.88 | 43d | 1 | 1.17mi |
| 660 S Tucson Blvd Unit 103 Tucson, AZ | 1.0 | 1.0 | 600 | $850 | $1.42 | 23d | 1 | 1.17mi |
| 660 S Tucson Blvd Unit 114 Tucson, AZ | 1.0 | 1.0 | 600 | $725 | $1.21 | 43d | 1 | 1.17mi |
| 4162 E Brown Way Tucson, AZ | 1.0 | 1.0 | 600 | $900 | $1.50 | 43d | 1 | 1.19mi |
| 4171 E Brown Way Tucson, AZ | 1.0 | 1.0 | 583 | $850 | $1.46 | 23d | 1 | 1.21mi |
| 2511 E Cameron Vis Tucson, AZ | 2.0 | 1.0 | 685 | $1,199 | $1.75 | 43d | 1 | 1.22mi |
| 4440 E 29th St Unit E216 Tucson, AZ | 1.0 | 1.0 | 488 | $650 | $1.33 | 23d | 1 | 1.28mi |
| 4440 E 29th St Unit I210 Tucson, AZ | 2.0 | 1.0 | 646 | $850 | $1.32 | 43d | 1 | 1.28mi |
| 4440 E 29th St Unit C211 Tucson, AZ | 2.0 | 1.0 | 646 | $850 | $1.32 | 15d | 1 | 1.28mi |
| 4431 E 22nd St Tucson, AZ | 1.0–2.0 | 1.0 | 770 | $901 | $1.17 | 43d | 2 | 1.29mi |
| 2842 S Coconino Vis Tucson, AZ | 2.0 | 1.0 | 750 | $800 | $1.07 | 16d | 1 | 1.38mi |
| 2842 S Coconino Vis Unit 2844 Tucson, AZ | 2.0 | 1.0 | 750 | $800 | $1.07 | 19d | 1 | 1.38mi |
| 2941 E 10th St Tucson, AZ | 1.0 | 1.0 | 550 | $995 | $1.81 | 23d | 1 | 1.43mi |
| 4502 E 18th St Tucson, AZ | 2.0 | 1.0 | 750 | $1,050 | $1.40 | 23d | 1 | 1.43mi |
| 15 N Longfellow Ave Unit 29 Tucson, AZ | — | 1.0 | 450 | $869 | $1.93 | 43d | 1 | 1.47mi |
| 15 N Longfellow Ave Unit 23 Tucson, AZ | — | 1.0 | 450 | $695 | $1.54 | 43d | 1 | 1.47mi |
| 15 N Longfellow Ave Unit 27 Tucson, AZ | — | 1.0 | 450 | $775 | $1.72 | 43d | 1 | 1.47mi |
| 15 N Longfellow Ave Unit FA27 Tucson, AZ | — | 1.0 | 420 | $725 | $1.73 | 23d | 1 | 1.47mi |
| 15 N Longfellow Ave Unit 31 Tucson, AZ | — | 1.0 | 450 | $749 | $1.66 | 43d | 1 | 1.47mi |
HOA detail condo
- Monthly dues
- $235 · $2,820/yr
- Likely covers
- watersewertrashlandscapingpool
- Assessments
- None detected in remarks — confirm with the listing agent.
Listing history 15 events
-
2026-06-18days on market $61,990 Active 384 DOM
-
2026-06-17days on market $61,990 Active 383 DOM
-
2026-06-16days on market $61,990 Active 382 DOM
-
2026-06-15days on market $61,990 Active 381 DOM
-
2026-06-13days on market $61,990 Active 379 DOM
-
2026-06-10days on market $61,990 Active 376 DOM
-
2026-06-09days on market $61,990 Active 375 DOM
-
2026-06-08days on market $61,990 Active 374 DOM
-
2026-06-07days on market $61,990 Active 373 DOM
-
2026-06-05days on market $61,990 Active 370 DOM
-
2026-06-03days on market $61,990 Active 369 DOM
-
2026-06-02pricedays on market $61,990 Active 368 DOM
-
2026-06-01days on market $76,990 Active 367 DOM
-
2026-05-31days on market $76,990 Active 366 DOM
-
2025-05-30$76,990 Active 498-char remark
Show marketing remark (498 chars)
Move in ready 1 bed/1 bath located in Central Tucson, just south of Reid Park, with plenty of walking/biking paths and shopping nearby! Brand new carpet throughout, new paint, newer AC Wall unit and Evap cooler and even a screened in patio! This corner unit is located close to the Laundry, mailboxes and Swimming Pool for your convenience. Monthly fee includes seasonal pads/maintenance on cooler, roof/structural, pest control, taxes, water, sewer, trash, pool/grounds and 1 covered parking spot.
ⓘ Source: listings_history table (triggers on properties + properties_extension) + one-shot
backfill from property_details.listing_events for pre-trigger history.
Climate risk First Street
- Flood 1/10 Low FEMA zone X (unshaded) · 0% chance over 30 yrs
- Wildfire 2/10 Low
- Heat 8/10 Severe 6 d/yr ≥105°F today · 15 d/yr by 30 yrs out
- Wind 1/10 Low
- Air quality 1/10 Low 0 unhealthy d/yr today · 0 by 30 yrs out
Nearby sold comps map
Loading sold comps map…
Walkable amenities ~0.75 mi
Loading nearby amenities…
Taxation est. · year 1
- Rental income
- $11,235
- − Mortgage interest
- −$3,472
- − Property taxes
- −$930
- − Insurance
- −$310
- − Repairs & maintenance
- −$899
- − Management
- −$899
- − HOA
- −$2,820
- − Depreciation
- −$1,803
- Taxable income
- $102
- Est. tax owed @ 24.0%
- −$25
- After-tax cash flow
- $891/yr
For passive investors: Depreciation is non-cash, so a rental often shows a tax loss while cash-flowing — sheltering income. Rental losses are passive: they offset passive income freely, and up to $25,000/yr can offset ordinary (W-2) income if you actively participate and your MAGI is under $100k (phasing out to $0 by $150k); unused losses carry forward. On sale, claimed depreciation is recaptured at up to 25%, and gains may owe capital-gains tax (a 1031 exchange can defer both). Figures are a year-1 estimate at your 24.0% rate — not tax advice; consult a CPA.
Condition & rehab AI · 12 photos
This move-in ready condo in Tucson offers a good condition with minor repairs needed. Painting the exterior and replacing the sliding door would significantly increase its value.
Repairs flagged
- Minor Kitchen cabinets — Slight wear
- Minor Bathroom sliding door — Possible squeaks
Value-add opportunities
- Both Paint the exterior — Enhances curb appeal and resale value
- Both Replace the sliding door — Improves functionality and aesthetics
Renovation cost estimate screening
| Repair item | Severity | Est. cost |
|---|---|---|
| Kitchen cabinets · Slight wear | Minor | $500–3,000 |
| Bathroom sliding door · Possible squeaks | Minor | $500–3,000 |
| Total estimated repair cost · 2 items | $1,000–6,000 |
Value-add ROI direction
- Both Paint the exterior — Enhances curb appeal and resale value ↑
- Both Replace the sliding door — Improves functionality and aesthetics ↑
ⓘ Cost ranges are severity-bucket heuristics (US national rule-of-thumb). Get contractor quotes + a written scope before underwriting a rehab budget.
Schools (NCES district)
- District
- Tucson Unified District (4403)
- NCES district ID
- 0408800
- Math proficiency
- 14% ▼ -17.00%
- Reading proficiency
- 23% ▼ -11.00%
- Median HH income
- $40,962
- Composite
- 15.78/100
- National rank
- #9270
- State rank
- #190 of 249 in AZ
Livability — Tucson
- Score
- 74/100
- State rank
- #17
- US rank
- #4502
Category grades
Schools grade is shown separately in the Schools card above.
Census & demographics
- Census place
- Tucson, AZ
- County
- Pima County · 1,012,107 people
- City population
- 839,336
- Metro
- Tucson, AZ
- Population (ZIP)
- 46,439
- Household income
- $53,152
- Rent vs Own
- Severe rent burden
- 1517.0
Population outlook (Pima County) Hauer SSP2
- Today (2025)
- 1,066,056 people
- By 2030
- 1,086,684 · +1.9%
- By 2040
- 1,117,160 · +4.8%
- By 2050
- 1,149,778 · +7.9%
- By 2075
- 1,271,480 · +19.3%
- By 2100
- 1,321,160 · +23.9%
Race, ethnicity, and origin ACS 2023
- Neighborhood character
- Predominantly Hispanic (70%)
- Race & ethnicity
- Hispanic / Latino 70% Two or more races 30% White 21% Native American 5% Black 3% Asian 1%
- Hispanic origin (detail)
- Mexican 67%
- Common ancestry
- Italian 1% Lithuanian 1% Portuguese 1%
- Foreign-born
- 19% · Canada, China
- Languages at home
- 49% English-only · Spanish 49%
Political lean MEDSL · Pima
- 2024 margin
- D (+15.2) · D 57.0% · R 41.8% · Other 1.2%
- 2008→2024 swing
- +9.1pp toward D · 2008: 6.1pp · 2024: 15.2pp
- All cycles
- 2024: D+15.2 2020: D+18.7 2016: D+13.5 2012: D+5.8 2008: D+6.1
Not yet ingested
- Civics
- —
Market trends
- HPI YoY
- ▼ -107.07%
- Current HPI
- 329.8338
- Rent YoY
- ▲ 0.21%
- Metro
- Tucson, AZ
- State GDP YoY
- ▲ 4.54%
- F500 in state
- 20
Industry mix (Fortune 500 HQ in AZ)
| Industry | F500 HQs | Revenue |
|---|---|---|
| Technology | 2 | $13B |
|
||
| Mining / Metals | 1 | $23B |
|
||
| Environmental Services | 1 | $16B |
|
||
| Metals / Steel | 1 | $14B |
|
||
| Technology Distribution | 1 | $9B |
|
||
| Homebuilding | 1 | $8B |
|
||
Price history
1 event — show timeline
- 2025-05-30 Listed $76,990 MLSSAZ
Cash-flow waterfall
monthlySold comps — $/sqft
last 12 mo · ≤1 miLoading sold comps…