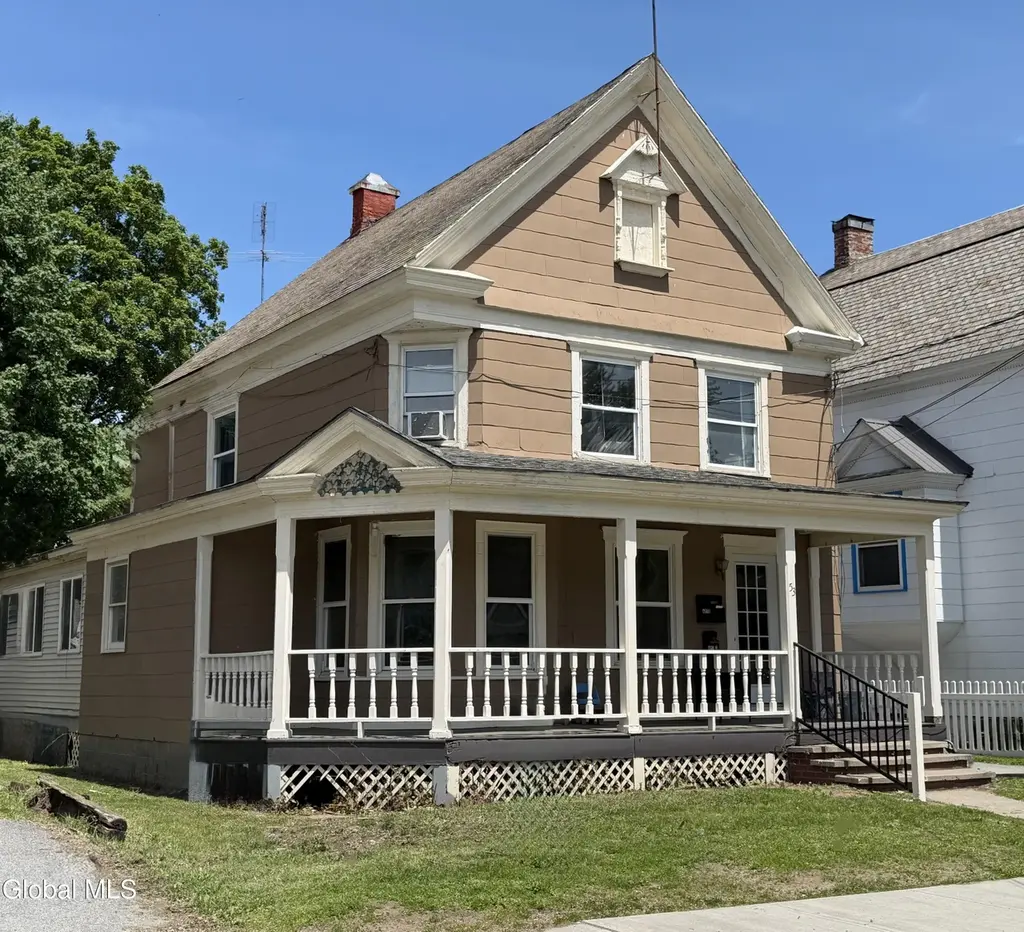
53 Maple St · Hudson Falls, NY
Flood risk 1/10 · Minimal
- FEMA flood zone
- —
- Chance of flooding over 30 yrs
- 0.0%
- Est. flood insurance / yr
- —
Fire risk 3/10 · Minor
- Est. fire insurance / yr
- $691 – $1,283
Heat risk 3/10 · Minor
- Hot days now (above 96°F)
- 7 days/yr
- Hot days in 30 yrs
- 16 days/yr
Wind risk 2/10 · Minimal
- Chance of severe wind over 30 yrs
- 3.0%
Air-quality risk 1/10 · Minimal
- Unhealthy air days now
- 0 days/yr
- Unhealthy air days in 30 yrs
- 0 days/yr
Risk factors via First Street. Map © Google.
Why this score? — see what drove the D grade
The composite is a weighted blend of 9 inputs, each scored 0–100. Each bar is that input's sub-score; the figure is the points it added to the 100-point composite (weight × sub-score).
- Appreciation +10.0/10.0
- Cash flow +8.9/30.0
- ARV discount +7.5/15.0
- Schools +3.7/10.0
- Livability +3.5/5.0
- 1% rule +3.0/10.0
- DSCR +2.5/10.0
- Rent growth +2.5/5.0
- Condition / age +2.5/5.0
$199,900
🖨 Deal sheet (PDF) 📄 Offer letter ✓ Due diligence
Listing remarks MLS
Great 2-family in nice residential area. Large apartments with storage in basement or garage. Very convenient in-town location. Replacement windows. Very Good Condition
Key facts
- Fresh paint
- Formal dining room
- Front porch
Tags
Property features AI
Finance
- Financial info: Owner pays sewer, water, snow removal, and grounds care
Exterior
- Parking: Space for 5 vehicles; Off-street paved driveway
- Security: Smoke detectors; Carbon monoxide detectors
- Utilities: Public water; Public sewer
- Home design: Duplex; Living area approx. 1,950; 0.13-acre lot
- Construction: Asbestos exterior material
- Exterior features: Wrap-around porch plus front and rear porches; Partial fencing; Shed(s) on property; Level, cleared lot
Interior
- Kitchen: Each unit includes a kitchen
- Bedrooms: Unit 1: 3 bedrooms (all on 1st floor); Unit 2: 3 bedrooms (all on 2nd floor)
- Flooring: Vinyl flooring; Hardwood flooring
- Bathrooms: 2 full bathrooms total; Unit 1: 1 full bath (1st floor); Unit 2: 1 full bath (2nd floor)
- Heating & cooling: Natural gas heating; Has heating
- Interior features: Vinyl and hardwood floors; Full basement; slab foundation
Neighborhood map
What this means for you Summary
Snapshot
- This is a 4-bed/2.0-bath other listed at $200k.
Deal economics
- At list price, monthly cash flow is $-162 ($-2k/yr) — negative.
- To cash-flow at today's rent, offer at most $171k (14.3% below list).
- To meet the 1% rule (rent ≥ 1% of price), the offer needs to be $161k (19.6% below list).
- Recommended offer: $161k (19.6% below list) — sets the bar for 1% rule.
- Cap rate 5.3% vs local median 3.9% in Hudson Falls — top-decile yield for the area; either an underpriced asset or a hidden risk that comps aren't pricing in. Stress-test before assuming the spread holds.
Location & tenants
- Location reads 69/100 on livability (#481 in NY) — a middle-class / working-renter tenant base. Strengths: housing A+, health & safety A+, cost of living A-; Watch: crime D, employment D, amenities F.
- Hudson Falls Central School District (suburban): math 39% / reading 47% proficiency, ranked #486 of 590 in NY (top 82%) — families likely to look elsewhere, expect single-tenant / working-renter base with shorter leases.
- Zoned schools: Margaret Murphy Kindergarten Center (239 students, 25% FRL); Hudson Falls Middle School (math 16% / reading 44%, grade F, #539 of 729 statewide, top 74%, 498 students, 39% FRL); Hudson Falls High School (math 87% / reading 77%, grade A, #452 of 1,100 statewide, top 44%, 694 students, 38% FRL).
- Zoned-school proficiency averages 56% at this address vs 43% district-wide (+13 pts) — the actual schools serving this property are materially stronger than the Hudson Falls Central School District average implies; a family-tenant draw the district grade alone would hide.
- Market conditions: 58 active listings in the ZIP; 106 units permitted in Washington County in 2024 (0 in 5+ unit buildings).
Forward outlook
- In year one you build about $21k of equity ($1k loan paydown + $20k appreciation (10.0% local appreciation)).
- Washington County population projected at -20% by 2050 — secular population decline; favor cash flow + early exit over multi-decade hold.
- By year 2, paydown + projected appreciation supports a ~$34k cash-out refi (75% LTV) — recoverable capital for the next deal without selling this one.
Negotiation context
- Only 4 days on market — expect competitive offers; lowballing is unlikely to land.
- 4 sale attempts since 26y ago with the ask held roughly flat each time — persistent listings suggest the price (not the market) is what's stuck; bring a comps-based counter.
- Current owner paid $70k; list at $200k implies a 186% gain — meaningful room to come down on a strong offer.
Risks & watch-outs
- Watch-outs: built in 1896 — expect roof / HVAC / electrical / plumbing capex.
Questions for the listing agent
- What do current leases actually rent for vs. the listed asking? Can we see a recent rent roll and the last 12 months of T-12 income?
- Built in 1896 — when were the roof, HVAC, electrical panel, plumbing, and water heater last replaced?
- Is there a deadline driving the sale (1031 exchange, divorce, estate, relocation)? That informs how much negotiation room exists.
- Crime grade is D in this area — have there been break-ins, vandalism, or insurance claims at this property in the last 3 years? What carrier currently insures it and at what premium?
- The area grade is low — what's the realistic commute time and amenity access for the typical tenant pool here? Any planned neighborhood developments (good or bad) we should know about?
- What's the average days-on-market for RENTAL listings here right now (not sales)? A rising rental-DOM trend means longer vacancies and softer asking-rent achievability than the comps imply.
- What's the recent tenant-quality profile in this submarket — average credit score on applications, eviction rate, late-payment / NSF rate, and stable-employment percentage? A property-management company in the area should have these aggregated.
- How much new for-sale + rental construction is in the pipeline within 1–3 miles? Heavy new supply typically softens prices + rents 12–24 months out; constrained supply supports both.
Investment metrics
- 1% rule
- 0.80% ✗
- Cap rate
- 5.32%
- Cash-on-cash
- -3.47%
- DSCR
- 0.85
- GRM
- 10.4
CMA / ARV
No comps found within radius.
Projected returns pro-forma
10.0% appreciation · 3.0% rent growth · sell at horizon
- IRR
- 21.8%
- Equity multiple
- 2.76×
- Total profit
- $98,618
- Equity at exit
- $180,086
- IRR
- 19.7%
- Equity multiple
- 6.34×
- Total profit
- $298,627
- Equity at exit
- $388,362
Cash invested: $55,972 (down + closing). Projections, not guarantees.
Landlord ↔ Tenant lean methodology
- Overall (STATE)
- 15 Strongly Tenant-Friendly
- State New York
- 15 Strongly Tenant-Friendly · D+10
- County
- — inherits STATE
- City
- — inherits STATE
ZIP-level market 12839
- Home prices YoY
- 8.5%
- Active inventory
- 58
- Price-to-rent
- 10.4×
Monthly cashflow live
- Estimated rent
- $1,606 medium interval (Pro) →
- Mortgage (P&I)
- −$1,048
- Tax from tax record
- −$299 /mo · $3,592/yr
- Insurance
- −$83
- HOA
- −$0
- Vacancy / Maint / Mgmt
- −$337
- Net cashflow
- $-162
Break-even live
Sensitivity live
| Price | -10% $-49 | -5% $-105 | +0% $-162 | +5% $-218 | +10% $-275 |
|---|---|---|---|---|---|
| Rent | -10% $-289 | -5% $-225 | +0% $-162 | +5% $-98 | +10% $-35 |
| Rate | -1.0pp $-61 | -0.5pp $-111 | base $-162 | +0.5pp $-214 | +1.0pp $-266 |
UW: 25.0% down · 7.5% · 30yr · 1.5% tax · 5.0% vac · 8.0% maint · 8.0% mgmt
Financing live
Cash to close
- Down payment
- $49,975
- Closing costs
- $5,997
- Reserves months
- —
- Total cash needed
- —
Loan-product check · same deal, 3 products live
Conventional
25% down · 7.5% · 30yr
- Down + closing
- —
- Monthly P&I
- —
- Monthly cashflow
- —
- DSCR
- —
- Eligible?
- —
Personal DTI + credit; lowest rate.
DSCR
20% down · 8.5% · 30yr
- Down + closing
- —
- Monthly P&I
- —
- Monthly cashflow
- —
- DSCR
- —
- Eligible?
- —
No personal income docs; deal must DSCR.
Hard money
10% down · 12.0% · 12mo
- Down + closing
- —
- Monthly P&I
- —
- Monthly cashflow
- —
- DSCR
- —
- Eligible?
- —
Short-term bridge; refi at stabilization.
Listing history 12 events
-
2026-06-01status $199,900 Pending 4 DOM
-
2026-05-31days on market $199,900 Active 4 DOM
-
2026-05-31days on market $199,900 Active 3 DOM
-
2026-05-27$199,900 Active
-
2012-02-16soldstatus $70,000
-
2012-02-10soldstatus $70,000 168-char remark
Show marketing remark (234 chars)
Great 2-family in nice ressidential area. Large updated apartments including all appliances. 1st floor has own laundry room. Extra storage in basement or garage. Replacement windows throughout. Vacant 2nd floor currently being painted
-
2012-02-10soldstatus $70,000 234-char remark
Show marketing remark (234 chars)
Great 2-family in nice ressidential area. Large updated apartments including all appliances. 1st floor has own laundry room. Extra storage in basement or garage. Replacement windows throughout. Vacant 2nd floor currently being painted
-
2011-06-16$85,000 168-char remark
Show marketing remark (234 chars)
Great 2-family in nice ressidential area. Large updated apartments including all appliances. 1st floor has own laundry room. Extra storage in basement or garage. Replacement windows throughout. Vacant 2nd floor currently being painted
-
2011-06-16$85,000 234-char remark
Show marketing remark (234 chars)
Great 2-family in nice ressidential area. Large updated apartments including all appliances. 1st floor has own laundry room. Extra storage in basement or garage. Replacement windows throughout. Vacant 2nd floor currently being painted
-
2000-07-03soldstatus $71,500
-
2000-06-30soldstatus $71,100
-
2000-02-03$75,000
ⓘ Source: listings_history table (triggers on properties + properties_extension) + one-shot
backfill from property_details.listing_events for pre-trigger history.
Tax reassessment forecast NY · Partial reset (capped growth)
- Current annual tax
- $3,592 · $299/mo
- Projected year-2 tax
- $3,592 · $299/mo
- Expected delta
- $0/yr ($0/mo · 0.0%)
ⓘ Screening estimate from a state-policy table — verify with the county assessor before closing.
Climate risk First Street
- Flood 1/10 Low 0% chance over 30 yrs
- Wildfire 3/10 Moderate
- Heat 3/10 Moderate 7 d/yr ≥96°F today · 16 d/yr by 30 yrs out
- Wind 2/10 Low 3% chance of damaging wind over 30 yrs
- Air quality 1/10 Low 0 unhealthy d/yr today · 0 by 30 yrs out
Nearby sold comps map
Loading sold comps map…
Walkable amenities ~0.75 mi
Loading nearby amenities…
Taxation est. · year 1
- Rental income
- $19,277
- − Mortgage interest
- −$11,198
- − Property taxes
- −$3,592
- − Insurance
- −$1,000
- − Repairs & maintenance
- −$1,542
- − Management
- −$1,542
- − Depreciation
- −$5,815
- Taxable loss
- −$5,411
- Est. tax savings @ 24.0%
- +$1,299
- After-tax cash flow
- $-643/yr
For passive investors: Depreciation is non-cash, so a rental often shows a tax loss while cash-flowing — sheltering income. Rental losses are passive: they offset passive income freely, and up to $25,000/yr can offset ordinary (W-2) income if you actively participate and your MAGI is under $100k (phasing out to $0 by $150k); unused losses carry forward. On sale, claimed depreciation is recaptured at up to 25%, and gains may owe capital-gains tax (a 1031 exchange can defer both). Figures are a year-1 estimate at your 24.0% rate — not tax advice; consult a CPA.
Schools (NCES district)
- District
- Hudson Falls Central School District
- NCES district ID
- 3614970
- Math proficiency
- 39% ▼ -8.00%
- Reading proficiency
- 47% ▲ 6.00%
- Median HH income
- $46,019
- Composite
- 36.57/100
- National rank
- #4635
- State rank
- #486 of 590 in NY
Livability — Hudson Falls
- Score
- 69/100
- State rank
- #481
- US rank
- #8482
Category grades
Schools grade is shown separately in the Schools card above.
Census & demographics
- Census place
- Hudson Falls, NY
- Population (ZIP)
- 13,618
Population outlook (Washington County) Hauer SSP2
- Today (2025)
- 59,576 people
- By 2030
- 57,618 · -3.3%
- By 2040
- 52,751 · -11.5%
- By 2050
- 47,514 · -20.2%
- By 2075
- 35,690 · -40.1%
- By 2100
- 24,807 · -58.4%
Race, ethnicity, and origin ACS 2023
- Neighborhood character
- Predominantly White (89%)
- Race & ethnicity
- White 89% Hispanic / Latino 4% Two or more races 4%
- Common ancestry
- Lithuanian 8% Slovak 5% Estonian 3%
- Foreign-born
- 5% · Canada, Guatemala
- Languages at home
- 92% English-only · Spanish 4% Other Indo-European 2% German/W. Germanic 2%
Political lean MEDSL · Washington
- 2024 margin
- Strong R (+21.2) · D 39.4% · R 60.6%
- 2008→2024 swing
- -22.0pp toward R · 2008: 0.8pp · 2024: -21.2pp
- All cycles
- 2024: R+21.2 2020: R+15.6 2016: R+20.2 2012: D+1.6 2008: D+0.8
Not yet ingested
- Civics
- —
Market trends
- HPI YoY
- ▲ 25.92%
- Current HPI
- 331.6315
- Rent YoY
- —
- Metro
- —
- State GDP YoY
- ▲ 2.60%
- F500 in state
- 92
Industry mix (Fortune 500 HQ in NY)
| Industry | F500 HQs | Revenue |
|---|---|---|
| Financial Services | 10 | $950B |
|
||
| Consumer Goods | 9 | $162B |
|
||
| Insurance | 4 | $225B |
|
||
| Telecommunications | 2 | $144B |
|
||
| Pharmaceuticals | 2 | $112B |
|
||
| Media / Entertainment | 2 | $69B |
|
||
Price history
+166.5% since first listed9 events — show timeline
- 2026-05-27 Listed $199,900 Global MLS
- 2012-02-16 Sold (Public Records) $70,000 Public Records
- 2012-02-10 Sold (MLS) $70,000 Global MLS
- 2012-02-10 Sold (MLS) $70,000 Global MLS
- 2011-06-16 Listed $85,000 Global MLS
- 2011-06-16 Listed $85,000 Global MLS
- 2000-07-03 Sold (Public Records) $71,500 Public Records
- 2000-06-30 Sold (MLS) $71,100 Global MLS
- 2000-02-03 Listed $75,000 Global MLS
Property tax history
+0.8%/yrLatest (2025): $3,592 · +11.5% YoY. Source: county tax records.
Cash-flow waterfall
monthlySold comps — $/sqft
last 12 mo · ≤1 miLoading sold comps…