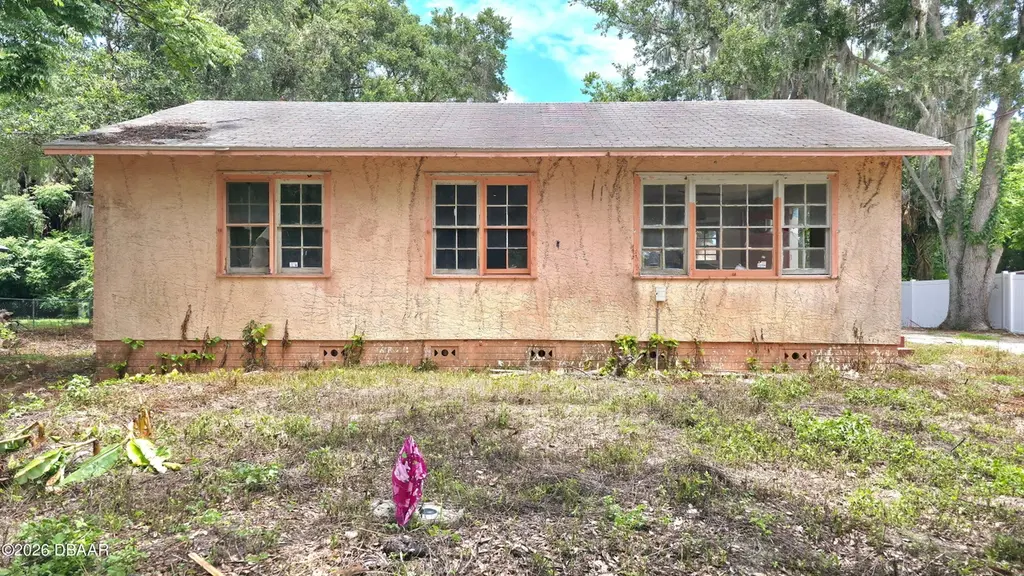
937 Benecia Ave · Daytona Beach, FL
Flood risk 6/10 · Moderate
- FEMA flood zone
- AE
- Chance of flooding over 30 yrs
- 0.44%
- Est. flood insurance / yr
- $1,737 – $8,500
Fire risk 1/10 · Minimal
- Est. fire insurance / yr
- $947 – $1,759
Heat risk 9/10 · Severe
- Hot days now (above 105°F)
- 7 days/yr
- Hot days in 30 yrs
- 18 days/yr
Wind risk 10/10 · Severe
- Chance of severe wind over 30 yrs
- 99.0%
Air-quality risk 2/10 · Minimal
- Unhealthy air days now
- 2 days/yr
- Unhealthy air days in 30 yrs
- 2 days/yr
Risk factors via First Street. Map © Google.
Why this score? — see what drove the B grade
The composite is a weighted blend of 9 inputs, each scored 0–100. Each bar is that input's sub-score; the figure is the points it added to the 100-point composite (weight × sub-score).
- Cash flow +30.0/30.0
- DSCR +10.0/10.0
- 1% rule +9.7/10.0
- ARV discount +7.5/15.0
- Livability +4.2/5.0
- Schools +3.9/10.0
- Rent growth +3.4/5.0
- Condition / age +2.5/5.0
- Appreciation +0.0/10.0
$94,900
🖨 Deal sheet (PDF) 📄 Offer letter ✓ Due diligence
Listing remarks
INVESTOR SPECIAL! Cash only opportunity in Daytona Beach. This 3-bedroom, 1-bath concrete block home sits on a large 10,018 sq ft lot and is ready for a complete renovation. Property needs extensive repairs and updates throughout and is being sold as-is. Excellent value-add opportunity for investors, flippers, or builders looking for their next project. Convenient location near major roads, shopping, schools, and employment centers. Home features approximately 988 square feet of living space and was built in 1950. Large lot provides plenty of potential for improvement and future value. Cash buyers only. Seller has never occupied the property. Buyer responsible for verifying all information
Key facts
- Complete renovation
- Large lot
- Convenient location
Tags
Property features AI
Finance
- Other: Pets allowed
- Financial info: Investor or rental-specific financial details not provided
- HOA & community: No HOA information provided
Exterior
- Parking: Detached parking
- Security: No specific security features provided
- Utilities: Public water; Electricity available; Sewer available; Water available
- Home design: Single-family residence; One story; Residential property listed as a fixer
- Construction: Block foundation; Built details not provided
- Exterior features: Patio; Chain link fenced yard; Shingle roof; Paved road access
Interior
- Kitchen: Refrigerator; Gas cooktop
- Bedrooms: Details not provided
- Flooring: Hardwood; Wood
- Bathrooms: 1 full bathroom
- Heating & cooling: No heating; No cooling
- Interior features: Unfurnished; Hardwood and wood floors; 5 total rooms
- Laundry & utility: No specific laundry details provided
Neighborhood map
What this means for you Summary
Snapshot
- This is a 2-bed/1.0-bath single-family listed at $95k.
Deal economics
- At list price, monthly cash flow is $5 ($63/yr) — positive.
- The deal already cash-flows at list — no discount required.
- Meets the 1% rule at list price ($1k rent vs $95k).
Location & tenants
- Location reads 83/100 on livability (#46 in FL, #867 nationally) — a professional / high-income tenant draw. Strengths: amenities A+, commute A+, cost of living A+; Watch: employment D-.
- Volusia (suburban): math 44% / reading 49% proficiency, ranked #47 of 73 in FL (top 64%) — families likely to look elsewhere, expect single-tenant / working-renter base with shorter leases.
- Zoned schools: Turie T. Small Elementary School (math 35% / reading 29%, grade F, #1,797 of 2,144 statewide, top 86%, 383 students, 91% FRL); Campbell Middle School (math 28% / reading 30%, grade F, #479 of 571 statewide, top 84%, 855 students, 80% FRL); Spruce Creek High School (math 37% / reading 61%, grade D, #193 of 667 statewide, top 29%, 2,569 students, 37% FRL) — zoned schools average 69% FRL vs 51% district-wide (18 pts higher); higher-poverty schools than district average — tighter screening recommended.
- Market conditions: Rents rising (+3.6%/yr); 317 active listings in the ZIP; 40 comparable units currently listed for rent nearby; rentals at typical pace (median 25d on market — plan ~3-4 weeks tenant-placement turnaround); lower-income renter base — watch delinquency; 3,402 units permitted in Volusia County in 2024 (681 in 5+ unit buildings).
- This rent runs 40% of the median local income ($42k/yr) — at the standard rent-burdened threshold; future hikes will face affordability resistance.
Forward outlook
- Local home prices are declining (-3.0%/yr); year-one equity from $656 of loan paydown is wiped out by about $3k of value loss. Plan a longer hold.
- Volusia County population projected at +19% by 2050 — long-run rental-demand tailwind backs the buy-and-hold thesis.
Negotiation context
- Only 11 days on market — expect competitive offers; lowballing is unlikely to land.
- Current owner paid $12k; list at $95k implies a 691% gain — meaningful room to come down on a strong offer.
Risks & watch-outs
- Watch-outs: flood insurance adds $427/mo; built in 1950 — expect roof / HVAC / electrical / plumbing capex.
- Climate carrying-cost: in FEMA flood zone AE (mandatory federal flood insurance); severe wind risk, 99% chance of damaging wind over 30y; extreme-heat days projected 7→18/yr by 2055 (HVAC capex compounding) — expect insurance premiums to compound above CPI over the hold.
Questions for the listing agent
- Built in 1950 — when were the roof, HVAC, electrical panel, plumbing, and water heater last replaced?
- What's the actual annual flood-insurance premium (NFIP or private), and is the property in a SFHA with mandatory coverage?
- Is there a deadline driving the sale (1031 exchange, divorce, estate, relocation)? That informs how much negotiation room exists.
- Schools are D-rated, which usually means shorter tenancies and higher turnover. Who's the typical renter profile here, and what's been the actual vacancy rate?
- What's the average days-on-market for RENTAL listings here right now (not sales)? A rising rental-DOM trend means longer vacancies and softer asking-rent achievability than the comps imply.
- What's the recent tenant-quality profile in this submarket — average credit score on applications, eviction rate, late-payment / NSF rate, and stable-employment percentage? A property-management company in the area should have these aggregated.
- How much new for-sale + rental construction is in the pipeline within 1–3 miles? Heavy new supply typically softens prices + rents 12–24 months out; constrained supply supports both.
Investment metrics
- 1% rule
- 1.47% ✓
- Cap rate
- 11.75%
- Cash-on-cash
- 19.50%
- DSCR
- 1.87
- GRM
- 5.7
CMA / ARV
No comps found within radius.
Projected returns pro-forma
-3.0% appreciation · 3.57% rent growth · sell at horizon
- IRR
- -14.5%
- Equity multiple
- 0.48×
- Total profit
- $-13,945
- Equity at exit
- $14,150
- IRR
- -3.9%
- Equity multiple
- 0.73×
- Total profit
- $-7,176
- Equity at exit
- $8,205
Cash invested: $26,572 (down + closing). Projections, not guarantees.
Landlord ↔ Tenant lean methodology
- Overall (STATE)
- 87 Strongly Landlord-Friendly
- State Florida
- 87 Strongly Landlord-Friendly · R+3
- County
- — inherits STATE
- City
- — inherits STATE
ZIP-level market 32114
- Home prices YoY
- -21.8%
- Rents YoY
- 3.6%
- Active inventory
- 317
- Price-to-rent
- 5.7×
Monthly cashflow live
- Estimated rent
- $1,397 high interval (Pro) →
- Mortgage (P&I)
- −$498
- Tax from tax record
- −$135 /mo · $1,619/yr
- Insurance
- −$40
- Flood insurance flood zone
- −$427 /mo · $5,118/yr
- HOA
- −$0
- Vacancy / Maint / Mgmt
- −$293
- Net cashflow
- $5
Break-even live
Sensitivity live
| Price | -10% $59 | -5% $32 | +0% $5 | +5% $-22 | +10% $-48 |
|---|---|---|---|---|---|
| Rent | -10% $-105 | -5% $-50 | +0% $5 | +5% $60 | +10% $116 |
| Rate | -1.0pp $53 | -0.5pp $29 | base $5 | +0.5pp $-19 | +1.0pp $-44 |
UW: 25.0% down · 7.5% · 30yr · 1.5% tax · 5.0% vac · 8.0% maint · 8.0% mgmt
Financing live
Cash to close
- Down payment
- $23,725
- Closing costs
- $2,847
- Reserves months
- —
- Total cash needed
- —
Loan-product check · same deal, 3 products live
Conventional
25% down · 7.5% · 30yr
- Down + closing
- —
- Monthly P&I
- —
- Monthly cashflow
- —
- DSCR
- —
- Eligible?
- —
Personal DTI + credit; lowest rate.
DSCR
20% down · 8.5% · 30yr
- Down + closing
- —
- Monthly P&I
- —
- Monthly cashflow
- —
- DSCR
- —
- Eligible?
- —
No personal income docs; deal must DSCR.
Hard money
10% down · 12.0% · 12mo
- Down + closing
- —
- Monthly P&I
- —
- Monthly cashflow
- —
- DSCR
- —
- Eligible?
- —
Short-term bridge; refi at stabilization.
Rent comps 40 comps
| Address | Beds | Baths | Sqft | Rent | $/sqft | DOM | Units | Dist |
|---|---|---|---|---|---|---|---|---|
| 908 Lora St Unit A Daytona Beach, FL | 2.0 | 1.0 | 775 | $1,300 | $1.68 | 25d | 1 | 0.14mi |
| 940 Lockhart St Daytona Beach, FL | 3.0 | 2.0 | 1071 | $1,850 | $1.73 | 20d | 1 | 0.14mi |
| 751 Bellevue Ave Unit 1 Daytona Beach, FL | 2.0 | 1.0 | 816 | $1,390 | $1.70 | 25d | 1 | 0.23mi |
| 886 S Nova Rd Daytona Beach, FL | 1.0–2.0 | 1.0 | 685 | $1,260 | $1.84 | 12d | 10 | 0.36mi |
| 1220 S Nova Rd Daytona Beach, FL | 1.0 | 1.0 | 576 | $955 | $1.66 | 12d | 11 | 0.52mi |
| 311 Country Club Oval Unit 311-208 Daytona Beach, FL | 1.0 | 1.0 | 578 | $1,095 | $1.89 | 25d | 1 | 0.79mi |
| 311 Country Club Oval Unit 311-203 Daytona Beach, FL | 1.0 | 1.0 | 578 | $1,250 | $2.16 | 25d | 1 | 0.79mi |
| 311 Country Club Oval Unit 311-112 Daytona Beach, FL | 2.0 | 1.0 | 940 | $1,375 | $1.46 | 16d | 1 | 0.79mi |
| 313 Country Club Oval Unit 313-4 Daytona Beach, FL | 1.0 | 1.0 | 650 | $1,250 | $1.92 | 25d | 1 | 0.81mi |
| 422 Henry Butts Dr Daytona Beach, FL | 1.0 | 1.0 | 851 | $875 | $1.03 | 25d | 1 | 0.82mi |
| 538 Park Dr Daytona Beach, FL | 2.0 | 1.0 | 600 | $1,400 | $2.33 | 25d | 1 | 0.88mi |
| 315 Wilder Blvd Daytona Beach, FL | 2.0 | 1.0 | 850 | $1,075 | $1.26 | 25d | 1 | 0.88mi |
| 700 Northern Rd Unit 728 South Daytona, FL | 1.0 | 1.0 | 774 | $1,240 | $1.60 | 25d | 1 | 0.89mi |
| 528 Park Dr Daytona Beach, FL | 2.0 | 1.0 | 600 | $1,600 | $2.67 | 25d | 1 | 0.89mi |
| 1350 Virginia Ave Apt 17 Daytona Beach, FL | 2.0 | 2.0 | 950 | $1,399 | $1.47 | 25d | 1 | 0.91mi |
| 1500 Virginia Ave Daytona Beach, FL | 2.0 | 2.0 | 910 | $1,475 | $1.62 | 25d | 1 | 0.95mi |
| 417 Maple St Daytona Beach, FL | 2.0 | 1.0 | 768 | $850 | $1.11 | 25d | 1 | 0.96mi |
| 1504 Virginia Ave Daytona Beach, FL | 1.0–2.0 | 1.0–2.0 | 842 | $1,650 | $1.96 | 25d | 3 | 0.98mi |
| 1351 S Ridgewood Ave #26 Daytona Beach, FL | 2.0 | 1.5 | 988 | $1,285 | $1.30 | 16d | 1 | 1.00mi |
| 350 Maple St Daytona Beach, FL | 1.0 | 1.0 | 600 | $900 | $1.50 | 25d | 1 | 1.01mi |
| 633 S Palmetto Ave Daytona Beach, FL | 1.0–2.0 | 1.0–2.0 | 661 | $1,300 | $1.97 | 25d | 2 | 1.02mi |
| 1401 S Palmetto Ave Daytona Beach, FL | 1.0–2.0 | 1.0–2.0 | 890 | $1,800 | $2.02 | 25d | 3 | 1.09mi |
| 118 Cedar St Daytona Beach, FL | 2.0 | 1.0 | 537 | $1,870 | $3.48 | 12d | 28 | 1.10mi |
| 342 S Segrave St Daytona Beach, FL | 2.0 | 1.0 | 900 | $1,125 | $1.25 | 25d | 1 | 1.13mi |
| 1229 S Beach St Daytona Beach, FL | 1.0–3.0 | 1.0–2.0 | 906 | $1,565 | $1.73 | 20d | 1 | 1.14mi |
| 860 Magnolia Ave Unit 3 Daytona Beach, FL | 2.0 | 1.0 | 800 | $1,300 | $1.62 | 20d | 1 | 1.15mi |
| 719 S Beach St Unit 314B Daytona Beach, FL | 1.0 | 1.0 | 715 | $1,200 | $1.68 | 25d | 1 | 1.17mi |
| 719 S Beach St Unit 304 Daytona Beach, FL | 1.0 | 1.0 | 715 | $1,250 | $1.75 | 25d | 1 | 1.17mi |
| 1739 Eastern Rd South Daytona, FL | 1.0 | 1.0 | 800 | $1,099 | $1.37 | 16d | 1 | 1.18mi |
| 500 S Beach St Unit K1 Daytona Beach, FL | 2.0 | 1.0 | 750 | $1,050 | $1.40 | 16d | 1 | 1.19mi |
| 500 S Beach St Unit K2 Daytona Beach, FL | 2.0 | 1.0 | 750 | $1,050 | $1.40 | 22d | 1 | 1.19mi |
| 213 Live Oak Ave Unit B Daytona Beach, FL | 2.0 | 1.0 | 900 | $1,285 | $1.43 | 25d | 1 | 1.20mi |
| 213 Live Oak Ave Unit A Daytona Beach, FL | 2.0 | 1.0 | 900 | $1,255 | $1.39 | 25d | 1 | 1.20mi |
| 1017 June Ter Lot 6 Daytona Beach, FL | 2.0 | 1.0 | 700 | $1,350 | $1.93 | 25d | 1 | 1.20mi |
| 721 S Beach St Unit 115A Daytona Beach, FL | 2.0 | 2.0 | 1025 | $1,850 | $1.80 | 16d | 1 | 1.23mi |
| 1620 S Palmetto Ave Unit 206 South Daytona, FL | 2.0 | 1.0 | 850 | $1,295 | $1.52 | 22d | 1 | 1.25mi |
| 1620 S Palmetto Ave South Daytona, FL | 1.0 | 1.0 | 750 | $1,195 | $1.59 | 25d | 1 | 1.25mi |
| 900 Boulder Dr South Daytona, FL | 2.0 | 1.0 | 939 | $1,850 | $1.97 | 25d | 1 | 1.30mi |
| 1401 S Clyde Morris Blvd Daytona Beach, FL | 1.0 | 1.0 | 576 | $1,272 | $2.21 | 25d | 5 | 1.31mi |
| 17 Kimberly Ct Daytona Beach, FL | 2.0 | 2.0 | 896 | $1,299 | $1.45 | 25d | 1 | 1.35mi |
Listing history 7 events
-
2026-06-22pricedays on market $94,900 Active 11 DOM
-
2026-06-18days on market $104,900 Active 8 DOM
-
2026-06-17days on market $104,900 Active 7 DOM
-
2026-06-16days on market $104,900 Active 6 DOM
-
2026-06-15days on market $104,900 Active 5 DOM
-
2026-06-14remarks 699-char remark
-
2026-06-14$104,900 Active 3 DOM
ⓘ Source: listings_history table (triggers on properties + properties_extension) + one-shot
backfill from property_details.listing_events for pre-trigger history.
Tax reassessment forecast FL · Resets to sale price
- Current annual tax
- $1,619 · $135/mo
- Projected year-2 tax
- $1,619 · $135/mo
- Expected delta
- $0/yr ($0/mo · 0.0%)
ⓘ Screening estimate from a state-policy table — verify with the county assessor before closing.
Climate risk First Street
- Flood 6/10 Major FEMA zone AE · 44% chance over 30 yrs
- Wildfire 1/10 Low
- Heat 9/10 Extreme 7 d/yr ≥105°F today · 18 d/yr by 30 yrs out
- Wind 10/10 Extreme 99% chance of damaging wind over 30 yrs
- Air quality 2/10 Low 2 unhealthy d/yr today · 2 by 30 yrs out
Nearby sold comps map
Loading sold comps map…
Walkable amenities ~0.75 mi
Loading nearby amenities…
Taxation est. · year 1
- Rental income
- $16,768
- − Mortgage interest
- −$5,316
- − Property taxes
- −$1,619
- − Insurance
- −$5,593
- − Repairs & maintenance
- −$1,341
- − Management
- −$1,341
- − Depreciation
- −$2,761
- Taxable loss
- −$1,203
- Est. tax savings @ 24.0%
- +$289
- After-tax cash flow
- $352/yr
For passive investors: Depreciation is non-cash, so a rental often shows a tax loss while cash-flowing — sheltering income. Rental losses are passive: they offset passive income freely, and up to $25,000/yr can offset ordinary (W-2) income if you actively participate and your MAGI is under $100k (phasing out to $0 by $150k); unused losses carry forward. On sale, claimed depreciation is recaptured at up to 25%, and gains may owe capital-gains tax (a 1031 exchange can defer both). Figures are a year-1 estimate at your 24.0% rate — not tax advice; consult a CPA.
Schools (NCES district)
- District
- Volusia
- NCES district ID
- 1201920
- Math proficiency
- 44% ▼ -9.00%
- Reading proficiency
- 49% ▼ -3.00%
- Median HH income
- $42,946
- Composite
- 39.2/100
- National rank
- #4019
- State rank
- #47 of 73 in FL
Livability — Daytona Beach
- Score
- 83/100
- State rank
- #46
- US rank
- #867
Category grades
Schools grade is shown separately in the Schools card above.
Census & demographics
- Census place
- Daytona Beach, FL
- County
- Volusia County · 556,871 people
- City population
- 67,539
- Metro
- Deltona-Daytona Beach-Ormond Beach, FL
- Population (ZIP)
- 37,747
- Household income
- $41,736
- Rent vs Own
- Severe rent burden
- 2772.0
Population outlook (Volusia County) Hauer SSP2
- Today (2025)
- 572,749 people
- By 2030
- 598,695 · +4.5%
- By 2040
- 644,880 · +12.6%
- By 2050
- 681,451 · +19.0%
- By 2075
- 759,957 · +32.7%
- By 2100
- 778,902 · +36.0%
Race, ethnicity, and origin ACS 2023
- Neighborhood character
- Diverse neighborhood (Simpson 0.65)
- Race & ethnicity
- Black 45% White 36% Hispanic / Latino 11% Two or more races 7% Asian 2%
- Hispanic origin (detail)
- Mexican 2% Puerto Rican 4%
- Common ancestry
- Romanian 1% Slovak 1% Lithuanian 1%
- Foreign-born
- 7% · Canada, South Korea
- Languages at home
- 90% English-only · Spanish 7% Arabic 1%
Political lean MEDSL · Volusia
- 2024 margin
- Strong R (+21.8) · D 38.7% · R 60.5%
- 2008→2024 swing
- -27.4pp toward R · 2008: 5.7pp · 2024: -21.8pp
- All cycles
- 2024: R+21.8 2020: R+14.1 2016: R+13.1 2012: R+1.2 2008: D+5.7
Not yet ingested
- Civics
- —
Market trends
- HPI YoY
- ▼ -75.93%
- Current HPI
- 272.5149
- Rent YoY
- ▲ 3.57%
- Metro
- Deltona-Daytona Beach-Ormond Beach, FL
- State GDP YoY
- ▲ 3.28%
- F500 in state
- 36
Industry mix (Fortune 500 HQ in FL)
| Industry | F500 HQs | Revenue |
|---|---|---|
| Industrial Technology | 2 | $29B |
|
||
| Insurance | 2 | $17B |
|
||
| Retail | 1 | $60B |
|
||
| Technology Distribution | 1 | $58B |
|
||
| Homebuilding | 1 | $35B |
|
||
| Technology Manufacturing | 1 | $35B |
|
||
Price history
+774.2% since first listed2 events — show timeline
- 2026-06-09 Listed $104,900 Daytona MLS
- 1977-01-01 Sold (Public Records) $12,000 Public Records
Property tax history
+15.4%/yrLatest (2023): $1,619 · +23.6% YoY. Source: county tax records.
Cash-flow waterfall
monthlySold comps — $/sqft
last 12 mo · ≤1 miLoading sold comps…