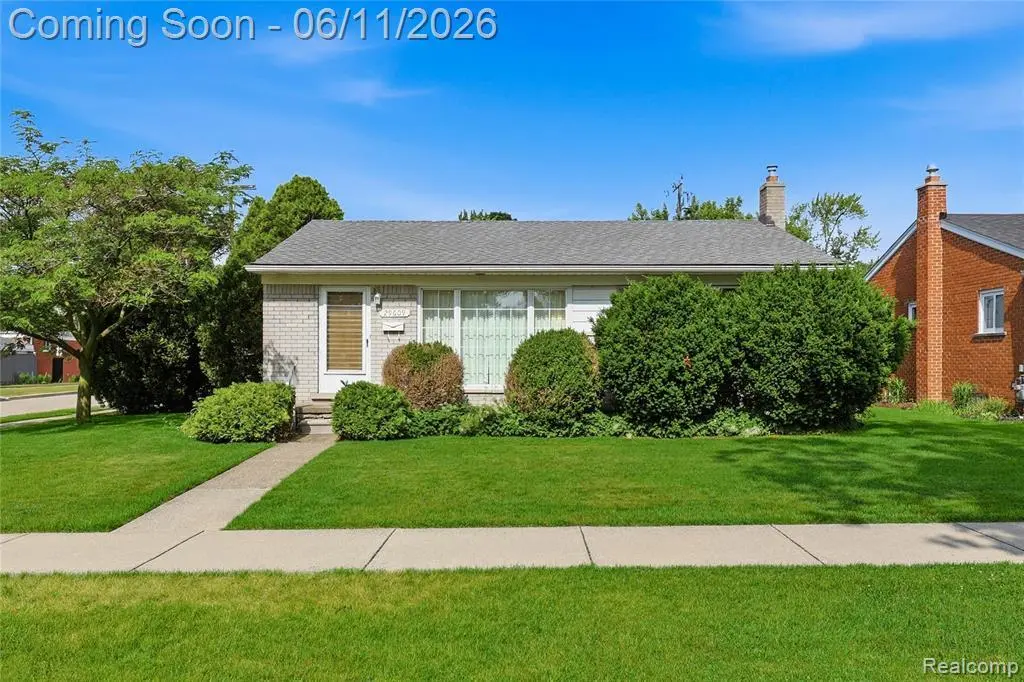
29609 Mark Ave · Madison Heights, MI
Flood risk 5/10 · Moderate
- FEMA flood zone
- X (unshaded)
- Chance of flooding over 30 yrs
- 0.45%
- Est. flood insurance / yr
- $473 – $860
Fire risk 1/10 · Minimal
- Est. fire insurance / yr
- $784 – $1,456
Heat risk 3/10 · Minor
- Hot days now (above 98°F)
- 7 days/yr
- Hot days in 30 yrs
- 15 days/yr
Wind risk 2/10 · Minimal
- Chance of severe wind over 30 yrs
- —
Air-quality risk 3/10 · Minor
- Unhealthy air days now
- 3 days/yr
- Unhealthy air days in 30 yrs
- 5 days/yr
Risk factors via First Street. Map © Google.
Why this score? — see what drove the C grade
The composite is a weighted blend of 9 inputs, each scored 0–100. Each bar is that input's sub-score; the figure is the points it added to the 100-point composite (weight × sub-score).
- Cash flow +19.5/30.0
- ARV discount +15.0/15.0
- DSCR +6.2/10.0
- 1% rule +5.0/10.0
- Livability +4.0/5.0
- Schools +3.3/10.0
- Rent growth +3.2/5.0
- Condition / age +2.5/5.0
- Appreciation +0.0/10.0
$234,900
🖨 Deal sheet 📄 Offer letter ✓ Due diligence
Listing remarks MLS
* * * MULTIPLE OFFERS RECEIVED!! I need highest and best by 8pm Friday 6/12/26! * * * * Here is the charming mid-century modern ranch you've been waiting for! Welcome home to this beautifully cared-for home featuring three bedrooms all featuring the original vintage hardwood floors. The main bathroom features authentic 1950's tiles and it is so clean, you won't believe that it's vintage - and there is a half bathroom in the finished basement too! You'll love the large, eat-in kitchen and there are so many possibilities if you want to expand it or update it. Just off the kitchen is an awesome sunroom addition providing another living room, craft room, office or entertaining/relaxing space. Set on a nicely landscaped corner lot in a peaceful neighborhood, this home boasts curb appeal and has a fully fenced yard. There is ample space for entertaining, gardening, or playing in this yard and there's even a built in charcoal grill for those fun BBQ's and get-togethers with friends and loved ones! The detached 1.5-car garage offers secure parking and storage, while the finished basement adds valuable additional living space - ideal for a home office, workshop, recreation area, or extra storage, and there is a half bathroom and laundry room area also! Meticulous maintenance and pride of ownership is evident throughout. This is a great opportunity to own a fabulous home with good, solid bones and endless potential in Madison Heights. This home is within the Lamphere School District, which has earned the prestigious National Blue Ribbon School designation and is zoned for Lessenger Elementary and John Page Middle School. Updates include: Updated electrical, Weather Guard windows throughout (with ten more years left on the transferrable warranty), Sunroom, and New tear off roof in 2021! Priced lower than the competition to reflect the needed updates so don't miss out on this one and call today to schedule a showing! Immediate Occupancy. BATVAI and homestead taxes.
Key facts
- Sunroom addition
- Fully fenced yard
- 6,970 sq ft lot
Tags
Property features AI
Exterior
- Parking: Detached garage; 2 garage spaces; Driveway; Garage door opener; Garage with workshop area; Assigned parking; Garage faces rear/side
- Utilities: Public water; Public sewer; Circuit breaker electric service; Sewer available
- Home design: Single-family residence; One level; Ground-level entry; Brick construction
- Construction: Brick construction; Asphalt roof; Partially finished basement (with bath stubbed)
- Exterior features: Porch; Barbecue; Back yard with fencing (fenced); Corner lot; Paved road access
Interior
- Kitchen: Free-standing refrigerator; Free-standing freezer
- Bedrooms: Total of 6 rooms (bedroom count not specified)
- Bathrooms: 1 full bathroom; 1 half bathroom
- Heating & cooling: Central air; Attic fan; Ceiling fans; Forced air heating (natural gas)
- Interior features: ENERGY STAR qualified windows; Partially finished basement with bath rough-in
- Laundry & utility: Laundry room; Washer; Dryer; Gas water heater
Neighborhood map
What this means for you Summary
Snapshot
- This is a 3-bed/1.5-bath single-family listed at $235k.
Deal economics
- At list price, monthly cash flow is $266 ($3k/yr) — positive.
- The deal already cash-flows at list — no discount required.
- To meet the 1% rule (rent ≥ 1% of price), the offer needs to be $234k (0.4% below list).
- Recommended offer: $234k (0.4% below list) — sets the bar for 1% rule.
- Cap rate 7.7% vs local median 5.7% in Madison Heights — top-decile yield for the area; either an underpriced asset or a hidden risk that comps aren't pricing in. Stress-test before assuming the spread holds.
Location & tenants
- Location reads 81/100 on livability (#62 in MI, #1,347 nationally) — a professional / high-income tenant draw. Strengths: commute A+, cost of living A+, housing A+; Watch: schools D+, health & safety D.
- Lamphere Public Schools (suburban): math 28% / reading 49% proficiency, ranked #235 of 540 in MI (top 44%) — families likely to look elsewhere, expect single-tenant / working-renter base with shorter leases.
- Market conditions: Rents rising (+2.8%/yr); 135 active listings in the ZIP; 19 comparable units currently listed for rent nearby; rentals leasing fast (median 3d on market — plan ~1-2 weeks tenant-placement turnaround); 2,614 units permitted in Oakland County in 2024 (721 in 5+ unit buildings).
- This rent runs 40% of the median local income ($70k/yr) — at the standard rent-burdened threshold; future hikes will face affordability resistance.
Forward outlook
- Local home prices are declining (-3.0%/yr); year-one equity from $2k of loan paydown is wiped out by about $7k of value loss. Plan a longer hold.
- Oakland County population projected at +10% by 2050 — modest demand growth; plan on rents tracking national, not racing it.
Negotiation context
- Only 6 days on market — expect competitive offers; lowballing is unlikely to land.
- 2 sale attempts with the ask held roughly flat each time — persistent listings suggest the price (not the market) is what's stuck; bring a comps-based counter.
Risks & watch-outs
- Watch-outs: built in 1955 — expect roof / HVAC / electrical / plumbing capex.
- Climate carrying-cost: moderate flood risk — expect insurance premiums to compound above CPI over the hold.
Questions for the listing agent
- Built in 1955 — when were the roof, HVAC, electrical panel, plumbing, and water heater last replaced?
- Is there a deadline driving the sale (1031 exchange, divorce, estate, relocation)? That informs how much negotiation room exists.
- Schools are D-rated, which usually means shorter tenancies and higher turnover. Who's the typical renter profile here, and what's been the actual vacancy rate?
- What's the average days-on-market for RENTAL listings here right now (not sales)? A rising rental-DOM trend means longer vacancies and softer asking-rent achievability than the comps imply.
- What's the recent tenant-quality profile in this submarket — average credit score on applications, eviction rate, late-payment / NSF rate, and stable-employment percentage? A property-management company in the area should have these aggregated.
- How much new for-sale + rental construction is in the pipeline within 1–3 miles? Heavy new supply typically softens prices + rents 12–24 months out; constrained supply supports both.
Investment metrics
- 1% rule
- 1.00% ✗
- Cap rate
- 7.65%
- Cash-on-cash
- 4.86%
- DSCR
- 1.22
- GRM
- 8.4
CMA / ARV
- ARV (on-the-fly)
- $329,132
- Comps found
- 12
Show comp detail 12 sales within ~0.75 mi
| Address | Dist | Beds/Ba | Sqft | Sold | Price | $/sf | Match |
|---|---|---|---|---|---|---|---|
| 2611 N Wilson Ave | 0.34mi | 3/2.0 | 1,539 (+0%) | 6mo | $385,000 | $250 | 77 |
| 30344 Garry Ave | 0.39mi | 3/1.0 | 1,521 (-1%) | 4mo | $230,900 | $152 | 75 |
| 2612 N Wilson Ave | 0.32mi | 3/2.0 | 1,641 (+7%) | 0mo | $344,000 | $210 | 72 |
| 29361 Mark Ave | 0.12mi | 3/1.5 | 1,740 (+13%) | 1mo | $281,500 | $162 | 72 |
| 30725 Whittier Ave | 0.57mi | 3/2.0 | 1,579 (+3%) | 1mo | $315,000 | $199 | 66 |
| 3202 N Wilson Ave | 0.61mi | 3/2.0 | 1,522 (-1%) | 4mo | $325,000 | $214 | 64 |
| 1617 N Vermont Ave | 0.64mi | 3/2.0 | 1,587 (+3%) | 0mo | $420,000 | $265 | 63 |
| 3015 N Vermont Ave | 0.61mi | 3/1.0 | 1,680 (+9%) | 0mo | $301,900 | $180 | 54 |
| 2918 N Altadena Ave | 0.67mi | 3/2.0 | 1,682 (+9%) | 2mo | $370,000 | $220 | 49 |
| 2926 N Altadena Ave | 0.69mi | 3/1.0 | 1,395 (-9%) | 3mo | $316,000 | $227 | 48 |
| 30791 Whittier Ave | 0.58mi | 3/1.5 | 1,765 (+15%) | 1mo | $302,500 | $171 | 48 |
| 1205 N Wilson Ave | 0.73mi | 3/1.5 | 1,354 (-12%) | 2mo | $335,000 | $247 | 44 |
Match score weights: distance 35% · size 25% · config 20% · recency 20%. Top-matched comps best support the ARV.
Projected returns pro-forma
-3.0% appreciation · 2.81% rent growth · sell at horizon
- IRR
- -8.9%
- Equity multiple
- 0.67×
- Total profit
- $-21,548
- Equity at exit
- $35,024
- IRR
- 0.3%
- Equity multiple
- 1.02×
- Total profit
- $1,281
- Equity at exit
- $20,310
Cash invested: $65,772 (down + closing). Projections, not guarantees.
Landlord ↔ Tenant lean methodology
- Overall (STATE)
- 62 Landlord-Friendly
- State Michigan
- 62 Landlord-Friendly · EVEN
- County
- — inherits STATE
- City
- — inherits STATE
ZIP-level market 48071
- Rents YoY
- 2.8%
- Active inventory
- 135
- Price-to-rent
- 8.4×
Monthly cashflow live
- Estimated rent
- $2,340 high interval (Pro) →
- Mortgage (P&I)
- −$1,232
- Tax from tax record
- −$253 /mo · $3,034/yr
- Insurance
- −$98
- HOA
- −$0
- Vacancy / Maint / Mgmt
- −$491
- Net cashflow
- $266
Break-even live
UW: 25.0% down · 7.5% · 30yr · 1.5% tax · 5.0% vac · 8.0% maint · 8.0% mgmt
Financing live
Cash to close
- Down payment
- $58,725
- Closing costs
- $7,047
- Reserves months
- —
- Total cash needed
- —
Loan-product check · same deal, 3 products live
Conventional
25% down · 7.5% · 30yr
- Down + closing
- —
- Monthly P&I
- —
- Monthly cashflow
- —
- DSCR
- —
- Eligible?
- —
Personal DTI + credit; lowest rate.
DSCR
20% down · 8.5% · 30yr
- Down + closing
- —
- Monthly P&I
- —
- Monthly cashflow
- —
- DSCR
- —
- Eligible?
- —
No personal income docs; deal must DSCR.
Hard money
10% down · 12.0% · 12mo
- Down + closing
- —
- Monthly P&I
- —
- Monthly cashflow
- —
- DSCR
- —
- Eligible?
- —
Short-term bridge; refi at stabilization.
Rent comps 19 comps
| Address | Beds | Baths | Sqft | Rent | $/sqft | DOM | Units | Dist |
|---|---|---|---|---|---|---|---|---|
| 642 Bellaire Ave Madison Heights, MI | 3.0 | 2.5 | 1750 | $2,423 | $1.38 | 21d | 1 | 0.73mi |
| 1132 N Campbell Rd Royal Oak, MI | 1.0–3.0 | 1.0–1.5 | 1050 | $2,085 | $1.99 | 1d | 7 | 0.79mi |
| 1106 Grove Ave Royal Oak, MI | 4.0 | 2.5 | 1289 | $2,325 | $1.80 | 1d | 1 | 0.82mi |
| 614 E 13 Mile Rd Royal Oak, MI | 2.0 | 1.0 | 1434 | $2,995 | $2.09 | 1d | 1 | 0.91mi |
| 508 Marlin Ave Royal Oak, MI | 3.0 | 2.5 | 1678 | $3,000 | $1.79 | 20d | 1 | 0.98mi |
| 300 E Thirteen Mile Rd Madison Heights, MI | 2.0 | 1.5 | 1350 | $1,475 | $1.09 | 17d | 1 | 1.07mi |
| 324 E Thirteen Mile Rd Madison Heights, MI | 1.0–2.0 | 1.0–1.5 | 950 | $1,775 | $1.87 | 2d | 1 | 1.12mi |
| 2702 N Main St Royal Oak, MI | 3.0 | 1.5 | 1500 | $2,350 | $1.57 | 2d | 1 | 1.19mi |
| 29607 Howard Ave Madison Heights, MI | 3.0 | 2.5 | 1956 | $1,950 | $1.00 | 43d | 1 | 1.20mi |
| 709 Hawthorn Ave Royal Oak, MI | 3.0 | 1.5 | 2248 | $3,000 | $1.33 | 24d | 1 | 1.21mi |
| 406 N Campbell Rd Royal Oak, MI | 3.0 | 2.0 | 1814 | $2,500 | $1.38 | 1d | 1 | 1.22mi |
| 1608 Bauman Ave Royal Oak, MI | 3.0 | 1.5 | 1233 | $2,300 | $1.87 | 1d | 1 | 1.23mi |
| 317 E Irving Ave Madison Heights, MI | 2.0 | 2.5 | 1560 | $2,700 | $1.73 | 1d | 1 | 1.24mi |
| 1814 N Center St Royal Oak, MI | 3.0 | 1.5 | 1072 | $1,790 | $1.67 | 3d | 1 | 1.28mi |
| 1045 E 12 Mile Rd Madison Heights, MI | 3.0 | 1.0 | 1700 | $4,000 | $2.35 | 1d | 1 | 1.39mi |
| 1712 Midtown Cir Royal Oak, MI | 2.0–3.0 | 2.0–2.5 | 1550 | $2,901 | $1.87 | 1d | 8 | 1.41mi |
| 211 Woodsboro Dr Unit LOWER Royal Oak, MI | 3.0 | 2.0 | 1800 | $1,425 | $0.79 | 24d | 1 | 1.41mi |
| 3810 S Rochester Rd Royal Oak, MI | 2.0 | 1.5 | 1208 | $1,800 | $1.49 | 24d | 1 | 1.42mi |
| 1414 Crooks Rd Unit 2 Royal Oak, MI | 3.0 | 2.0 | 1400 | $1,800 | $1.29 | 24d | 1 | 1.43mi |
Listing history 5 events
-
2026-06-17status $234,900 Pending 6 DOM
-
2026-06-16days on market $234,900 Active 6 DOM
-
2026-06-15days on market $234,900 Active 5 DOM
-
2026-06-13remarks 699-char remark
-
2026-06-13$234,900 Active 3 DOM
ⓘ Source: listings_history table (triggers on properties + properties_extension) + one-shot
backfill from property_details.listing_events for pre-trigger history.
Tax reassessment forecast MI · Partial reset (capped growth)
- Current annual tax
- $3,034 · $253/mo
- Projected year-2 tax
- $3,326 · $277/mo
- Expected delta
- +$292/yr (+$24/mo · 9.6%)
ⓘ Screening estimate from a state-policy table — verify with the county assessor before closing.
Climate risk First Street
- Flood 5/10 Major FEMA zone X (unshaded) · 45% chance over 30 yrs
- Wildfire 1/10 Low
- Heat 3/10 Moderate 7 d/yr ≥98°F today · 15 d/yr by 30 yrs out
- Wind 2/10 Low
- Air quality 3/10 Moderate 3 unhealthy d/yr today · 5 by 30 yrs out
Nearby sold comps map
Loading sold comps map…
Walkable amenities ~0.75 mi
Loading nearby amenities…
Taxation est. · year 1
- Rental income
- $28,082
- − Mortgage interest
- −$13,158
- − Property taxes
- −$3,034
- − Insurance
- −$1,174
- − Repairs & maintenance
- −$2,247
- − Management
- −$2,247
- − Depreciation
- −$6,833
- Taxable loss
- −$611
- Est. tax savings @ 24.0%
- +$147
- After-tax cash flow
- $3,341/yr
For passive investors: Depreciation is non-cash, so a rental often shows a tax loss while cash-flowing — sheltering income. Rental losses are passive: they offset passive income freely, and up to $25,000/yr can offset ordinary (W-2) income if you actively participate and your MAGI is under $100k (phasing out to $0 by $150k); unused losses carry forward. On sale, claimed depreciation is recaptured at up to 25%, and gains may owe capital-gains tax (a 1031 exchange can defer both). Figures are a year-1 estimate at your 24.0% rate — not tax advice; consult a CPA.
Schools (NCES district)
- District
- Lamphere Public Schools
- NCES district ID
- 2621120
- Math proficiency
- 28% ▼ -8.00%
- Reading proficiency
- 49% ▲ 1.00%
- Median HH income
- $44,993
- Composite
- 32.69/100
- National rank
- #5649
- State rank
- #235 of 540 in MI
Livability — Madison Heights
- Score
- 81/100
- State rank
- #62
- US rank
- #1347
Category grades
Schools grade is shown separately in the Schools card above.
Census & demographics
- Census place
- Madison Heights, MI
- County
- Oakland County · 1,009,092 people
- City population
- 28,419
- Metro
- Detroit-Warren-Dearborn, MI
- Population (ZIP)
- 28,419
- Household income
- $69,503
- Rent vs Own
- Severe rent burden
- 786.0
Population outlook (Oakland County) Hauer SSP2
- Today (2025)
- 1,335,747 people
- By 2030
- 1,375,100 · +2.9%
- By 2040
- 1,435,385 · +7.5%
- By 2050
- 1,469,250 · +10.0%
- By 2075
- 1,531,946 · +14.7%
- By 2100
- 1,450,485 · +8.6%
Race, ethnicity, and origin ACS 2023
- Neighborhood character
- Predominantly White (79%)
- Race & ethnicity
- White 79% Black 7% Asian 7% Two or more races 4% Hispanic / Latino 2%
- Common ancestry
- Romanian 11% Lithuanian 3% Slovak 2%
- Foreign-born
- 14% · China, Canada, South Korea
- Languages at home
- 84% English-only · Chinese 3% Other Indo-European 3% Arabic 2%
Political lean MEDSL · Oakland
- 2024 margin
- D (+10.6) · D 54.4% · R 43.8% · Other 1.9%
- 2008→2024 swing
- -3.9pp toward R · 2008: 14.5pp · 2024: 10.6pp
- All cycles
- 2024: D+10.6 2020: D+14.1 2016: D+8.1 2012: D+8.1 2008: D+14.5
Not yet ingested
- Civics
- —
Market trends
- HPI YoY
- ▼ -275.69%
- Current HPI
- 243.4861
- Rent YoY
- ▲ 2.81%
- Metro
- Detroit-Warren-Dearborn, MI
- State GDP YoY
- ▲ 1.37%
- F500 in state
- 28
Industry mix (Fortune 500 HQ in MI)
| Industry | F500 HQs | Revenue |
|---|---|---|
| Automotive Parts | 3 | $48B |
|
||
| Automotive | 2 | $372B |
|
||
| Chemicals | 1 | $45B |
|
||
| Automotive Retail | 1 | $29B |
|
||
| Healthcare / Medical Devices | 1 | $23B |
|
||
| Automotive Technology | 1 | $20B |
|
||
Price history
+0.0% since first listed3 events — show timeline
- 2026-06-11 Listed $234,900 MiRealSource-MiMLS
- 2026-06-11 Listed $234,900 REALCOMP
- 2026-06-11 Coming Soon $234,900 MiRealSource-MiMLS
Property tax history
+2.3%/yrLatest (2025): $3,034 · +3.0% YoY. Source: county tax records.
Cash-flow waterfall
monthlySold comps — $/sqft
last 12 mo · ≤1 miLoading sold comps…