5208 NE 24th Ter Unit F124 · Fort Lauderdale, FL
Flood risk No data
- FEMA flood zone
- —
- Chance of flooding over 30 yrs
- —
- Est. flood insurance / yr
- —
Fire risk No data
- Est. fire insurance / yr
- —
Heat risk No data
- Hot days now (above threshold)
- —
- Hot days in 30 yrs
- —
Wind risk No data
- Chance of severe wind over 30 yrs
- —
Air-quality risk No data
- Unhealthy air days now
- —
- Unhealthy air days in 30 yrs
- —
Risk factors via First Street. Map © Google.
Why this score? — see what drove the B grade
The composite is a weighted blend of 9 inputs, each scored 0–100. Each bar is that input's sub-score; the figure is the points it added to the 100-point composite (weight × sub-score).
- Cash flow +30.0/30.0
- 1% rule +10.0/10.0
- DSCR +10.0/10.0
- ARV discount +7.5/15.0
- Schools +4.1/10.0
- Livability +4.1/5.0
- Rent growth +3.4/5.0
- Condition / age +2.5/5.0
- Appreciation +0.0/10.0
$188,900
🖨 Deal sheet 📄 Offer letter ✓ Due diligence
Listing remarks
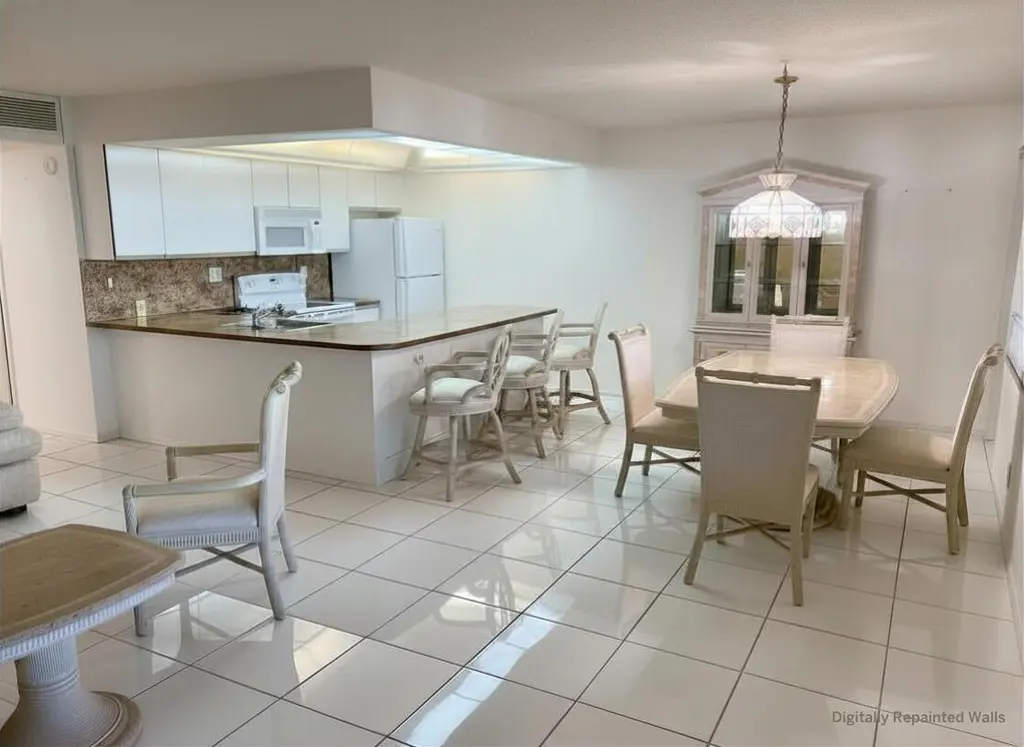
Rent Replacement Opportunity! Own for likely less. This is a perfect opportunity in a prime East of US-1 location. Low condo fees help keep monthly carrying costs competitive, and the big-ticket items are already done (new roof, impact windows, and 2024 A/C). First-floor 2bd/1ba with rare east/west exposure and peaceful green views- no pavement in sight!. Excellent storage: 2 walk-in closets plus a wall-to-wall closet + storage unit. Steps to the clubhouse and heated pool/spa/grills. Lender-reviewed condo with financing options available for qualified buyers; ask listing agent for details. One of the best values for a move-in-ready, low-maintenance home in this pocket of Fort Lauderdale. Mi
Key facts
- Landscaped grounds
- Newer a c
- East west exposure
Tags
Property features AI
Finance
- Financial info: No land lease; Pets not allowed in this community; Community contains approximately 320 units
- HOA & community: Part of Maybury Mansions association; Monthly HOA fee (paid monthly); Association amenities include clubhouse, car wash area, elevators, fitness center, hot water, laundry, park, parking, pool, spa/hot tub, storage, trash chute, bike storage, community room, heated pool, internet included, kitchen facilities, street lights, gated access, and maintenance; HOA fee includes cable TV, insurance, internet, grounds and structure maintenance, sewer, trash, water, common areas, elevator, hot water, legal/accounting, roof repairs, recreation facility, and pool service
Exterior
- Parking: Assigned parking (1 space); No carport
- Security: Fire alarm
- Utilities: Public water; Public sewer; Electricity available; Phone connected; Cable available; Sewer and water available; Natural gas not available
- Home design: Condominium; One-level living; Entry at level 1; Faces north; Resale unit
- Construction: CBS construction; Shingle roof; Slab foundation; Built as part of a 3-story building
- Exterior features: Covered patio; Patio; Brick fencing with gate and perimeter fencing; Many trees and landscaped grounds; Public asphalt road frontage (see remarks)
Interior
- Kitchen: Dishwasher; Electric range; Microwave; Refrigerator; Electric water heater
- Bedrooms: One main-level bedroom
- Flooring: Ceramic tile; Laminate; Tile; Wood
- Bathrooms: One full bathroom (main level)
- Heating & cooling: Electric heating (central individual); Central air; Ceiling fan(s)
- Interior features: Walk-in closet(s); Blinds; Insulated windows; Furnished negotiable
- Laundry & utility: Common area laundry room with multiple locations (main level)
Neighborhood map
What this means for you Summary
Snapshot
- This is a 2-bed/1.0-bath condo listed at $189k.
Deal economics
- At list price, monthly cash flow is $871 ($10k/yr) — positive.
- The deal already cash-flows at list — no discount required.
- Meets the 1% rule at list price ($4k rent vs $189k).
- Recommended offer: $178k (6.0% below list) — sets the bar for market timing.
- Cap rate 11.8% vs local median 2.2% in Fort Lauderdale — top-decile yield for the area; either an underpriced asset or a hidden risk that comps aren't pricing in. Stress-test before assuming the spread holds.
Location & tenants
- Location reads 82/100 on livability (#78 in FL, #1,293 nationally) — a professional / high-income tenant draw. Strengths: crime A+, amenities A+, health & safety A+; Watch: cost of living D-.
- Broward (suburban): math 42% / reading 53% proficiency, ranked #46 of 73 in FL (top 63%) — families likely to look elsewhere, expect single-tenant / working-renter base with shorter leases.
- Zoned schools: Mcnab Elementary School (math 51% / reading 63%, grade C+, #781 of 2,144 statewide, top 38%, 614 students, 56% FRL); Pompano Beach Middle School (math 29% / reading 40%, grade F, #421 of 571 statewide, top 74%, 1,040 students, 73% FRL); Northeast High School (math 12% / reading 37%, grade F, #505 of 667 statewide, top 79%, 1,552 students, 69% FRL).
- Market conditions: Rents rising (+3.6%/yr); 739 active listings in the ZIP; 29 comparable units currently listed for rent nearby; rentals at typical pace (median 17d on market — plan ~3-4 weeks tenant-placement turnaround); solid renter incomes; 2,111 units permitted in Broward County in 2024 (1,265 in 5+ unit buildings).
- At $3,650/mo this rent would consume 47% of the median local household income ($94k/yr) (locally 912% of renters already pay >50% of income on rent) — very limited rent-growth headroom before tenants either downsize or default.
Forward outlook
- Local home prices are declining (-3.0%/yr); year-one equity from $1k of loan paydown is wiped out by about $6k of value loss. Plan a longer hold.
- Broward County population projected at +34% by 2050 — long-run rental-demand tailwind backs the buy-and-hold thesis.
- At projected returns (-3.0% appreciation + 3.6% rent growth), your $53k cash investment doubles in ~6 years — after that, you're playing with house money.
Negotiation context
- It's been on market 79 days — a 6% lower offer ($178k) is reasonable based on typical stale-listing flexibility.
Questions for the listing agent
- It's been on market 79 days. Have you received any prior offers? Is the seller open to a 6% concession, seller financing, or rate buy-down credit?
- Built in 1965 — when were the roof, HVAC, electrical panel, plumbing, and water heater last replaced?
- What does the HOA fee cover, when was the last increase, and are there any pending special assessments or reserve-fund shortfalls?
- Any open or pending special assessments — roof, HVAC, plumbing, elevator, façade? What's the per-unit balance and payoff schedule, and is the seller paying it off at close or rolling it to the buyer?
- Why hasn't it sold? Are there any deal-killer items the seller is aware of (foundation, flood, title, zoning, code violations)?
- Is there a deadline driving the sale (1031 exchange, divorce, estate, relocation)? That informs how much negotiation room exists.
- Schools are B-rated — typically a magnet for longer-tenancy family renters. What's the average tenant stay here, and is there a school-zone premium baked into asking?
- What's the average days-on-market for RENTAL listings here right now (not sales)? A rising rental-DOM trend means longer vacancies and softer asking-rent achievability than the comps imply.
- What's the recent tenant-quality profile in this submarket — average credit score on applications, eviction rate, late-payment / NSF rate, and stable-employment percentage? A property-management company in the area should have these aggregated.
- How much new apartment / multifamily construction is in the pipeline within 1–3 miles? Heavy new supply (>2% of stock underway) typically softens rents 12–24 months out; light construction supports rent growth.
Investment metrics
- 1% rule
- 1.93% ✓
- Cap rate
- 11.82%
- Cash-on-cash
- 19.75%
- DSCR
- 1.88
- GRM
- 4.3
CMA / ARV
No comps found within radius.
Projected returns pro-forma
-3.0% appreciation · 3.63% rent growth · sell at horizon
- IRR
- 13.0%
- Equity multiple
- 1.52×
- Total profit
- $27,660
- Equity at exit
- $28,166
- IRR
- 22.6%
- Equity multiple
- 3.03×
- Total profit
- $107,156
- Equity at exit
- $16,333
Cash invested: $52,892 (down + closing). Projections, not guarantees.
Landlord ↔ Tenant lean methodology
- Overall (STATE)
- 87 Strongly Landlord-Friendly
- State Florida
- 87 Strongly Landlord-Friendly · R+3
- County
- — inherits STATE
- City
- — inherits STATE
ZIP-level market 33308
- Rents YoY
- 3.6%
- Active inventory
- 739
- Price-to-rent
- 4.3×
Monthly cashflow live
- Estimated rent
- $3,650 high interval (Pro) →
- Mortgage (P&I)
- −$991
- Tax from tax record
- −$347 /mo · $4,163/yr
- Insurance
- −$79
- HOA
- −$597
- Vacancy / Maint / Mgmt
- −$767
- Net cashflow
- $871
Break-even live
UW: 25.0% down · 7.5% · 30yr · 1.5% tax · 5.0% vac · 8.0% maint · 8.0% mgmt
Financing live
Cash to close
- Down payment
- $47,225
- Closing costs
- $5,667
- Reserves months
- —
- Total cash needed
- —
Loan-product check · same deal, 3 products live
Conventional
25% down · 7.5% · 30yr
- Down + closing
- —
- Monthly P&I
- —
- Monthly cashflow
- —
- DSCR
- —
- Eligible?
- —
Personal DTI + credit; lowest rate.
DSCR
20% down · 8.5% · 30yr
- Down + closing
- —
- Monthly P&I
- —
- Monthly cashflow
- —
- DSCR
- —
- Eligible?
- —
No personal income docs; deal must DSCR.
Hard money
10% down · 12.0% · 12mo
- Down + closing
- —
- Monthly P&I
- —
- Monthly cashflow
- —
- DSCR
- —
- Eligible?
- —
Short-term bridge; refi at stabilization.
Rent comps 29 comps
| Address | Beds | Baths | Sqft | Rent | $/sqft | DOM | Units | Dist |
|---|---|---|---|---|---|---|---|---|
| 4800 Bayview Dr #303 Fort Lauderdale, FL | 2.0 | 2.0 | 1032 | $3,500 | $3.39 | 24d | 1 | 0.41mi |
| 4512 Sea Grape Dr Unit 1 Lauderdale-By-The-Sea, FL | 1.0 | 1.0 | 853 | $3,500 | $4.10 | 24d | 1 | 0.84mi |
| 4564 El Mar Dr #4 Lauderdale by the Sea, FL | 1.0 | 1.0 | 566 | $3,500 | $6.18 | 17d | 1 | 1.07mi |
| 4013 N Ocean Dr #102 Fort Lauderdale, FL | 1.0 | 1.5 | 790 | $3,500 | $4.43 | 24d | 1 | 1.08mi |
| 4144 El Mar Dr Unit 1 Lauderdale-By-The-Sea, FL | 2.0 | 2.0 | 1116 | $3,250 | $2.91 | 24d | 1 | 1.10mi |
| 4900 N Ocean Blvd #1601 Lauderdale by the Sea, FL | 1.0 | 1.5 | 1000 | $4,000 | $4.00 | 24d | 1 | 1.13mi |
| 4900 N Ocean Blvd #1209 Lauderdale by the Sea, FL | 1.0 | 2.0 | 960 | $4,100 | $4.27 | 15d | 1 | 1.13mi |
| 2400 NE 65th St Fort Lauderdale, FL | 1.0–3.0 | 1.0–2.0 | 1103 | $2,814 | $2.55 | 2d | 16 | 1.14mi |
| 5000 N Ocean Blvd #506 Lauderdale by the Sea, FL | 1.0 | 1.5 | 1080 | $3,900 | $3.61 | 24d | 1 | 1.17mi |
| 5100 N Ocean Blvd #502 Lauderdale by the Sea, FL | 1.0 | 1.5 | 1080 | $3,400 | $3.15 | 24d | 1 | 1.20mi |
| 1631 S Federal Hwy Pompano Beach, FL | 1.0–3.0 | 1.0–2.0 | 1092 | $2,694 | $2.47 | 2d | 17 | 1.26mi |
| 6000 N Ocean Blvd Unit 1D Lauderdale by the Sea, FL | 2.0 | 2.0 | 904 | $3,200 | $3.54 | 22d | 1 | 1.38mi |
| 6000 N Ocean Blvd Unit 1D Lauderdale by the Sea, FL | 2.0 | 2.0 | 904 | $3,200 | $3.54 | 3d | 1 | 1.38mi |
| 4010 Galt Ocean Dr Fort Lauderdale, FL | 2.0–3.0 | 2.0 | 810 | $5,000 | $6.17 | 5d | 2 | 1.38mi |
| 4010 Galt Ocean Dr Fort Lauderdale, FL | 2.0–3.0 | 2.0 | 810 | $3,200 | $3.95 | 4d | 3 | 1.38mi |
| 3605 NE 32nd Ave Unit 209A Fort Lauderdale, FL | 2.0 | 2.0 | 1000 | $3,300 | $3.30 | 20d | 1 | 1.41mi |
| 3605 NE 32nd Ave Unit 209A Fort Lauderdale, FL | 2.0 | 2.0 | 1000 | $3,300 | $3.30 | 1d | 1 | 1.41mi |
| 3900 Galt Ocean Dr Fort Lauderdale, FL | 2.0 | 1.5–2.0 | 1429 | $4,675 | $3.27 | 17d | 3 | 1.42mi |
| 3900 Galt Ocean Dr Fort Lauderdale, FL | 1.0–2.0 | 1.5–2.0 | 1429 | $5,600 | $3.92 | 17d | 4 | 1.42mi |
| 2000 S Ocean Blvd Pompano Beach, FL | 1.0–2.0 | 1.5–2.0 | 1070 | $6,500 | $6.07 | 21d | 3 | 1.46mi |
| 2000 S Ocean Blvd Pompano Beach, FL | 1.0–2.0 | 1.5–2.0 | 1000 | $6,500 | $6.50 | 3d | 3 | 1.46mi |
| 2000 S Ocean Blvd Pompano Beach, FL | 1.0–2.0 | 1.5–2.0 | 1070 | $6,500 | $6.07 | 17d | 4 | 1.46mi |
| 3850 Galt Ocean Dr #1003 Fort Lauderdale, FL | 1.0 | 1.5 | 1050 | $3,300 | $3.14 | 24d | 1 | 1.46mi |
| 3333 Port Royale Dr S Fort Lauderdale, FL | 3.0 | 1.0–2.0 | 1175 | $3,716 | $3.16 | 2d | 40 | 1.47mi |
| 3800 Galt Ocean Dr Fort Lauderdale, FL | 1.0–2.0 | 1.5–2.0 | 1071 | $4,500 | $4.20 | 5d | 6 | 1.49mi |
| 3800 Galt Ocean Dr Fort Lauderdale, FL | 1.0–2.0 | 1.5–2.0 | 1071 | $4,500 | $4.20 | 15d | 6 | 1.49mi |
| 3800 Galt Ocean Dr Fort Lauderdale, FL | 1.0–2.0 | 1.5–2.0 | 1071 | $4,250 | $3.97 | 3d | 7 | 1.49mi |
| 1900 S Ocean Blvd Pompano Beach, FL | 2.0 | 2.0 | 1165 | $3,750 | $3.22 | 21d | 3 | 1.50mi |
| 1900 S Ocean Blvd Pompano Beach, FL | 2.0 | 2.0 | 1165 | $3,800 | $3.26 | 8d | 2 | 1.50mi |
HOA detail condo
- Monthly dues
- $597 · $7,164/yr
- Likely covers
- pool
- Assessments
- None detected in remarks — confirm with the listing agent.
Listing history 19 events
-
2026-06-18days on market $188,900 Active 79 DOM
-
2026-06-17days on market $188,900 Active 78 DOM
-
2026-06-16days on market $188,900 Active 77 DOM
-
2026-06-15days on market $188,900 Active 76 DOM
-
2026-06-13days on market $188,900 Active 74 DOM
-
2026-06-09days on market $188,900 Active 70 DOM
-
2026-06-08days on market $188,900 Active 69 DOM
-
2026-06-07days on market $188,900 Active 68 DOM
-
2026-06-04remarks 699-char remark
-
2026-06-04days on market $188,900 Active 65 DOM
-
2026-06-03days on market $188,900 Active 64 DOM
-
2026-06-02days on market $188,900 Active 63 DOM
-
2026-06-01days on market $188,900 Active 62 DOM
-
2026-05-31days on market $188,900 Active 61 DOM
-
2026-04-29price $189,900
-
2026-03-27$199,800 Active
-
2005-04-01soldstatus $178,000
-
1985-12-01soldstatus $57,000
-
1976-12-01soldstatus $36,000
ⓘ Source: listings_history table (triggers on properties + properties_extension) + one-shot
backfill from property_details.listing_events for pre-trigger history.
Tax reassessment forecast FL · Resets to sale price
- Current annual tax
- $4,163 · $347/mo
- Projected year-2 tax
- $4,163 · $347/mo
- Expected delta
- $0/yr ($0/mo · 0.0%)
ⓘ Screening estimate from a state-policy table — verify with the county assessor before closing.
Nearby sold comps map
Loading sold comps map…
Walkable amenities ~0.75 mi
Loading nearby amenities…
Taxation est. · year 1
- Rental income
- $43,805
- − Mortgage interest
- −$10,581
- − Property taxes
- −$4,163
- − Insurance
- −$944
- − Repairs & maintenance
- −$3,504
- − Management
- −$3,504
- − HOA
- −$7,164
- − Depreciation
- −$5,495
- Taxable income
- $8,449
- Est. tax owed @ 24.0%
- −$2,028
- After-tax cash flow
- $8,420/yr
For passive investors: Depreciation is non-cash, so a rental often shows a tax loss while cash-flowing — sheltering income. Rental losses are passive: they offset passive income freely, and up to $25,000/yr can offset ordinary (W-2) income if you actively participate and your MAGI is under $100k (phasing out to $0 by $150k); unused losses carry forward. On sale, claimed depreciation is recaptured at up to 25%, and gains may owe capital-gains tax (a 1031 exchange can defer both). Figures are a year-1 estimate at your 24.0% rate — not tax advice; consult a CPA.
Schools (NCES district)
- District
- Broward
- NCES district ID
- 1200180
- Math proficiency
- 42% ▼ -18.00%
- Reading proficiency
- 53% ▼ -5.00%
- Median HH income
- $52,139
- Composite
- 40.88/100
- National rank
- #3621
- State rank
- #46 of 73 in FL
Livability — Fort Lauderdale
- Score
- 82/100
- State rank
- #78
- US rank
- #1293
Category grades
Schools grade is shown separately in the Schools card above.
Census & demographics
- Census place
- Fort Lauderdale, FL
- County
- Broward County · 1,963,430 people
- City population
- 235,769
- Metro
- Miami-Fort Lauderdale-Pompano Beach, FL
- Population (ZIP)
- 27,935
- Household income
- $93,879
- Rent vs Own
- Severe rent burden
- 912.0
Population outlook (Broward County) Hauer SSP2
- Today (2025)
- 2,207,033 people
- By 2030
- 2,360,704 · +7.0%
- By 2040
- 2,661,208 · +20.6%
- By 2050
- 2,946,698 · +33.5%
- By 2075
- 3,602,273 · +63.2%
- By 2100
- 3,970,984 · +79.9%
Race, ethnicity, and origin ACS 2023
- Neighborhood character
- Predominantly White (75%)
- Race & ethnicity
- White 75% Hispanic / Latino 16% Two or more races 14% Asian 3% Black 2%
- Hispanic origin (detail)
- Puerto Rican 2% Cuban 3%
- Common ancestry
- Romanian 4% Lithuanian 3% Scotch-Irish 3%
- Foreign-born
- 24% · Canada, Jamaica, Dominican Republic
- Languages at home
- 75% English-only · Spanish 14% Other Indo-European 5% Russian/Polish/Slavic 2%
Political lean MEDSL · Broward
- 2024 margin
- D (+17.0) · D 58.0% · R 41.0%
- 2008→2024 swing
- -17.8pp toward R · 2008: 34.7pp · 2024: 17.0pp
- All cycles
- 2024: D+17.0 2020: D+29.8 2016: D+35.0 2012: D+34.9 2008: D+34.7
Not yet ingested
- Civics
- —
Market trends
- HPI YoY
- ▼ -417.95%
- Current HPI
- 325.3902
- Rent YoY
- ▲ 3.63%
- Metro
- Miami-Fort Lauderdale-Pompano Beach, FL
- State GDP YoY
- ▲ 3.28%
- F500 in state
- 36
Industry mix (Fortune 500 HQ in FL)
| Industry | F500 HQs | Revenue |
|---|---|---|
| Industrial Technology | 2 | $29B |
|
||
| Insurance | 2 | $17B |
|
||
| Retail | 1 | $60B |
|
||
| Technology Distribution | 1 | $58B |
|
||
| Homebuilding | 1 | $35B |
|
||
| Technology Manufacturing | 1 | $35B |
|
||
Price history
+427.5% since first listed5 events — show timeline
- 2026-04-29 Price Changed $189,900 Beaches MLS
- 2026-03-27 Listed $199,800 Beaches MLS
- 2005-04-01 Sold (Public Records) $178,000 Public Records
- 1985-12-01 Sold (Public Records) $57,000 Public Records
- 1976-12-01 Sold (Public Records) $36,000 Public Records
Property tax history
+13.0%/yrLatest (2025): $4,163 · +234.9% YoY. Source: county tax records.
Cash-flow waterfall
monthlySold comps — $/sqft
last 12 mo · ≤1 miLoading sold comps…