355 Club Rd · Bethel, PA
Flood risk 1/10 · Minimal
- FEMA flood zone
- X (unshaded)
- Chance of flooding over 30 yrs
- 0.0%
- Est. flood insurance / yr
- $507 – $1,088
Fire risk 2/10 · Minimal
- Est. fire insurance / yr
- $511 – $949
Heat risk 3/10 · Minor
- Hot days now (above 98°F)
- 7 days/yr
- Hot days in 30 yrs
- 16 days/yr
Wind risk 4/10 · Minor
- Chance of severe wind over 30 yrs
- 10.0%
Air-quality risk 2/10 · Minimal
- Unhealthy air days now
- 1 days/yr
- Unhealthy air days in 30 yrs
- 2 days/yr
Risk factors via First Street. Map © Google.
Why this score? — see what drove the D grade
The composite is a weighted blend of 9 inputs, each scored 0–100. Each bar is that input's sub-score; the figure is the points it added to the 100-point composite (weight × sub-score).
- Appreciation +10.0/10.0
- ARV discount +7.5/15.0
- Cash flow +7.1/30.0
- Schools +3.8/10.0
- Livability +3.1/5.0
- Rent growth +2.5/5.0
- Condition / age +2.5/5.0
- 1% rule +2.4/10.0
- DSCR +1.3/10.0
$214,900
🖨 Deal sheet 📄 Offer letter ✓ Due diligence
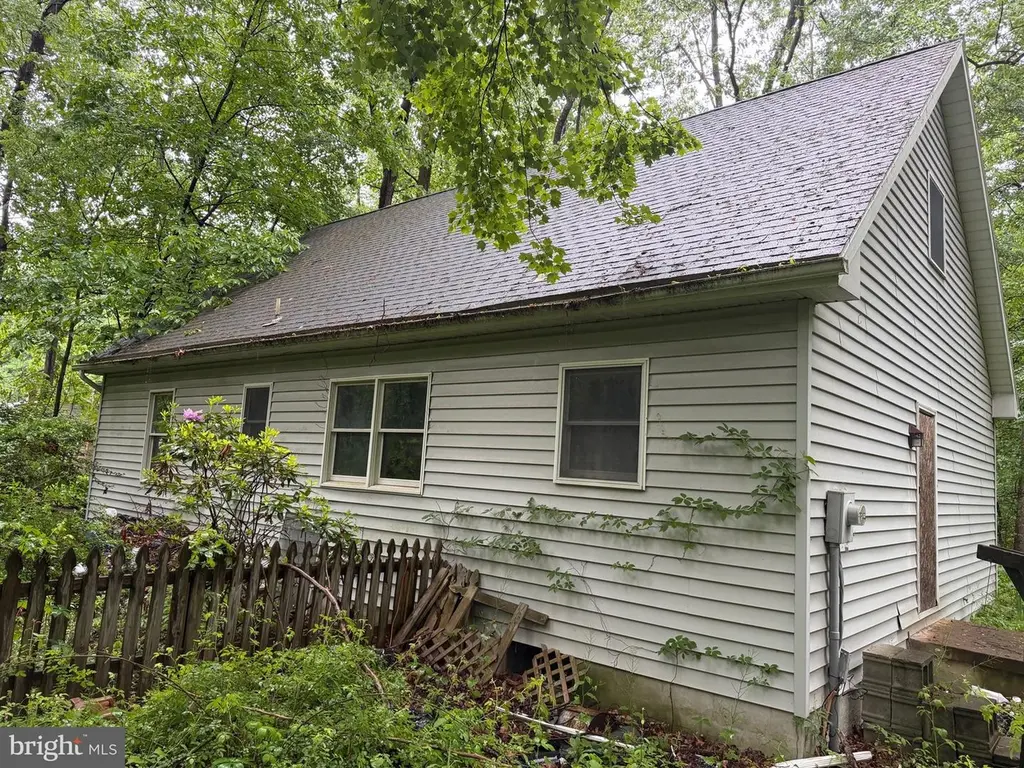
Listing remarks
355 Club Rd offers a unique opportunity for investors, contractors, or buyers looking for a full renovation project. This property has been vacant and is being sold in shell condition, ready for your vision and restoration. The home features newer exterior improvements including a nice roof, windows, and siding already in place, providing a solid starting point for redevelopment. Power is currently off. Property is being sold as-is. Use caution when touring the home and park at the end of the driveway if preferred. Great potential for the right buyer to bring this property back to life.
Key facts
- Solid starting point
- Great potential
- 1.22 acre lot
Tags
Property features AI
Finance
- Other: Fee simple ownership
Exterior
- Parking: Driveway
- Utilities: Well water; On-site septic
- Home design: Detached property; Finished area above grade is 1,560 (source: Assessor)
- Construction: Vinyl and aluminum siding; Other foundation
- Exterior features: Not in a federal flood zone; Above- and below-grade other structures
Interior
- Bedrooms: Two bedrooms on the main level; Two bedrooms on the upper level
- Bathrooms: One full bathroom on the main level; One full bathroom total
- Heating & cooling: Hot water heating; Oil-fired heating; Electric cooling
- Interior features: Full basement
Neighborhood map
What this means for you Summary
Snapshot
- This is a 4-bed/1.0-bath single-family listed at $215k.
Deal economics
- At list price, monthly cash flow is $-308 ($-4k/yr) — negative.
- To cash-flow at today's rent, offer at most $161k (25.3% below list).
- To meet the 1% rule (rent ≥ 1% of price), the offer needs to be $160k (25.6% below list).
- Recommended offer: $160k (25.6% below list) — sets the bar for 1% rule.
Location & tenants
- Location reads 61/100 on livability (#1,428 in PA) — a middle-class / working-renter tenant base. Strengths: cost of living A+, health & safety A+, crime A; Watch: schools D+, employment D+, amenities F.
- Tulpehocken Area SD (rural): math 36% / reading 51% proficiency, ranked #273 of 539 in PA (top 51%) — families likely to look elsewhere, expect single-tenant / working-renter base with shorter leases.
- Market conditions: 18 active listings in the ZIP; 258 units permitted in Berks County in 2024 (27 in 5+ unit buildings).
Forward outlook
- In year one you build about $23k of equity ($1k loan paydown + $21k appreciation (10.0% local appreciation)).
- Berks County population projected at +3% by 2050 — modest demand growth; plan on rents tracking national, not racing it.
- By year 2, paydown + projected appreciation supports a ~$37k cash-out refi (75% LTV) — recoverable capital for the next deal without selling this one.
Negotiation context
- It's been on market 23 days — a 2% lower offer ($212k) is reasonable based on typical stale-listing flexibility.
Questions for the listing agent
- What do current leases actually rent for vs. the listed asking? Can we see a recent rent roll and the last 12 months of T-12 income?
- Is there a deadline driving the sale (1031 exchange, divorce, estate, relocation)? That informs how much negotiation room exists.
- Schools are D-rated, which usually means shorter tenancies and higher turnover. Who's the typical renter profile here, and what's been the actual vacancy rate?
- The area grade is low — what's the realistic commute time and amenity access for the typical tenant pool here? Any planned neighborhood developments (good or bad) we should know about?
- What's the average days-on-market for RENTAL listings here right now (not sales)? A rising rental-DOM trend means longer vacancies and softer asking-rent achievability than the comps imply.
- What's the recent tenant-quality profile in this submarket — average credit score on applications, eviction rate, late-payment / NSF rate, and stable-employment percentage? A property-management company in the area should have these aggregated.
- How much new for-sale + rental construction is in the pipeline within 1–3 miles? Heavy new supply typically softens prices + rents 12–24 months out; constrained supply supports both.
Investment metrics
- 1% rule
- 0.74% ✗
- Cap rate
- 4.58%
- Cash-on-cash
- -6.13%
- DSCR
- 0.73
- GRM
- 11.2
CMA / ARV
No comps found within radius.
Projected returns pro-forma
10.0% appreciation · 3.0% rent growth · sell at horizon
- IRR
- 20.0%
- Equity multiple
- 2.62×
- Total profit
- $97,525
- Equity at exit
- $193,599
- IRR
- 18.3%
- Equity multiple
- 6.03×
- Total profit
- $302,753
- Equity at exit
- $417,503
Cash invested: $60,172 (down + closing). Projections, not guarantees.
Landlord ↔ Tenant lean methodology
- Overall (STATE)
- 62 Landlord-Friendly
- State Pennsylvania
- 62 Landlord-Friendly · EVEN
- County
- — inherits STATE
- City
- — inherits STATE
ZIP-level market 19507
- Home prices YoY
- 6.4%
- Active inventory
- 18
- Price-to-rent
- 11.2×
Monthly cashflow live
- Estimated rent
- $1,598 medium interval (Pro) →
- Mortgage (P&I)
- −$1,127
- Tax from tax record
- −$354 /mo · $4,242/yr
- Insurance
- −$90
- HOA
- −$0
- Vacancy / Maint / Mgmt
- −$336
- Net cashflow
- $-308
Break-even live
UW: 25.0% down · 7.5% · 30yr · 1.5% tax · 5.0% vac · 8.0% maint · 8.0% mgmt
Financing live
Cash to close
- Down payment
- $53,725
- Closing costs
- $6,447
- Reserves months
- —
- Total cash needed
- —
Loan-product check · same deal, 3 products live
Conventional
25% down · 7.5% · 30yr
- Down + closing
- —
- Monthly P&I
- —
- Monthly cashflow
- —
- DSCR
- —
- Eligible?
- —
Personal DTI + credit; lowest rate.
DSCR
20% down · 8.5% · 30yr
- Down + closing
- —
- Monthly P&I
- —
- Monthly cashflow
- —
- DSCR
- —
- Eligible?
- —
No personal income docs; deal must DSCR.
Hard money
10% down · 12.0% · 12mo
- Down + closing
- —
- Monthly P&I
- —
- Monthly cashflow
- —
- DSCR
- —
- Eligible?
- —
Short-term bridge; refi at stabilization.
Listing history 16 events
-
2026-06-18days on market $214,900 Active 23 DOM
-
2026-06-17days on market $214,900 Active 22 DOM
-
2026-06-16days on market $214,900 Active 21 DOM
-
2026-06-15days on market $214,900 Active 20 DOM
-
2026-06-14price $214,900 Active 18 DOM
-
2026-06-13days on market $224,900 Active 18 DOM
-
2026-06-12days on market $224,900 Active 17 DOM
-
2026-06-09days on market $224,900 Active 14 DOM
-
2026-06-08days on market $224,900 Active 13 DOM
-
2026-06-08days on market $224,900 Active 12 DOM
-
2026-06-07days on market $224,900 Active 11 DOM
-
2026-06-04days on market $224,900 Active 8 DOM
-
2026-06-02days on market $224,900 Active 7 DOM
-
2026-06-01days on market $224,900 Active 6 DOM
-
2026-05-31days on market $224,900 Active 5 DOM
-
2026-05-26$224,900 Active
ⓘ Source: listings_history table (triggers on properties + properties_extension) + one-shot
backfill from property_details.listing_events for pre-trigger history.
Tax reassessment forecast PA · Partial reset (capped growth)
- Current annual tax
- $4,242 · $354/mo
- Projected year-2 tax
- $4,242 · $354/mo
- Expected delta
- $0/yr ($0/mo · 0.0%)
ⓘ Screening estimate from a state-policy table — verify with the county assessor before closing.
Climate risk First Street
- Flood 1/10 Low FEMA zone X (unshaded) · 0% chance over 30 yrs
- Wildfire 2/10 Low
- Heat 3/10 Moderate 7 d/yr ≥98°F today · 16 d/yr by 30 yrs out
- Wind 4/10 Moderate 10% chance of damaging wind over 30 yrs
- Air quality 2/10 Low 1 unhealthy d/yr today · 2 by 30 yrs out
Nearby sold comps map
Loading sold comps map…
Walkable amenities ~0.75 mi
Loading nearby amenities…
Taxation est. · year 1
- Rental income
- $19,176
- − Mortgage interest
- −$12,038
- − Property taxes
- −$4,242
- − Insurance
- −$1,074
- − Repairs & maintenance
- −$1,534
- − Management
- −$1,534
- − Depreciation
- −$6,252
- Taxable loss
- −$7,498
- Est. tax savings @ 24.0%
- +$1,800
- After-tax cash flow
- $-1,892/yr
For passive investors: Depreciation is non-cash, so a rental often shows a tax loss while cash-flowing — sheltering income. Rental losses are passive: they offset passive income freely, and up to $25,000/yr can offset ordinary (W-2) income if you actively participate and your MAGI is under $100k (phasing out to $0 by $150k); unused losses carry forward. On sale, claimed depreciation is recaptured at up to 25%, and gains may owe capital-gains tax (a 1031 exchange can defer both). Figures are a year-1 estimate at your 24.0% rate — not tax advice; consult a CPA.
Schools (NCES district)
- District
- Tulpehocken Area SD
- NCES district ID
- 4223820
- Math proficiency
- 36% ▼ -19.00%
- Reading proficiency
- 51% ▼ -11.00%
- Median HH income
- $60,653
- Composite
- 38.36/100
- National rank
- #4213
- State rank
- #273 of 539 in PA
Livability — Bethel
- Score
- 61/100
- State rank
- #1428
- US rank
- #18143
Category grades
Schools grade is shown separately in the Schools card above.
Census & demographics
- Population (ZIP)
- 3,744
Population outlook (Berks County) Hauer SSP2
- Today (2025)
- 425,767 people
- By 2030
- 428,814 · +0.7%
- By 2040
- 433,463 · +1.8%
- By 2050
- 439,426 · +3.2%
- By 2075
- 478,647 · +12.4%
- By 2100
- 518,507 · +21.8%
Race, ethnicity, and origin ACS 2023
- Neighborhood character
- Predominantly White (93%)
- Race & ethnicity
- White 93% Hispanic / Latino 6%
- Hispanic origin (detail)
- Mexican 5%
- Common ancestry
- Serbian 7% Italian 1% Iranian 1%
- Foreign-born
- 2%
- Languages at home
- 92% English-only · Spanish 4% German/W. Germanic 3%
Political lean MEDSL · Berks
- 2024 margin
- R (+12.2) · D 43.4% · R 55.6%
- 2008→2024 swing
- -21.4pp toward R · 2008: 9.2pp · 2024: -12.2pp
- All cycles
- 2024: R+12.2 2020: R+8.2 2016: R+10.2 2012: R+0.6 2008: D+9.2
Not yet ingested
- Civics
- —
Market trends
- HPI YoY
- ▲ 22.65%
- Current HPI
- 377.2798
- Rent YoY
- —
- Metro
- —
- State GDP YoY
- ▲ 1.68%
- F500 in state
- 34
Industry mix (Fortune 500 HQ in PA)
| Industry | F500 HQs | Revenue |
|---|---|---|
| Healthcare | 2 | $309B |
|
||
| Insurance | 2 | $27B |
|
||
| Telecommunications / Media | 1 | $124B |
|
||
| Industrial Distribution | 1 | $22B |
|
||
| Financial Services | 1 | $20B |
|
||
| Chemicals / Materials | 1 | $18B |
|
||
Price history
1 event — show timeline
- 2026-05-26 Listed $224,900 BRIGHT MLS
Property tax history
+0.2%/yrLatest (2026): $4,242 · +0.0% YoY. Source: county tax records.
Cash-flow waterfall
monthlySold comps — $/sqft
last 12 mo · ≤1 miLoading sold comps…