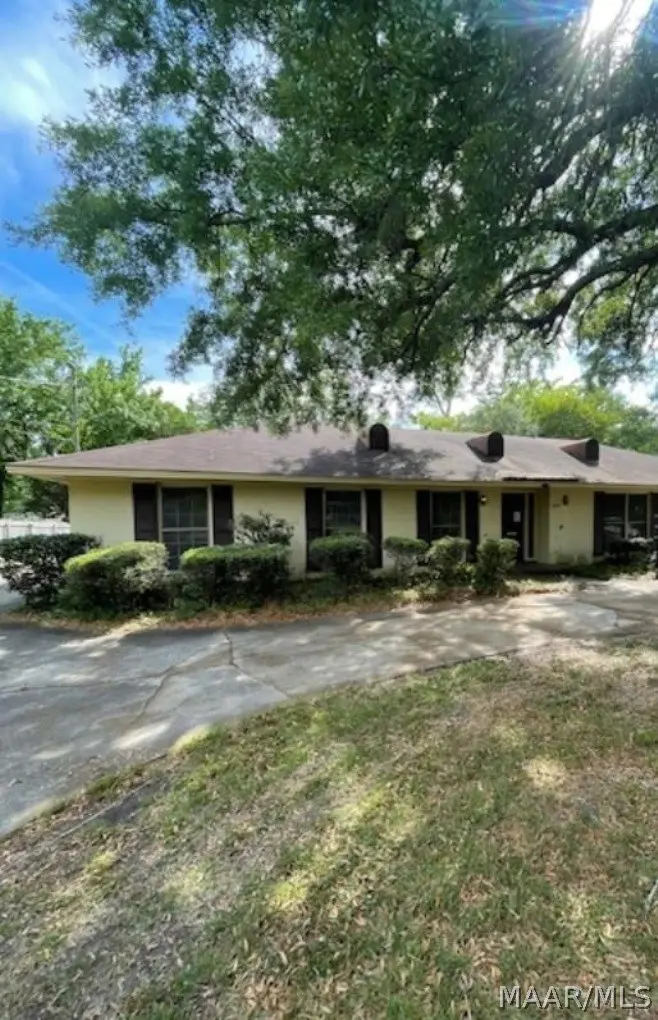
2556 Carter Hill Rd · Montgomery, AL
Flood risk 1/10 · Minimal
- FEMA flood zone
- X (unshaded)
- Chance of flooding over 30 yrs
- 0.0%
- Est. flood insurance / yr
- $507 – $1,088
Fire risk 1/10 · Minimal
- Est. fire insurance / yr
- $916 – $1,700
Heat risk 7/10 · Major
- Hot days now (above 108°F)
- 7 days/yr
- Hot days in 30 yrs
- 20 days/yr
Wind risk 8/10 · Major
- Chance of severe wind over 30 yrs
- 80.0%
Air-quality risk 3/10 · Minor
- Unhealthy air days now
- 4 days/yr
- Unhealthy air days in 30 yrs
- 4 days/yr
Risk factors via First Street. Map © Google.
Why this score? — see what drove the C+ grade
The composite is a weighted blend of 9 inputs, each scored 0–100. Each bar is that input's sub-score; the figure is the points it added to the 100-point composite (weight × sub-score).
- Cash flow +27.1/30.0
- DSCR +9.4/10.0
- ARV discount +8.8/15.0
- 1% rule +6.9/10.0
- Rent growth +4.1/5.0
- Livability +3.2/5.0
- Condition / age +2.5/5.0
- Schools +1.7/10.0
- Appreciation +0.0/10.0
$134,900
🖨 Deal sheet 📄 Offer letter ✓ Due diligence
Listing remarks MLS
This 1,853 sqft great home is convenient to everything! What a nice brick-on slab 3BA/2BR home with lots of space and character. This home feature a gas log fireplace, good-sized bedrooms, two large living areas for entertaining. The backyard with a covered patio is waiting for you to enjoy. Kitchen appliances stay with the home. The front yard features mature shrubbery and a splendid oak tree in front of the circular drive. SHOWING BY APPOINTMENT ONLY- DO NOT DISTURB OCCUPANTS. CALL FOR APPOINTMENT. See Agent Offer Package attached to listing prior to making an offer or contacting the Seller. All offers require submission of the attached Agent Offer Package. Sale is subject to prior sales. Seller has an equitable interest in the property. Member of seller entities is an Alabama Real Estate Licensee.
Key facts
- Circular drive
- Covered patio
- Gas log fireplace
Tags
Property features AI
Exterior
- Parking: Driveway
- Utilities: Electricity available; Public water; Public sewer
- Home design: One-story brick home; Slab foundation; Year built per public records
- Construction: Brick construction
- Exterior features: City lot with mature trees; Lot dimensions approximately 100 x 145 x 100 x 145
Interior
- Bedrooms: Two bedrooms on the first floor
- Flooring: Tile
- Bathrooms: Two full bathrooms
- Interior features: Tile flooring; Electric water heater
Neighborhood map
What this means for you Summary
Snapshot
- This is a 3-bed/2.0-bath single-family listed at $135k.
Deal economics
- At list price, monthly cash flow is $380 ($5k/yr) — positive.
- The deal already cash-flows at list — no discount required.
- Meets the 1% rule at list price ($2k rent vs $135k).
- Recommended offer: $131k (3.0% below list) — sets the bar for market timing.
- Cap rate 9.7% vs local median 6.0% in Montgomery — top-decile yield for the area; either an underpriced asset or a hidden risk that comps aren't pricing in. Stress-test before assuming the spread holds.
Location & tenants
- Location reads 65/100 on livability (#138 in AL) — a middle-class / working-renter tenant base. Strengths: cost of living A+, housing A+; Watch: schools C-, employment D, crime F.
- Montgomery County (urban): math 9% / reading 31% proficiency, ranked #106 of 129 in AL (top 82%) — low school quality limits family demand, transient renter base, plan for 1-2y turnover; 70% free/reduced lunch — lower-income household profile, screen leases tightly.
- Market conditions: Rents rising fast (+6.3%/yr); 137 active listings in the ZIP; 35 comparable units currently listed for rent nearby; rentals at typical pace (median 21d on market — plan ~3-4 weeks tenant-placement turnaround); 46% of comp listings sitting > 30 days — soft ceiling on asking rent; 460 units permitted in Montgomery County in 2024 (37 in 5+ unit buildings).
Forward outlook
- Local home prices are declining (-3.0%/yr); year-one equity from $933 of loan paydown is wiped out by about $4k of value loss. Plan a longer hold.
- Montgomery County population projected to shrink 8% by 2050 — rents likely to lag national; underwrite the cash flow, not the appreciation.
- At projected returns (-3.0% appreciation + 6.3% rent growth), your $38k cash investment doubles in ~8 years — after that, you're playing with house money.
Negotiation context
- It's been on market 51 days — a 3% lower offer ($131k) is reasonable based on typical stale-listing flexibility.
- 5 sale attempts since 28y ago with the ask held roughly flat each time — persistent listings suggest the price (not the market) is what's stuck; bring a comps-based counter.
Risks & watch-outs
- Climate carrying-cost: severe wind risk, 80% chance of damaging wind over 30y; extreme-heat days projected 7→20/yr by 2055 (HVAC capex compounding) — expect insurance premiums to compound above CPI over the hold.
Questions for the listing agent
- It's been on market 51 days. Have you received any prior offers? Is the seller open to a 3% concession, seller financing, or rate buy-down credit?
- Built in 1960 — when were the roof, HVAC, electrical panel, plumbing, and water heater last replaced?
- Is there a deadline driving the sale (1031 exchange, divorce, estate, relocation)? That informs how much negotiation room exists.
- Crime grade is F in this area — have there been break-ins, vandalism, or insurance claims at this property in the last 3 years? What carrier currently insures it and at what premium?
- What's the average days-on-market for RENTAL listings here right now (not sales)? A rising rental-DOM trend means longer vacancies and softer asking-rent achievability than the comps imply.
- What's the recent tenant-quality profile in this submarket — average credit score on applications, eviction rate, late-payment / NSF rate, and stable-employment percentage? A property-management company in the area should have these aggregated.
- How much new for-sale + rental construction is in the pipeline within 1–3 miles? Heavy new supply typically softens prices + rents 12–24 months out; constrained supply supports both.
Investment metrics
- 1% rule
- 1.19% ✓
- Cap rate
- 9.67%
- Cash-on-cash
- 12.07%
- DSCR
- 1.54
- GRM
- 7.0
CMA / ARV
- ARV (median comp)
- $138,915
- List price
- $134,900
- Delta
- -2.89%
- Verdict
- FAIR
- Comps
- 20 within 1.0 mi
Show comp detail 12 sales within ~0.75 mi
| Address | Dist | Beds/Ba | Sqft | Sold | Price | $/sf | Match |
|---|---|---|---|---|---|---|---|
| 3020 Hill Hedge Dr | 0.13mi | 3/2.0 | 2,090 (+13%) | 0mo | $190,000 | $91 | 73 |
| 2129 Meadow Lane Dr | 0.13mi | 3/2.0 | 1,643 (-11%) | 9mo | $170,000 | $103 | 68 |
| 2958 Old Farm Rd | 0.25mi | 2/2.0 (-1) | 1,712 (-8%) | 6mo | $159,000 | $93 | 65 |
| 1830 Hill Hedge Dr | 0.25mi | 3/2.0 | 1,674 (-10%) | 10mo | $164,500 | $98 | 64 |
| 3113 Malone Dr | 0.53mi | 2/2.0 (-1) | 1,858 (+0%) | 8mo | $160,000 | $86 | 63 |
| 2948 Canterbury Dr | 0.45mi | 3/2.0 | 1,702 (-8%) | 4mo | $155,000 | $91 | 62 |
| 1836 Longmeadow Dr | 0.28mi | 4/2.0 (+1) | 1,680 (-9%) | 7mo | $185,000 | $110 | 61 |
| 2009 Commodore St | 0.46mi | 3/2.0 | 1,661 (-10%) | 4mo | $65,000 | $39 | 58 |
| 2056 Gorgas St | 0.47mi | 3/2.0 | 2,054 (+11%) | 10mo | $150,000 | $73 | 52 |
| 2014 Commodore St | 0.47mi | 3/2.0 | 1,613 (-13%) | 10mo | $140,000 | $87 | 48 |
| 3142 Whitney Dr | 0.71mi | 4/2.0 (+1) | 2,048 (+10%) | 3mo | $240,000 | $117 | 42 |
| 3126 Fernway Dr | 0.75mi | 3/2.0 | 1,638 (-12%) | 8mo | $160,221 | $98 | 39 |
Match score weights: distance 35% · size 25% · config 20% · recency 20%. Top-matched comps best support the ARV.
Projected returns pro-forma
-3.0% appreciation · 6.29% rent growth · sell at horizon
- IRR
- 5.2%
- Equity multiple
- 1.21×
- Total profit
- $7,820
- Equity at exit
- $20,114
- IRR
- 17.3%
- Equity multiple
- 2.64×
- Total profit
- $62,024
- Equity at exit
- $11,664
Cash invested: $37,772 (down + closing). Projections, not guarantees.
Landlord ↔ Tenant lean methodology
- Overall (STATE)
- 90 Strongly Landlord-Friendly
- State Alabama
- 90 Strongly Landlord-Friendly · R+15
- County
- — inherits STATE
- City
- — inherits STATE
ZIP-level market 36106
- Home prices YoY
- -13.1%
- Rents YoY
- 6.3%
- Active inventory
- 137
- Price-to-rent
- 7.0×
Monthly cashflow live
- Estimated rent
- $1,603 high interval (Pro) →
- Mortgage (P&I)
- −$707
- Tax from tax record
- −$123 /mo · $1,471/yr
- Insurance
- −$56
- HOA
- −$0
- Vacancy / Maint / Mgmt
- −$337
- Net cashflow
- $380
Break-even live
UW: 25.0% down · 7.5% · 30yr · 1.5% tax · 5.0% vac · 8.0% maint · 8.0% mgmt
Financing live
Cash to close
- Down payment
- $33,725
- Closing costs
- $4,047
- Reserves months
- —
- Total cash needed
- —
Loan-product check · same deal, 3 products live
Conventional
25% down · 7.5% · 30yr
- Down + closing
- —
- Monthly P&I
- —
- Monthly cashflow
- —
- DSCR
- —
- Eligible?
- —
Personal DTI + credit; lowest rate.
DSCR
20% down · 8.5% · 30yr
- Down + closing
- —
- Monthly P&I
- —
- Monthly cashflow
- —
- DSCR
- —
- Eligible?
- —
No personal income docs; deal must DSCR.
Hard money
10% down · 12.0% · 12mo
- Down + closing
- —
- Monthly P&I
- —
- Monthly cashflow
- —
- DSCR
- —
- Eligible?
- —
Short-term bridge; refi at stabilization.
Rent comps 35 comps
| Address | Beds | Baths | Sqft | Rent | $/sqft | DOM | Units | Dist |
|---|---|---|---|---|---|---|---|---|
| 1842 Gillespie Dr Montgomery, AL | 4.0 | 2.0 | 1620 | $1,650 | $1.02 | 43d | 1 | 0.23mi |
| 1839 Robison Hill Rd Montgomery, AL | 4.0 | 2.0 | 1370 | $1,550 | $1.13 | 21d | 1 | 0.24mi |
| 1814 Sylvan Dr Montgomery, AL | 3.0 | 2.0 | 1785 | $1,400 | $0.78 | 21d | 1 | 0.26mi |
| 2988 Old Farm Rd Montgomery, AL | 3.0 | 2.5 | 2314 | $1,900 | $0.82 | 43d | 1 | 0.26mi |
| 2983 Old Farm Rd Montgomery, AL | 3.0 | 2.0 | 2000 | $1,725 | $0.86 | 21d | 1 | 0.29mi |
| 2929 Canterbury Ct Unit 1043474P Montgomery, AL | 4.0 | 2.5 | 2464 | $2,667 | $1.08 | 21d | 1 | 0.30mi |
| 1827 Pinecrest Dr Montgomery, AL | 4.0 | 3.0 | 1893 | $1,550 | $0.82 | 13d | 1 | 0.41mi |
| 2053 Gorgas St Montgomery, AL | 3.0 | 1.0 | 1955 | $1,200 | $0.61 | 21d | 1 | 0.47mi |
| 2014 Commodore St Montgomery, AL | 3.0 | 2.0 | 1613 | $1,450 | $0.90 | 13d | 1 | 0.50mi |
| 2045 Bullard St Unit 1043526P Montgomery, AL | 3.0 | 2.0 | 1797 | $2,198 | $1.22 | 43d | 1 | 0.54mi |
| 2226 Carter Hill Rd Montgomery, AL | 2.0 | 1.0 | 1506 | $905 | $0.60 | 43d | 1 | 0.65mi |
| 1450 Crenshaw Pl S Montgomery, AL | 3.0 | 2.0 | 1641 | $1,775 | $1.08 | 43d | 1 | 0.75mi |
| 1425 Blairwood Montgomery, AL | 3.0 | 2.0 | 1700 | $1,850 | $1.09 | 13d | 1 | 0.80mi |
| 3352 Ridgefield Dr Montgomery, AL | 3.0 | 2.0 | 1932 | $1,761 | $0.91 | 21d | 1 | 0.87mi |
| 2430 Price St Montgomery, AL | 2.0 | 1.5 | 1275 | $1,175 | $0.92 | 13d | 1 | 0.94mi |
| 2440 Price St Unit C Montgomery, AL | 3.0 | 2.0 | 1800 | $1,050 | $0.58 | 43d | 1 | 0.96mi |
| 2441 Price St Unit D Montgomery, AL | 3.0 | 2.0 | 1264 | $900 | $0.71 | 21d | 1 | 0.98mi |
| 1355 Magnolia Curv Montgomery, AL | 3.0 | 3.0 | 2260 | $1,800 | $0.80 | 13d | 1 | 1.01mi |
| 3136 Harrison Rd Montgomery, AL | 3.0 | 1.5 | 1355 | $1,025 | $0.76 | 43d | 1 | 1.05mi |
| 2043 Hazel Hedge Ln Montgomery, AL | 4.0 | 3.0 | 2001 | $1,650 | $0.82 | 13d | 1 | 1.06mi |
| 3543 Carter Hill Rd Montgomery, AL | 1.0–3.0 | 1.0–2.0 | 1120 | $925 | $0.83 | 13d | 16 | 1.08mi |
| 1216 Karen Rd Montgomery, AL | 3.0 | 2.0 | 1620 | $1,350 | $0.83 | 13d | 1 | 1.11mi |
| 1229 Karen Rd Montgomery, AL | 4.0 | 2.0 | 1344 | $1,590 | $1.18 | 43d | 1 | 1.12mi |
| 1738 Fairforest Dr Montgomery, AL | 3.0 | 2.0 | 2166 | $1,895 | $0.87 | 43d | 1 | 1.15mi |
| 2727 Boultier St Montgomery, AL | 1.0–3.0 | 1.0–2.0 | 1070 | $1,582 | $1.48 | 13d | 3 | 1.18mi |
| 3359 Bedford Ln Montgomery, AL | 4.0 | 2.0 | 1786 | $1,600 | $0.90 | 13d | 1 | 1.20mi |
| 1117 Karen Rd Montgomery, AL | 3.0 | 1.0 | 1308 | $1,195 | $0.91 | 43d | 1 | 1.29mi |
| 3356 Audubon Rd Montgomery, AL | 2.0 | 1.5 | 1340 | $950 | $0.71 | 43d | 1 | 1.34mi |
| 3510 Bankhead Ave Montgomery, AL | 3.0 | 3.0 | 2210 | $2,250 | $1.02 | 43d | 1 | 1.34mi |
| 2656 Fisk Rd Montgomery, AL | 4.0 | 2.0 | 1584 | $1,400 | $0.88 | 43d | 1 | 1.35mi |
| 1437 Beaumont Dr Montgomery, AL | 4.0 | 2.0 | 2029 | $1,500 | $0.74 | 43d | 1 | 1.35mi |
| 1216 Beechdale Rd Montgomery, AL | 4.0 | 2.0 | 1495 | $1,325 | $0.89 | 43d | 1 | 1.44mi |
| 926 Green Ridge Ct Montgomery, AL | 3.0 | 2.0 | 1665 | $1,381 | $0.83 | 13d | 1 | 1.46mi |
| 3050 Bryn Mawr Rd Montgomery, AL | 3.0 | 2.0 | 2290 | $1,500 | $0.66 | 43d | 1 | 1.47mi |
| 2651 Clement Curv Montgomery, AL | 3.0 | 2.0 | 1402 | $1,550 | $1.11 | 21d | 1 | 1.48mi |
Listing history 27 events
-
2026-06-18days on market $134,900 Active 51 DOM
-
2026-06-17days on market $134,900 Active 50 DOM
-
2026-06-16days on market $134,900 Active 49 DOM
-
2026-06-15days on market $134,900 Active 48 DOM
-
2026-06-14days on market $134,900 Active 46 DOM
-
2026-06-13days on market $134,900 Active 45 DOM
-
2026-06-10days on market $134,900 Active 43 DOM
-
2026-06-09days on market $134,900 Active 42 DOM
-
2026-06-08days on market $134,900 Active 41 DOM
-
2026-06-07days on market $134,900 Active 40 DOM
-
2026-06-03days on market $134,900 Active 36 DOM
-
2026-06-02days on market $134,900 Active 35 DOM
-
2026-06-01days on market $134,900 Active 34 DOM
-
2026-05-31days on market $134,900 Active 33 DOM
-
2026-05-30days on market $134,900 Active 32 DOM
-
2026-04-28$134,900 Active 412-char remark
-
2026-02-24soldstatus $1,631,600
-
2022-02-03price $1,295
-
2021-07-06soldstatus $105,000
-
2021-06-29soldstatus $105,000 811-char remark
Show marketing remark (811 chars)
This 1,853 sqft great home is convenient to everything! What a nice brick-on slab 3BA/2BR home with lots of space and character. This home feature a gas log fireplace, good-sized bedrooms, two large living areas for entertaining. The backyard with a covered patio is waiting for you to enjoy. Kitchen appliances stay with the home. The front yard features mature shrubbery and a splendid oak tree in front of the circular drive. SHOWING BY APPOINTMENT ONLY- DO NOT DISTURB OCCUPANTS. CALL FOR APPOINTMENT. See Agent Offer Package attached to listing prior to making an offer or contacting the Seller. All offers require submission of the attached Agent Offer Package. Sale is subject to prior sales. Seller has an equitable interest in the property. Member of seller entities is an Alabama Real Estate Licensee.
-
2021-05-27$105,000 811-char remark
Show marketing remark (811 chars)
This 1,853 sqft great home is convenient to everything! What a nice brick-on slab 3BA/2BR home with lots of space and character. This home feature a gas log fireplace, good-sized bedrooms, two large living areas for entertaining. The backyard with a covered patio is waiting for you to enjoy. Kitchen appliances stay with the home. The front yard features mature shrubbery and a splendid oak tree in front of the circular drive. SHOWING BY APPOINTMENT ONLY- DO NOT DISTURB OCCUPANTS. CALL FOR APPOINTMENT. See Agent Offer Package attached to listing prior to making an offer or contacting the Seller. All offers require submission of the attached Agent Offer Package. Sale is subject to prior sales. Seller has an equitable interest in the property. Member of seller entities is an Alabama Real Estate Licensee.
-
2016-01-15soldstatus $60,000
-
2016-01-07soldstatus $60,000
Show marketing remark (270 chars)
Great home with lots of space and character. Gas log fireplace. Two large living areas for entertaining. Good size bedrooms. Back yard waiting for you to enjoy. Make this home your own. Priced to sell don't sleep on this one. Verify school zones with Board of Education.
-
2015-05-14$79,900
Show marketing remark (270 chars)
Great home with lots of space and character. Gas log fireplace. Two large living areas for entertaining. Good size bedrooms. Back yard waiting for you to enjoy. Make this home your own. Priced to sell don't sleep on this one. Verify school zones with Board of Education.
-
2014-05-10$124,900
-
1998-04-17soldstatus $115,000
-
1998-02-12$124,900
ⓘ Source: listings_history table (triggers on properties + properties_extension) + one-shot
backfill from property_details.listing_events for pre-trigger history.
Tax reassessment forecast AL · Resets to sale price
- Current annual tax
- $1,471 · $123/mo
- Projected year-2 tax
- $1,471 · $123/mo
- Expected delta
- $0/yr ($0/mo · 0.0%)
ⓘ Screening estimate from a state-policy table — verify with the county assessor before closing.
Climate risk First Street
- Flood 1/10 Low FEMA zone X (unshaded) · 0% chance over 30 yrs
- Wildfire 1/10 Low
- Heat 7/10 Severe 7 d/yr ≥108°F today · 20 d/yr by 30 yrs out
- Wind 8/10 Severe 80% chance of damaging wind over 30 yrs
- Air quality 3/10 Moderate 4 unhealthy d/yr today · 4 by 30 yrs out
Nearby sold comps map
Loading sold comps map…
Walkable amenities ~0.75 mi
Loading nearby amenities…
Taxation est. · year 1
- Rental income
- $19,235
- − Mortgage interest
- −$7,556
- − Property taxes
- −$1,471
- − Insurance
- −$674
- − Repairs & maintenance
- −$1,539
- − Management
- −$1,539
- − Depreciation
- −$3,924
- Taxable income
- $2,530
- Est. tax owed @ 24.0%
- −$607
- After-tax cash flow
- $3,953/yr
For passive investors: Depreciation is non-cash, so a rental often shows a tax loss while cash-flowing — sheltering income. Rental losses are passive: they offset passive income freely, and up to $25,000/yr can offset ordinary (W-2) income if you actively participate and your MAGI is under $100k (phasing out to $0 by $150k); unused losses carry forward. On sale, claimed depreciation is recaptured at up to 25%, and gains may owe capital-gains tax (a 1031 exchange can defer both). Figures are a year-1 estimate at your 24.0% rate — not tax advice; consult a CPA.
Schools (NCES district)
- District
- Montgomery County
- NCES district ID
- 0102430
- Math proficiency
- 9% ▼ -21.00%
- Reading proficiency
- 31% ▼ -1.00%
- Median HH income
- $43,902
- Composite
- 17.24/100
- National rank
- #9093
- State rank
- #106 of 129 in AL
Livability — Montgomery
- Score
- 65/100
- State rank
- #138
- US rank
- #13416
Category grades
Schools grade is shown separately in the Schools card above.
Census & demographics
- Census place
- Montgomery, AL
- County
- Montgomery County · 190,016 people
- City population
- 175,913
- Metro
- Montgomery, AL
- Population (ZIP)
- 14,065
- Household income
- $69,087
- Rent vs Own
- Severe rent burden
- 876.0
Population outlook (Montgomery County) Hauer SSP2
- Today (2025)
- 224,008 people
- By 2030
- 221,460 · -1.1%
- By 2040
- 214,179 · -4.4%
- By 2050
- 204,912 · -8.5%
- By 2075
- 177,821 · -20.6%
- By 2100
- 145,134 · -35.2%
Race, ethnicity, and origin ACS 2023
- Neighborhood character
- Diverse neighborhood (Simpson 0.58)
- Race & ethnicity
- White 47% Black 43% Hispanic / Latino 5% Two or more races 4% Asian 1%
- Hispanic origin (detail)
- Mexican 3%
- Common ancestry
- Serbian 2% Slovak 2% Italian 1%
- Foreign-born
- 4% · Canada, China, South Korea
- Languages at home
- 94% English-only · Spanish 3%
Political lean MEDSL · Montgomery
- 2024 margin
- Solid D (+30.7) · D 64.8% · R 34.1% · Other 1.1%
- 2008→2024 swing
- +11.5pp toward D · 2008: 19.2pp · 2024: 30.7pp
- All cycles
- 2024: D+30.7 2020: D+31.5 2016: D+26.2 2012: D+24.3 2008: D+19.2
Not yet ingested
- Civics
- —
Market trends
- HPI YoY
- ▼ -22.82%
- Current HPI
- 151.1822
- Rent YoY
- ▲ 6.29%
- Metro
- Montgomery, AL
- State GDP YoY
- ▲ 2.94%
- F500 in state
- 4
Industry mix (Fortune 500 HQ in AL)
| Industry | F500 HQs | Revenue |
|---|---|---|
| Financial Services | 1 | $8B |
|
||
| Healthcare | 1 | $5B |
|
||
Price history
+8.0% since first listed12 events — show timeline
- 2026-04-28 Listed $134,900 MAAR
- 2026-02-24 Sold (Public Records) $1,631,600 Public Records
- 2022-02-03 Price Changed $1,295 RENT.
- 2021-07-06 Sold (Public Records) $105,000 Public Records
- 2021-06-29 Sold (MLS) $105,000 MAAR
- 2021-05-27 Listed $105,000 MAAR
- 2016-01-15 Sold (Public Records) $60,000 Public Records
- 2016-01-07 Sold (MLS) $60,000 MAAR
- 2015-05-14 Listed $79,900 MAAR
- 2014-05-10 Listed $124,900 MAAR
- 1998-04-17 Sold (MLS) $115,000 MAAR
- 1998-02-12 Listed $124,900 MAAR
Property tax history
+4.4%/yrLatest (2025): $1,471 · -7.0% YoY. Source: county tax records.
Cash-flow waterfall
monthlySold comps — $/sqft
last 12 mo · ≤1 miLoading sold comps…