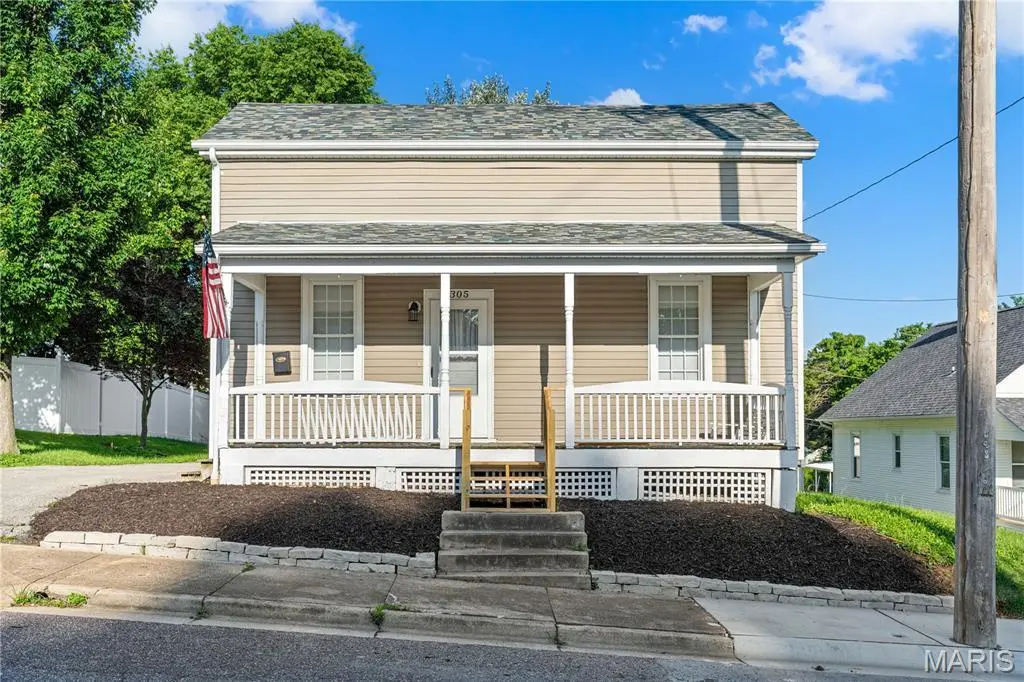
305 Macarthur St · Washington, MO
Flood risk 1/10 · Minimal
- FEMA flood zone
- X (unshaded)
- Chance of flooding over 30 yrs
- 0.0%
- Est. flood insurance / yr
- $507 – $1,088
Fire risk 1/10 · Minimal
- Est. fire insurance / yr
- $1,054 – $1,958
Heat risk 5/10 · Moderate
- Hot days now (above 108°F)
- 7 days/yr
- Hot days in 30 yrs
- 20 days/yr
Wind risk 2/10 · Minimal
- Chance of severe wind over 30 yrs
- 1.0%
Air-quality risk 1/10 · Minimal
- Unhealthy air days now
- 0 days/yr
- Unhealthy air days in 30 yrs
- 0 days/yr
Risk factors via First Street. Map © Google.
Why this score? — see what drove the F grade
The composite is a weighted blend of 9 inputs, each scored 0–100. Each bar is that input's sub-score; the figure is the points it added to the 100-point composite (weight × sub-score).
- Cash flow +4.6/30.0
- Schools +4.2/10.0
- Livability +4.0/5.0
- Rent growth +2.5/5.0
- Condition / age +2.5/5.0
- 1% rule +0.0/10.0
- DSCR +0.0/10.0
- ARV discount +0.0/15.0
- Appreciation +0.0/10.0
$229,900
🖨 Deal sheet (PDF) 📄 Offer letter ✓ Due diligence
Listing remarks MLS
Private Sale, entered for comp purposes only.
Key facts
- Covered front porch
- Natural light
- Main floor laundry
Tags
Property features AI
Finance
- Other: Above-grade finished area recorded at 1,318 (source: assessor)
- Financial info: Lease not considered; No home warranty indicated
Exterior
- Parking: Detached oversized garage with two garage spaces and garage door opener (approximately 24x26); Off-street parking
- Utilities: Public water; Public sewer; Electricity connected (single-phase)
- Home design: Single-family residence; One-and-one-half story; Private ownership; City lot, level; Road frontage on a city street
- Construction: Frame construction with vinyl siding; Architectural shingle roof; Stone foundation; Built according to public records (above-grade finished area recorded)
- Exterior features: Covered front porch; Deck; Chain link backyard fence; Panel, pocket and storm doors
Interior
- Kitchen: Dishwasher; Microwave; Electric range and oven; Refrigerator; Electric water heater
- Bedrooms: 2 bedrooms (both on the upper level)
- Flooring: Hardwood; Other flooring where applicable
- Bathrooms: 2 full bathrooms (one on main level, one on upper level)
- Heating & cooling: Forced-air heating (natural gas); Central air conditioning; Ceiling fans; Electric cooling components
- Interior features: Breakfast bar; Ceiling fans; Special millwork; Walk-in closets; Insulated windows
- Laundry & utility: Main-level laundry
Neighborhood map
What this means for you Summary
Snapshot
- This is a 3-bed/1.0-bath single-family listed at $230k.
Deal economics
- At list price, monthly cash flow is $-586 ($-7k/yr) — negative.
- To cash-flow at today's rent, offer at most $126k (45.0% below list).
- To meet the 1% rule (rent ≥ 1% of price), the offer needs to be $104k (54.8% below list).
- Recommended offer: $104k (54.8% below list) — sets the bar for 1% rule.
- Cap rate 3.2% vs local median 2.4% in Washington — top-decile yield for the area; either an underpriced asset or a hidden risk that comps aren't pricing in. Stress-test before assuming the spread holds.
Location & tenants
- Location reads 81/100 on livability (#13 in MO, #1,373 nationally) — a professional / high-income tenant draw. Strengths: amenities A+, cost of living A+, housing A+; Watch: commute F.
- Washington (town): math 41% / reading 55% proficiency, ranked #46 of 324 in MO (top 14%) — families likely to look elsewhere, expect single-tenant / working-renter base with shorter leases.
- Zoned schools: South Point Elementary (math 41% / reading 41%, grade F, #520 of 1,115 statewide, top 47%, 407 students, 33% FRL); Washington Middle (math 43% / reading 54%, grade C-, #81 of 391 statewide, top 21%, 551 students, 31% FRL); Washington High School (math 29% / reading 73%, grade D+, #109 of 521 statewide, top 21%, 1,322 students, 20% FRL) — zoned schools at 28% FRL track the district average.
- Market conditions: 203 active listings in the ZIP; 5 comparable units currently listed for rent nearby; rentals at typical pace (median 17d on market — plan ~3-4 weeks tenant-placement turnaround); 40% of comp listings sitting > 30 days — soft ceiling on asking rent; 614 units permitted in Franklin County in 2024 (100 in 5+ unit buildings).
Forward outlook
- Local home prices are declining (-3.0%/yr); year-one equity from $2k of loan paydown is wiped out by about $7k of value loss. Plan a longer hold.
- Franklin County population projected to shrink 9% by 2050 — rents likely to lag national; underwrite the cash flow, not the appreciation.
Negotiation context
- It's been on market 24 days — a 2% lower offer ($226k) is reasonable based on typical stale-listing flexibility.
- 2 sale attempts with the ask held roughly flat each time — persistent listings suggest the price (not the market) is what's stuck; bring a comps-based counter.
- Current owner paid $129k; list at $230k implies a 78% gain — meaningful room to come down on a strong offer.
Risks & watch-outs
- Watch-outs: built in 1904 — expect roof / HVAC / electrical / plumbing capex.
- Climate carrying-cost: extreme-heat days projected 7→20/yr by 2055 (HVAC capex compounding) — expect insurance premiums to compound above CPI over the hold.
Questions for the listing agent
- What do current leases actually rent for vs. the listed asking? Can we see a recent rent roll and the last 12 months of T-12 income?
- Built in 1904 — when were the roof, HVAC, electrical panel, plumbing, and water heater last replaced?
- Is there a deadline driving the sale (1031 exchange, divorce, estate, relocation)? That informs how much negotiation room exists.
- Schools are B-rated — typically a magnet for longer-tenancy family renters. What's the average tenant stay here, and is there a school-zone premium baked into asking?
- The area grade is low — what's the realistic commute time and amenity access for the typical tenant pool here? Any planned neighborhood developments (good or bad) we should know about?
- What's the average days-on-market for RENTAL listings here right now (not sales)? A rising rental-DOM trend means longer vacancies and softer asking-rent achievability than the comps imply.
- What's the recent tenant-quality profile in this submarket — average credit score on applications, eviction rate, late-payment / NSF rate, and stable-employment percentage? A property-management company in the area should have these aggregated.
- How much new for-sale + rental construction is in the pipeline within 1–3 miles? Heavy new supply typically softens prices + rents 12–24 months out; constrained supply supports both.
Investment metrics
- 1% rule
- 0.45% ✗
- Cap rate
- 3.23%
- Cash-on-cash
- -10.92%
- DSCR
- 0.51
- GRM
- 18.4
CMA / ARV
- ARV (on-the-fly)
- $185,526
- Comps found
- 12
Show comp detail 12 sales within ~0.75 mi
| Address | Dist | Beds/Ba | Sqft | Sold | Price | $/sf | Match |
|---|---|---|---|---|---|---|---|
| 305 Boone St | 0.07mi | 2/1.0 (-1) | 962 (+3%) | 8mo | $200,000 | $208 | 81 |
| 619 E 8th St | 0.26mi | 3/2.0 | 960 (+2%) | 1mo | $207,000 | $216 | 79 |
| 521 E 7th St | 0.23mi | 3/1.5 | 960 (+2%) | 9mo | $159,900 | $167 | 75 |
| 623 E 8th St | 0.25mi | 3/1.0 | 988 (+5%) | 13mo | $199,900 | $202 | 69 |
| 512 E 3rd St | 0.06mi | 3/1.0 | 1,060 (+13%) | 11mo | $160,000 | $151 | 66 |
| 8 E Fourth St | 0.41mi | 3/2.0 | 986 (+5%) | 9mo | $195,000 | $198 | 61 |
| 953 E 1st St | 0.32mi | 4/2.0 (+1) | 1,007 (+8%) | 11mo | $175,000 | $174 | 54 |
| 1323 E 6th St | 0.63mi | 2/1.0 (-1) | 878 (-6%) | 1mo | $151,000 | $172 | 54 |
| 320 Penn | 0.65mi | 2/1.0 (-1) | 912 (-3%) | 14mo | $195,000 | $214 | 48 |
| 257 Carriage Ct | 0.75mi | 2/1.0 (-1) | 908 (-3%) | 12mo | $134,500 | $148 | 45 |
| 7 W 12th St | 0.69mi | 3/1.0 | 1,008 (+8%) | 12mo | $235,000 | $233 | 45 |
| 1409 E 6th St | 0.69mi | 2/1.0 (-1) | 875 (-7%) | 9mo | $150,000 | $171 | 44 |
Match score weights: distance 35% · size 25% · config 20% · recency 20%. Top-matched comps best support the ARV.
Projected returns pro-forma
-3.0% appreciation · 3.0% rent growth · sell at horizon
- IRR
- -36.2%
- Equity multiple
- -0.16×
- Total profit
- $-74,666
- Equity at exit
- $34,279
- IRR
- -50.8%
- Equity multiple
- -0.76×
- Total profit
- $-113,457
- Equity at exit
- $19,878
Cash invested: $64,372 (down + closing). Projections, not guarantees.
Landlord ↔ Tenant lean methodology
- Overall (STATE)
- 81 Strongly Landlord-Friendly
- State Missouri
- 81 Strongly Landlord-Friendly · R+10
- County
- — inherits STATE
- City
- — inherits STATE
ZIP-level market 63090
- Active inventory
- 203
- Price-to-rent
- 18.4×
Monthly cashflow live
- Estimated rent
- $1,040 high interval (Pro) →
- Mortgage (P&I)
- −$1,206
- Tax from tax record
- −$106 /mo · $1,273/yr
- Insurance
- −$96
- HOA
- −$0
- Vacancy / Maint / Mgmt
- −$218
- Net cashflow
- $-586
Break-even live
Sensitivity live
| Price | -10% $-456 | -5% $-521 | +0% $-586 | +5% $-651 | +10% $-716 |
|---|---|---|---|---|---|
| Rent | -10% $-668 | -5% $-627 | +0% $-586 | +5% $-545 | +10% $-504 |
| Rate | -1.0pp $-470 | -0.5pp $-527 | base $-586 | +0.5pp $-645 | +1.0pp $-706 |
UW: 25.0% down · 7.5% · 30yr · 1.5% tax · 5.0% vac · 8.0% maint · 8.0% mgmt
Financing live
Cash to close
- Down payment
- $57,475
- Closing costs
- $6,897
- Reserves months
- —
- Total cash needed
- —
Loan-product check · same deal, 3 products live
Conventional
25% down · 7.5% · 30yr
- Down + closing
- —
- Monthly P&I
- —
- Monthly cashflow
- —
- DSCR
- —
- Eligible?
- —
Personal DTI + credit; lowest rate.
DSCR
20% down · 8.5% · 30yr
- Down + closing
- —
- Monthly P&I
- —
- Monthly cashflow
- —
- DSCR
- —
- Eligible?
- —
No personal income docs; deal must DSCR.
Hard money
10% down · 12.0% · 12mo
- Down + closing
- —
- Monthly P&I
- —
- Monthly cashflow
- —
- DSCR
- —
- Eligible?
- —
Short-term bridge; refi at stabilization.
Rent comps 5 comps
| Address | Beds | Baths | Sqft | Rent | $/sqft | DOM | Units | Dist |
|---|---|---|---|---|---|---|---|---|
| 221a Elm St Unit B Washington, MO | 2.0 | 1.0 | 825 | $700 | $0.85 | 16d | 1 | 0.60mi |
| 7 Village West Ct #101 Washington, MO | 2.0 | 1.0 | 1125 | $1,000 | $0.89 | 45d | 1 | 0.96mi |
| 1006 Marilyn Ct Unit 1006-9 Washington, MO | 2.0 | 1.0 | 750 | $1,125 | $1.50 | 45d | 1 | 1.05mi |
| 1029 Caroline Dr Washington, MO | 2.0 | 1.0 | 750 | $1,125 | $1.50 | 0d | 1 | 1.08mi |
| 1025 Don Ave Washington, MO | 1.0–3.0 | 1.0–2.0 | 1150 | $1,750 | $1.52 | 0d | 4 | 1.41mi |
Listing history 25 events
-
2026-06-21days on market $229,900 Active 24 DOM
-
2026-06-18days on market $229,900 Active 21 DOM
-
2026-06-17days on market $229,900 Active 20 DOM
-
2026-06-16days on market $229,900 Active 19 DOM
-
2026-06-15days on market $229,900 Active 18 DOM
-
2026-06-13days on market $229,900 Active 16 DOM
-
2026-06-13statusdays on market $229,900 Active 15 DOM
-
2026-06-09days on market $229,900 Active Under Contract 12 DOM
-
2026-06-08days on market $229,900 Active Under Contract 11 DOM
-
2026-06-07days on market $229,900 Active Under Contract 10 DOM
-
2026-06-03days on market $229,900 Active Under Contract 6 DOM
-
2026-06-02days on market $229,900 Active Under Contract 5 DOM
-
2026-06-01days on market $229,900 Active Under Contract 4 DOM
-
2026-05-31statusdays on market $229,900 Active Under Contract 3 DOM
-
2026-05-28$229,900 Active
-
2026-05-28historical $229,900
-
2025-08-17price $229,900
-
2025-06-25price $234,900
-
2025-06-25price $254,900
-
2025-02-13$239,000 Active
-
2024-04-09soldstatus 45-char remark
Show marketing remark (45 chars)
Private Sale, entered for comp purposes only.
-
2008-09-29soldstatus $128,900
-
2005-02-17soldstatus
-
2003-01-23soldstatus
-
1997-10-31soldstatus
ⓘ Source: listings_history table (triggers on properties + properties_extension) + one-shot
backfill from property_details.listing_events for pre-trigger history.
Tax reassessment forecast MO · Resets to sale price
- Current annual tax
- $1,273 · $106/mo
- Projected year-2 tax
- $2,230 · $186/mo
- Expected delta
- +$957/yr (+$80/mo · 75.2%)
ⓘ Screening estimate from a state-policy table — verify with the county assessor before closing.
Climate risk First Street
- Flood 1/10 Low FEMA zone X (unshaded) · 0% chance over 30 yrs
- Wildfire 1/10 Low
- Heat 5/10 Major 7 d/yr ≥108°F today · 20 d/yr by 30 yrs out
- Wind 2/10 Low 100% chance of damaging wind over 30 yrs
- Air quality 1/10 Low 0 unhealthy d/yr today · 0 by 30 yrs out
Nearby sold comps map
Loading sold comps map…
Walkable amenities ~0.75 mi
Loading nearby amenities…
Taxation est. · year 1
- Rental income
- $12,480
- − Mortgage interest
- −$12,878
- − Property taxes
- −$1,273
- − Insurance
- −$1,150
- − Repairs & maintenance
- −$998
- − Management
- −$998
- − Depreciation
- −$6,688
- Taxable loss
- −$11,505
- Est. tax savings @ 24.0%
- +$2,761
- After-tax cash flow
- $-4,270/yr
For passive investors: Depreciation is non-cash, so a rental often shows a tax loss while cash-flowing — sheltering income. Rental losses are passive: they offset passive income freely, and up to $25,000/yr can offset ordinary (W-2) income if you actively participate and your MAGI is under $100k (phasing out to $0 by $150k); unused losses carry forward. On sale, claimed depreciation is recaptured at up to 25%, and gains may owe capital-gains tax (a 1031 exchange can defer both). Figures are a year-1 estimate at your 24.0% rate — not tax advice; consult a CPA.
Schools (NCES district)
- District
- Washington
- NCES district ID
- 2931110
- Math proficiency
- 41% ▼ -3.00%
- Reading proficiency
- 55% ▼ -1.00%
- Median HH income
- $58,344
- Composite
- 41.87/100
- National rank
- #3372
- State rank
- #46 of 324 in MO
Livability — Washington
- Score
- 81/100
- State rank
- #13
- US rank
- #1373
Category grades
Schools grade is shown separately in the Schools card above.
Census & demographics
- Census place
- Washington, MO
- Population (ZIP)
- 22,471
Population outlook (Franklin County) Hauer SSP2
- Today (2025)
- 103,600 people
- By 2030
- 103,298 · -0.3%
- By 2040
- 100,607 · -2.9%
- By 2050
- 94,280 · -9.0%
- By 2075
- 77,103 · -25.6%
- By 2100
- 54,405 · -47.5%
Race, ethnicity, and origin ACS 2023
- Neighborhood character
- Predominantly White (93%)
- Race & ethnicity
- White 93% Two or more races 6% Hispanic / Latino 1%
- Common ancestry
- Lithuanian 3% Romanian 3% Slovak 2%
- Foreign-born
- 1% · Canada
- Languages at home
- 99% English-only · German/W. Germanic 1%
Political lean MEDSL · Franklin
- 2024 margin
- Solid R (+45.9) · D 26.5% · R 72.4% · Other 1.1%
- 2008→2024 swing
- -33.5pp toward R · 2008: -12.4pp · 2024: -45.9pp
- All cycles
- 2024: R+45.9 2020: R+43.8 2016: R+46.1 2012: R+27.9 2008: R+12.4
Not yet ingested
- Civics
- —
Market trends
- HPI YoY
- ▼ -96.53%
- Current HPI
- 175.3309
- Rent YoY
- —
- Metro
- —
- State GDP YoY
- ▲ 1.84%
- F500 in state
- 20
Industry mix (Fortune 500 HQ in MO)
| Industry | F500 HQs | Revenue |
|---|---|---|
| Healthcare | 1 | $163B |
|
||
| Insurance | 1 | $21B |
|
||
| Industrial Technology | 1 | $17B |
|
||
| Retail | 1 | $16B |
|
||
| Industrial Distribution | 1 | $10B |
|
||
| Utilities | 1 | $9B |
|
||
Price history
+78.4% since first listed11 events — show timeline
- 2026-05-28 Listed $229,900 MARIS as Distributed by MLS Grid
- 2026-05-28 Coming Soon $229,900 MARIS as Distributed by MLS Grid
- 2025-08-17 Price Changed $229,900 MARIS as Distributed by MLS Grid
- 2025-06-25 Price Changed $234,900 MARIS as Distributed by MLS Grid
- 2025-06-25 Price Changed $254,900 MARIS as Distributed by MLS Grid
- 2025-02-13 Listed $239,000 MARIS as Distributed by MLS Grid
- 2024-04-09 Sold (MLS) — MARIS as Distributed by MLS Grid
- 2008-09-29 Sold (Public Records) $128,900 Public Records
- 2005-02-17 Sold (Public Records) — Public Records
- 2003-01-23 Sold (Public Records) — Public Records
- 1997-10-31 Sold (Public Records) — Public Records
Property tax history
+3.3%/yrLatest (2025): $1,273 · +6.9% YoY. Source: county tax records.
Cash-flow waterfall
monthlySold comps — $/sqft
last 12 mo · ≤1 miLoading sold comps…