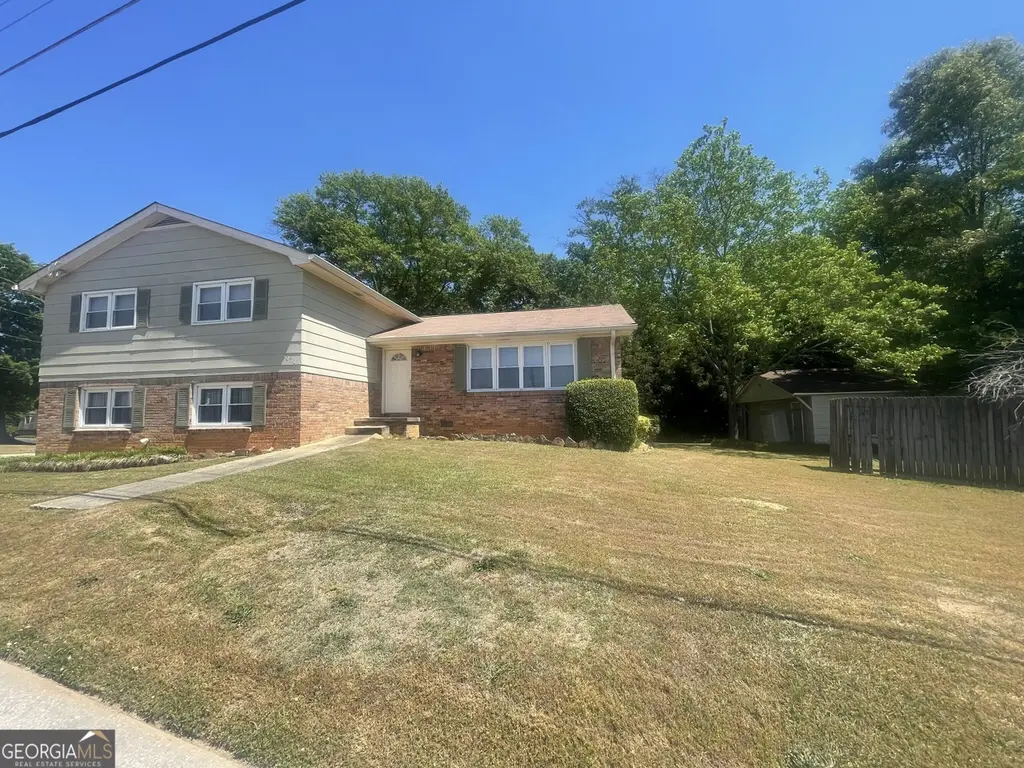
6070 N Lee St · Morrow, GA
Flood risk 1/10 · Minimal
- FEMA flood zone
- X (unshaded)
- Chance of flooding over 30 yrs
- 0.0%
- Est. flood insurance / yr
- $507 – $1,088
Fire risk 1/10 · Minimal
- Est. fire insurance / yr
- $963 – $1,789
Heat risk 6/10 · Moderate
- Hot days now (above 105°F)
- 7 days/yr
- Hot days in 30 yrs
- 18 days/yr
Wind risk 5/10 · Moderate
- Chance of severe wind over 30 yrs
- 26.0%
Air-quality risk 4/10 · Minor
- Unhealthy air days now
- 4 days/yr
- Unhealthy air days in 30 yrs
- 6 days/yr
Risk factors via First Street. Map © Google.
Why this score? — see what drove the D+ grade
The composite is a weighted blend of 9 inputs, each scored 0–100. Each bar is that input's sub-score; the figure is the points it added to the 100-point composite (weight × sub-score).
- Cash flow +15.6/30.0
- ARV discount +15.0/15.0
- DSCR +4.8/10.0
- 1% rule +4.4/10.0
- Livability +3.2/5.0
- Condition / age +2.5/5.0
- Rent growth +2.2/5.0
- Schools +1.3/10.0
- Appreciation +0.0/10.0
$210,000
🖨 Deal sheet (PDF) 📄 Offer letter ✓ Due diligence
Listing remarks
SOLD BEFORE RUN. .. 3 Bedroom/2 Bath split foyer with breakfast area, separate dining room, and living room on main level. Upstairs you will find the three bedrooms, and two baths. On the terrace level you will find a large den/recreation area and access to the two car garage. This home sits on a corner lot with an additional one car detached garage with work shop area AND a separate large out building for lots of storage.
Key facts
- 0.37 acre lot
- Garage
- Built 1971
Neighborhood map
What this means for you Summary
Snapshot
- This is a 4-bed/2.0-bath single-family listed at $210k.
Deal economics
- At list price, monthly cash flow is $90 ($1k/yr) — positive.
- The deal already cash-flows at list — no discount required.
- To meet the 1% rule (rent ≥ 1% of price), the offer needs to be $197k (6.0% below list).
- Recommended offer: $197k (6.0% below list) — sets the bar for 1% rule.
- Cap rate 6.8% vs local median 5.0% in Morrow — top-decile yield for the area; either an underpriced asset or a hidden risk that comps aren't pricing in. Stress-test before assuming the spread holds.
Location & tenants
- Location reads 65/100 on livability (#229 in GA) — a middle-class / working-renter tenant base. Strengths: cost of living A+, housing A+; Watch: amenities D, employment D, crime F.
- Clayton County (suburban): math 11% / reading 20% proficiency, ranked #155 of 174 in GA (top 89%) — low school quality limits family demand, transient renter base, plan for 1-2y turnover; 78% free/reduced lunch — lower-income household profile, screen leases tightly.
- Zoned schools: Morrow Elementary School (454 students, 90% FRL); Morrow Middle School (math 14% / reading 24%, grade F, #368 of 470 statewide, top 79%, 779 students, 90% FRL); Morrow High School (math 12% / reading 22%, grade F, #277 of 424 statewide, top 67%, 1,980 students, 91% FRL).
- Market conditions: Rents soft (-1.0%/yr); 173 active listings in the ZIP; 14 comparable units currently listed for rent nearby; rentals leasing fast (median 7d on market — plan ~1-2 weeks tenant-placement turnaround); 865 units permitted in Clayton County in 2024 (448 in 5+ unit buildings).
- This rent runs 45% of the median local income ($53k/yr) — at the standard rent-burdened threshold; future hikes will face affordability resistance.
Forward outlook
- Local home prices are declining (-3.0%/yr); year-one equity from $1k of loan paydown is wiped out by about $6k of value loss. Plan a longer hold.
- Clayton County population projected at +29% by 2050 — long-run rental-demand tailwind backs the buy-and-hold thesis.
Negotiation context
- Only 0 days on market — expect competitive offers; lowballing is unlikely to land.
- Current owner paid $48k; list at $210k implies a 333% gain — meaningful room to come down on a strong offer.
Risks & watch-outs
- Climate carrying-cost: moderate wind risk, 26% chance of damaging wind over 30y; extreme-heat days projected 7→18/yr by 2055 (HVAC capex compounding) — expect insurance premiums to compound above CPI over the hold.
Questions for the listing agent
- Built in 1971 — when were the roof, HVAC, electrical panel, plumbing, and water heater last replaced?
- Is there a deadline driving the sale (1031 exchange, divorce, estate, relocation)? That informs how much negotiation room exists.
- Schools are F-rated, which usually means shorter tenancies and higher turnover. Who's the typical renter profile here, and what's been the actual vacancy rate?
- Crime grade is F in this area — have there been break-ins, vandalism, or insurance claims at this property in the last 3 years? What carrier currently insures it and at what premium?
- The area grade is low — what's the realistic commute time and amenity access for the typical tenant pool here? Any planned neighborhood developments (good or bad) we should know about?
- What's the average days-on-market for RENTAL listings here right now (not sales)? A rising rental-DOM trend means longer vacancies and softer asking-rent achievability than the comps imply.
- What's the recent tenant-quality profile in this submarket — average credit score on applications, eviction rate, late-payment / NSF rate, and stable-employment percentage? A property-management company in the area should have these aggregated.
- How much new for-sale + rental construction is in the pipeline within 1–3 miles? Heavy new supply typically softens prices + rents 12–24 months out; constrained supply supports both.
Investment metrics
- 1% rule
- 0.94% ✗
- Cap rate
- 6.81%
- Cash-on-cash
- 1.84%
- DSCR
- 1.08
- GRM
- 8.9
CMA / ARV
- ARV (on-the-fly)
- $256,365
- Comps found
- 12
Show comp detail 12 sales within ~0.75 mi
| Address | Dist | Beds/Ba | Sqft | Sold | Price | $/sf | Match |
|---|---|---|---|---|---|---|---|
| 6182 Graceland Cir | 0.32mi | 4/2.0 | 1,728 (-9%) | 1mo | $180,200 | $104 | 70 |
| 5955 S Cheryl Dr | 0.26mi | 4/2.0 | 1,996 (+5%) | 15mo | $270,000 | $135 | 66 |
| 6250 Graceland Cir | 0.43mi | 4/2.0 | 1,742 (-8%) | 3mo | $240,000 | $138 | 64 |
| 1343 Burbank Trl | 0.60mi | 5/2.5 (+1) | 1,924 (+1%) | 5mo | $277,060 | $144 | 59 |
| 1893 Stratford Arms Dr | 0.70mi | 4/2.5 | 1,754 (-8%) | 1mo | $245,000 | $140 | 52 |
| 6187 Deans Way | 0.53mi | 3/2.5 (-1) | 1,851 (-2%) | 15mo | $220,500 | $119 | 51 |
| 1890 Carla Dr | 0.73mi | 5/3.0 (+1) | 1,816 (-4%) | 8mo | $335,000 | $184 | 43 |
| 6272 Graceland Cir | 0.47mi | 3/1.5 (-1) | 1,746 (-8%) | 19mo | $229,000 | $131 | 42 |
| 1487 Hammack Dr | 0.54mi | 3/2.0 (-1) | 1,714 (-10%) | 19mo | $230,000 | $134 | 38 |
| 1931 Cornell Way | 0.62mi | 3/2.5 (-1) | 1,620 (-15%) | 3mo | $210,000 | $130 | 37 |
| 1932 Mural Cir | 0.70mi | 4/2.5 | 2,065 (+9%) | 18mo | $260,000 | $126 | 36 |
| 1899 Stratford Arms Dr | 0.72mi | 3/1.5 (-1) | 1,670 (-12%) | 13mo | $231,000 | $138 | 28 |
Match score weights: distance 35% · size 25% · config 20% · recency 20%. Top-matched comps best support the ARV.
Projected returns pro-forma
-3.0% appreciation · 0.0% rent growth · sell at horizon
- IRR
- -16.8%
- Equity multiple
- 0.42×
- Total profit
- $-34,038
- Equity at exit
- $31,312
- IRR
- -15.5%
- Equity multiple
- 0.24×
- Total profit
- $-44,443
- Equity at exit
- $18,157
Cash invested: $58,800 (down + closing). Projections, not guarantees.
Landlord ↔ Tenant lean methodology
- Overall (STATE)
- 90 Strongly Landlord-Friendly
- State Georgia
- 90 Strongly Landlord-Friendly · R+3
- County
- — inherits STATE
- City
- — inherits STATE
ZIP-level market 30260
- Home prices YoY
- -33.8%
- Rents YoY
- -1.0%
- Active inventory
- 173
- Price-to-rent
- 8.9×
Monthly cashflow live
- Estimated rent
- $1,973 high interval (Pro) →
- Mortgage (P&I)
- −$1,101
- Tax from tax record
- −$280 /mo · $3,363/yr
- Insurance
- −$88
- HOA
- −$0
- Vacancy / Maint / Mgmt
- −$414
- Net cashflow
- $90
Break-even live
Sensitivity live
| Price | -10% $209 | -5% $149 | +0% $90 | +5% $31 | +10% $-29 |
|---|---|---|---|---|---|
| Rent | -10% $-66 | -5% $12 | +0% $90 | +5% $168 | +10% $246 |
| Rate | -1.0pp $196 | -0.5pp $143 | base $90 | +0.5pp $36 | +1.0pp $-20 |
UW: 25.0% down · 7.5% · 30yr · 1.5% tax · 5.0% vac · 8.0% maint · 8.0% mgmt
Financing live
Cash to close
- Down payment
- $52,500
- Closing costs
- $6,300
- Reserves months
- —
- Total cash needed
- —
Loan-product check · same deal, 3 products live
Conventional
25% down · 7.5% · 30yr
- Down + closing
- —
- Monthly P&I
- —
- Monthly cashflow
- —
- DSCR
- —
- Eligible?
- —
Personal DTI + credit; lowest rate.
DSCR
20% down · 8.5% · 30yr
- Down + closing
- —
- Monthly P&I
- —
- Monthly cashflow
- —
- DSCR
- —
- Eligible?
- —
No personal income docs; deal must DSCR.
Hard money
10% down · 12.0% · 12mo
- Down + closing
- —
- Monthly P&I
- —
- Monthly cashflow
- —
- DSCR
- —
- Eligible?
- —
Short-term bridge; refi at stabilization.
Rent comps 14 comps
| Address | Beds | Baths | Sqft | Rent | $/sqft | DOM | Units | Dist |
|---|---|---|---|---|---|---|---|---|
| 5969 Twilight Trl Morrow, GA | 4.0 | 2.0 | 1887 | $2,015 | $1.07 | 6d | 1 | 0.25mi |
| 6137 Harvard Ct Morrow, GA | 3.0 | 2.0 | 1320 | $1,531 | $1.16 | 1d | 1 | 0.62mi |
| 1932 Carla Dr Morrow, GA | 3.0 | 2.0 | 1324 | $1,730 | $1.31 | 4d | 1 | 0.83mi |
| 1227 Dove Ct Morrow, GA | 3.0 | 2.0 | 1634 | $1,750 | $1.07 | 45d | 1 | 0.89mi |
| 1811 Wendell Way Morrow, GA | 3.0 | 2.0 | 1285 | $1,574 | $1.22 | 24d | 1 | 1.01mi |
| 2242 Marion Ln Morrow, GA | 4.0 | 2.0 | 2567 | $2,210 | $0.86 | 6d | 1 | 1.16mi |
| 2128 Baden Ct #1 Morrow, GA | 3.0 | 1.5 | 1600 | $1,450 | $0.91 | 1d | 1 | 1.17mi |
| 1055 Pinecrest Dr Forest Park, GA | 3.0 | 1.5 | 2039 | $2,100 | $1.03 | 45d | 1 | 1.19mi |
| 6497 Cameron Rd Morrow, GA | 5.0 | 2.0 | 1358 | $2,040 | $1.50 | 1d | 1 | 1.30mi |
| 5552 Phillips Dr Morrow, GA | 3.0 | 2.0 | 1750 | $1,816 | $1.04 | 7d | 1 | 1.41mi |
| 6010 Fairfield Dr Morrow, GA | 3.0 | 1.5 | 1246 | $1,841 | $1.48 | 5d | 1 | 1.41mi |
| 2260 Hammond Ct Ellenwood, GA | 3.0 | 2.0 | 1248 | $1,850 | $1.48 | 45d | 1 | 1.41mi |
| 5749 Cypress Ct Forest Park, GA | 3.0 | 2.0 | 1534 | $1,820 | $1.19 | 1d | 1 | 1.46mi |
| 5731 Buck Ct Ellenwood, GA | 3.0 | 2.0 | 1242 | $1,525 | $1.23 | 14d | 1 | 1.48mi |
Listing history 3 events
-
2026-05-20historical
-
2026-05-19$210,000
-
1979-06-29soldstatus $48,500
ⓘ Source: listings_history table (triggers on properties + properties_extension) + one-shot
backfill from property_details.listing_events for pre-trigger history.
Tax reassessment forecast GA · Resets to sale price
- Current annual tax
- $3,363 · $280/mo
- Projected year-2 tax
- $3,363 · $280/mo
- Expected delta
- $0/yr ($0/mo · 0.0%)
ⓘ Screening estimate from a state-policy table — verify with the county assessor before closing.
Climate risk First Street
- Flood 1/10 Low FEMA zone X (unshaded) · 0% chance over 30 yrs
- Wildfire 1/10 Low
- Heat 6/10 Major 7 d/yr ≥105°F today · 18 d/yr by 30 yrs out
- Wind 5/10 Major 26% chance of damaging wind over 30 yrs
- Air quality 4/10 Moderate 4 unhealthy d/yr today · 6 by 30 yrs out
Nearby sold comps map
Loading sold comps map…
Walkable amenities ~0.75 mi
Loading nearby amenities…
Taxation est. · year 1
- Rental income
- $23,682
- − Mortgage interest
- −$11,763
- − Property taxes
- −$3,363
- − Insurance
- −$1,050
- − Repairs & maintenance
- −$1,895
- − Management
- −$1,895
- − Depreciation
- −$6,109
- Taxable loss
- −$2,393
- Est. tax savings @ 24.0%
- +$574
- After-tax cash flow
- $1,655/yr
For passive investors: Depreciation is non-cash, so a rental often shows a tax loss while cash-flowing — sheltering income. Rental losses are passive: they offset passive income freely, and up to $25,000/yr can offset ordinary (W-2) income if you actively participate and your MAGI is under $100k (phasing out to $0 by $150k); unused losses carry forward. On sale, claimed depreciation is recaptured at up to 25%, and gains may owe capital-gains tax (a 1031 exchange can defer both). Figures are a year-1 estimate at your 24.0% rate — not tax advice; consult a CPA.
Schools (NCES district)
- District
- Clayton County
- NCES district ID
- 1301230
- Math proficiency
- 11% ▼ -13.00%
- Reading proficiency
- 20% ▼ -9.00%
- Median HH income
- $42,266
- Composite
- 13.41/100
- National rank
- #9527
- State rank
- #155 of 174 in GA
Livability — Morrow
- Score
- 65/100
- State rank
- #229
- US rank
- #13314
Category grades
Schools grade is shown separately in the Schools card above.
Census & demographics
- Census place
- Morrow, GA
- County
- Clayton County · 230,153 people
- City population
- 28,693
- Metro
- Atlanta-Sandy Springs-Alpharetta, GA
- Population (ZIP)
- 28,693
- Household income
- $52,666
- Rent vs Own
- Severe rent burden
- 1956.0
Population outlook (Clayton County) Hauer SSP2
- Today (2025)
- 310,777 people
- By 2030
- 329,762 · +6.1%
- By 2040
- 368,052 · +18.4%
- By 2050
- 401,196 · +29.1%
- By 2075
- 472,488 · +52.0%
- By 2100
- 500,446 · +61.0%
Race, ethnicity, and origin ACS 2023
- Neighborhood character
- Diverse neighborhood (Simpson 0.67)
- Race & ethnicity
- Black 50% Asian 20% Hispanic / Latino 19% Two or more races 7% White 7%
- Hispanic origin (detail)
- Mexican 11% Dominican 1%
- Foreign-born
- 24% · Vietnam, Canada, South Korea
- Languages at home
- 63% English-only · Spanish 17% Vietnamese 16% Other Asian/Pacific 1%
Political lean MEDSL · Clayton
- 2024 margin
- Solid D (+69.2) · D 84.3% · R 15.1%
- 2008→2024 swing
- +2.8pp toward D · 2008: 66.4pp · 2024: 69.2pp
- All cycles
- 2024: D+69.2 2020: D+70.9 2016: D+71.9 2012: D+70.1 2008: D+66.4
Not yet ingested
- Civics
- —
Market trends
- HPI YoY
- ▼ -98.24%
- Current HPI
- 192.3741
- Rent YoY
- ▼ -1.00%
- Metro
- Atlanta-Sandy Springs-Alpharetta, GA
- State GDP YoY
- ▲ 2.66%
- F500 in state
- 28
Industry mix (Fortune 500 HQ in GA)
| Industry | F500 HQs | Revenue |
|---|---|---|
| Paper / Packaging | 2 | $29B |
|
||
| Retail | 1 | $160B |
|
||
| Transportation / Logistics | 1 | $91B |
|
||
| Airlines | 1 | $62B |
|
||
| Consumer Goods | 1 | $47B |
|
||
| Utilities | 1 | $25B |
|
||
Price history
+333.0% since first listed3 events — show timeline
- 2026-05-20 Listing Removed — GAMLS
- 2026-05-19 Listed $210,000 GAMLS
- 1979-06-29 Sold (Public Records) $48,500 Public Records
Property tax history
+4.5%/yrLatest (2025): $3,363 · +4.4% YoY. Source: county tax records.
Cash-flow waterfall
monthlySold comps — $/sqft
last 12 mo · ≤1 miLoading sold comps…