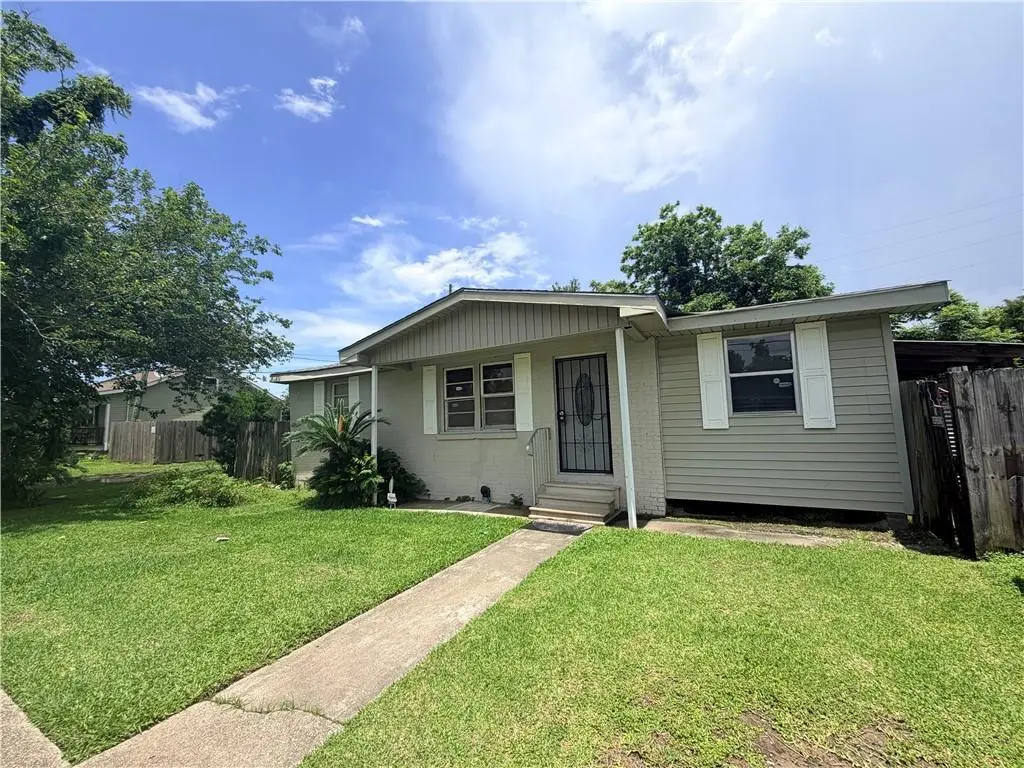
1056 Lesan Dr · Kenner, LA
Flood risk No data
- FEMA flood zone
- —
- Chance of flooding over 30 yrs
- —
- Est. flood insurance / yr
- —
Fire risk No data
- Est. fire insurance / yr
- —
Heat risk No data
- Hot days now (above threshold)
- —
- Hot days in 30 yrs
- —
Wind risk No data
- Chance of severe wind over 30 yrs
- —
Air-quality risk No data
- Unhealthy air days now
- —
- Unhealthy air days in 30 yrs
- —
Risk factors via First Street. Map © Google.
Why this score? — see what drove the B+ grade
The composite is a weighted blend of 9 inputs, each scored 0–100. Each bar is that input's sub-score; the figure is the points it added to the 100-point composite (weight × sub-score).
- Cash flow +30.0/30.0
- ARV discount +15.0/15.0
- DSCR +10.0/10.0
- 1% rule +9.0/10.0
- Livability +3.9/5.0
- Rent growth +2.5/5.0
- Schools +2.5/10.0
- Condition / age +2.5/5.0
- Appreciation +0.0/10.0
$115,000
🖨 Deal sheet (PDF) 📄 Offer letter ✓ Due diligence
Listing remarks MLS
Opportunity KNOCKS! Investor Special, 3 bedrooms, 1 bath great with a great floor plan and yard. This charming home offers a canvas for buyers looking to add their personal touch and build instant equity. Featuring a functional layout, spacious rooms, and great curb appeal potential, this property offers endless possibilities for renovation and customization. Newer roof. Bring your offers! Being sold AS-IS.
Key facts
- Newer roof
- Spacious rooms
- Great floor plan
Tags
Property features AI
Exterior
- Parking: Off-street parking
- Utilities: Public water; Public sewer
- Home design: Single-story home; Average condition; Raised foundation
- Construction: Brick and vinyl siding exterior; Shingle roof; Raised foundation
- Exterior features: Covered patio/porch; City lot; Rectangular lot; Lot dimensions approximately 60 x 92
Interior
- Kitchen: Oven; Range
- Bedrooms: Total rooms: 6
- Bathrooms: 1 full bathroom
- Heating & cooling: Central heating; Central air; Window unit(s) for cooling
- Interior features: Carbon monoxide detector
Neighborhood map
What this means for you Summary
Snapshot
- This is a 3-bed/1.0-bath single-family listed at $115k.
Deal economics
- At list price, monthly cash flow is $525 ($6k/yr) — positive.
- The deal already cash-flows at list — no discount required.
- Meets the 1% rule at list price ($2k rent vs $115k).
- Recommended offer: $113k (1.5% below list) — sets the bar for market timing.
- Cap rate 11.8% vs local median 5.3% in Kenner — top-decile yield for the area; either an underpriced asset or a hidden risk that comps aren't pricing in. Stress-test before assuming the spread holds.
Location & tenants
- Location reads 78/100 on livability (#6 in LA, #2,414 nationally) — a middle-class / working-renter tenant base. Strengths: cost of living A+, housing A+, health & safety A+; Watch: amenities C-, employment C-, crime D.
- Jefferson Parish (suburban): math 24% / reading 34% proficiency, ranked #44 of 98 in LA (top 45%) — low school quality limits family demand, transient renter base, plan for 1-2y turnover; 70% free/reduced lunch — lower-income household profile, screen leases tightly.
- Zoned schools: Airline Park Academy For Advanced Studies (math 92% / reading 92%, grade A+, #3 of 646 statewide, top 0%, 418 students, 16% FRL); Bonnabel Magnet Academy High School (math 12% / reading 21%, grade F, #214 of 265 statewide, top 81%, 1,478 students, 52% FRL) — zoned schools average 34% FRL vs 70% district-wide (36 pts lower); this property's tenant base skews higher-income than the district average.
- Zoned-school proficiency averages 54% at this address vs 29% district-wide (+25 pts) — the actual schools serving this property are materially stronger than the Jefferson Parish average implies; a family-tenant draw the district grade alone would hide.
- Market conditions: 91 active listings in the ZIP; 8 comparable units currently listed for rent nearby; rentals at typical pace (median 23d on market — plan ~3-4 weeks tenant-placement turnaround); 518 units permitted in Jefferson Parish in 2024 (43 in 5+ unit buildings).
- This rent runs 38% of the median local income ($51k/yr) — at the standard rent-burdened threshold; future hikes will face affordability resistance.
Forward outlook
- Local home prices are declining (-3.0%/yr); year-one equity from $795 of loan paydown is wiped out by about $3k of value loss. Plan a longer hold.
- At projected returns (-3.0% appreciation + 3.0% rent growth), your $32k cash investment doubles in ~7 years — after that, you're playing with house money.
Negotiation context
- It's been on market 23 days — a 2% lower offer ($113k) is reasonable based on typical stale-listing flexibility.
- 6 sale attempts since 22y ago with the ask held roughly flat each time — persistent listings suggest the price (not the market) is what's stuck; bring a comps-based counter.
Questions for the listing agent
- Built in 1962 — when were the roof, HVAC, electrical panel, plumbing, and water heater last replaced?
- Is there a deadline driving the sale (1031 exchange, divorce, estate, relocation)? That informs how much negotiation room exists.
- Crime grade is D in this area — have there been break-ins, vandalism, or insurance claims at this property in the last 3 years? What carrier currently insures it and at what premium?
- What's the average days-on-market for RENTAL listings here right now (not sales)? A rising rental-DOM trend means longer vacancies and softer asking-rent achievability than the comps imply.
- What's the recent tenant-quality profile in this submarket — average credit score on applications, eviction rate, late-payment / NSF rate, and stable-employment percentage? A property-management company in the area should have these aggregated.
- How much new for-sale + rental construction is in the pipeline within 1–3 miles? Heavy new supply typically softens prices + rents 12–24 months out; constrained supply supports both.
Investment metrics
- 1% rule
- 1.40% ✓
- Cap rate
- 11.77%
- Cash-on-cash
- 19.56%
- DSCR
- 1.87
- GRM
- 5.9
CMA / ARV
- ARV (on-the-fly)
- $141,504
- Comps found
- 5
Show comp detail 5 sales within ~0.75 mi
| Address | Dist | Beds/Ba | Sqft | Sold | Price | $/sf | Match |
|---|---|---|---|---|---|---|---|
| 1114 Lesan Dr | 0.04mi | 2/1.0 (-1) | 1,100 (+4%) | 17mo | $147,000 | $134 | 72 |
| 907 Curtis Ave | 0.23mi | 2/1.0 (-1) | 972 (-8%) | 6mo | $75,000 | $77 | 66 |
| 829 Minden Ave | 0.30mi | 2/1.0 (-1) | 1,010 (-4%) | 13mo | $75,000 | $74 | 63 |
| 186 Oakland St | 0.19mi | 2/1.0 (-1) | 916 (-13%) | 9mo | $150,000 | $164 | 57 |
| 303 Audubon Ct | 0.67mi | 3/1.0 | 1,000 (-5%) | 11mo | $199,000 | $199 | 51 |
Match score weights: distance 35% · size 25% · config 20% · recency 20%. Top-matched comps best support the ARV.
Projected returns pro-forma
-3.0% appreciation · 3.0% rent growth · sell at horizon
- IRR
- 11.6%
- Equity multiple
- 1.46×
- Total profit
- $14,788
- Equity at exit
- $17,147
- IRR
- 20.6%
- Equity multiple
- 2.74×
- Total profit
- $55,903
- Equity at exit
- $9,943
Cash invested: $32,200 (down + closing). Projections, not guarantees.
Landlord ↔ Tenant lean methodology
- Overall (STATE)
- 90 Strongly Landlord-Friendly
- State Louisiana
- 90 Strongly Landlord-Friendly · R+12
- County
- — inherits STATE
- City
- — inherits STATE
ZIP-level market 70062
- Active inventory
- 91
- Price-to-rent
- 5.9×
Monthly cashflow live
- Estimated rent
- $1,612 high interval (Pro) →
- Mortgage (P&I)
- −$603
- Tax from tax record
- −$98 /mo · $1,173/yr
- Insurance
- −$48
- HOA
- −$0
- Vacancy / Maint / Mgmt
- −$339
- Net cashflow
- $525
Break-even live
Sensitivity live
| Price | -10% $590 | -5% $557 | +0% $525 | +5% $492 | +10% $460 |
|---|---|---|---|---|---|
| Rent | -10% $397 | -5% $461 | +0% $525 | +5% $589 | +10% $652 |
| Rate | -1.0pp $583 | -0.5pp $554 | base $525 | +0.5pp $495 | +1.0pp $465 |
UW: 25.0% down · 7.5% · 30yr · 1.5% tax · 5.0% vac · 8.0% maint · 8.0% mgmt
Financing live
Cash to close
- Down payment
- $28,750
- Closing costs
- $3,450
- Reserves months
- —
- Total cash needed
- —
Loan-product check · same deal, 3 products live
Conventional
25% down · 7.5% · 30yr
- Down + closing
- —
- Monthly P&I
- —
- Monthly cashflow
- —
- DSCR
- —
- Eligible?
- —
Personal DTI + credit; lowest rate.
DSCR
20% down · 8.5% · 30yr
- Down + closing
- —
- Monthly P&I
- —
- Monthly cashflow
- —
- DSCR
- —
- Eligible?
- —
No personal income docs; deal must DSCR.
Hard money
10% down · 12.0% · 12mo
- Down + closing
- —
- Monthly P&I
- —
- Monthly cashflow
- —
- DSCR
- —
- Eligible?
- —
Short-term bridge; refi at stabilization.
Rent comps 8 comps
| Address | Beds | Baths | Sqft | Rent | $/sqft | DOM | Units | Dist |
|---|---|---|---|---|---|---|---|---|
| 511 Dell St Saint Rose, LA | 3.0 | 2.0 | 1220 | $1,950 | $1.60 | 18d | 1 | 1.14mi |
| 2611 Richland St Kenner, LA | 3.0 | 2.5 | 1443 | $2,200 | $1.52 | 3d | 1 | 1.27mi |
| 2604 Richland St Unit 1 Kenner, LA | 3.0 | 2.0 | 1442 | $1,500 | $1.04 | 6d | 1 | 1.27mi |
| 619 Warren St Unit B Kenner, LA | 2.0 | 2.0 | 800 | $1,200 | $1.50 | 45d | 1 | 1.29mi |
| 519 Warren St Unit D Kenner, LA | 2.0 | 1.0 | 700 | $1,000 | $1.43 | 45d | 1 | 1.29mi |
| 135 27th St Kenner, LA | 3.0 | 2.0 | 1205 | $1,200 | $1.00 | 6d | 1 | 1.31mi |
| 2726 Greenwood St Kenner, LA | 2.0 | 1.5 | 980 | $1,200 | $1.22 | 45d | 1 | 1.47mi |
| 2800 Richland St Unit B Kenner, LA | 2.0 | 2.5 | 1000 | $1,600 | $1.60 | 23d | 1 | 1.48mi |
Listing history 24 events
-
2026-06-21days on market $115,000 Active 23 DOM
-
2026-06-18days on market $115,000 Active 20 DOM
-
2026-06-17days on market $115,000 Active 19 DOM
-
2026-06-16days on market $115,000 Active 18 DOM
-
2026-06-15days on market $115,000 Active 17 DOM
-
2026-06-13days on market $115,000 Active 15 DOM
-
2026-06-10days on market $115,000 Active 12 DOM
-
2026-06-09days on market $115,000 Active 11 DOM
-
2026-06-08days on market $115,000 Active 10 DOM
-
2026-06-07days on market $115,000 Active 9 DOM
-
2026-06-03days on market $115,000 Active 5 DOM
-
2026-06-02days on market $115,000 Active 4 DOM
-
2026-06-01days on market $115,000 Active 3 DOM
-
2026-05-31days on market $115,000 Active 2 DOM
-
2026-05-29$115,000 Active 410-char remark
Show marketing remark (410 chars)
Opportunity KNOCKS! Investor Special, 3 bedrooms, 1 bath great with a great floor plan and yard. This charming home offers a canvas for buyers looking to add their personal touch and build instant equity. Featuring a functional layout, spacious rooms, and great curb appeal potential, this property offers endless possibilities for renovation and customization. Newer roof. Bring your offers! Being sold AS-IS.
-
2026-05-29$115,000 Active
Show marketing remark (410 chars)
Opportunity KNOCKS! Investor Special, 3 bedrooms, 1 bath great with a great floor plan and yard. This charming home offers a canvas for buyers looking to add their personal touch and build instant equity. Featuring a functional layout, spacious rooms, and great curb appeal potential, this property offers endless possibilities for renovation and customization. Newer roof. Bring your offers! Being sold AS-IS.
-
2007-04-30soldstatus $114,500
-
2007-04-26soldstatus $114,500
-
2007-01-15$119,900
-
2007-01-15$119,900
-
2004-07-01soldstatus $75,000
-
2004-06-29soldstatus $75,000
-
2004-06-28$75,000
-
2004-06-28$75,000
ⓘ Source: listings_history table (triggers on properties + properties_extension) + one-shot
backfill from property_details.listing_events for pre-trigger history.
Tax reassessment forecast LA · Resets to sale price
- Current annual tax
- $1,173 · $98/mo
- Projected year-2 tax
- $1,173 · $98/mo
- Expected delta
- $0/yr ($0/mo · 0.0%)
ⓘ Screening estimate from a state-policy table — verify with the county assessor before closing.
Nearby sold comps map
Loading sold comps map…
Walkable amenities ~0.75 mi
Loading nearby amenities…
Taxation est. · year 1
- Rental income
- $19,345
- − Mortgage interest
- −$6,442
- − Property taxes
- −$1,173
- − Insurance
- −$575
- − Repairs & maintenance
- −$1,548
- − Management
- −$1,548
- − Depreciation
- −$3,345
- Taxable income
- $4,715
- Est. tax owed @ 24.0%
- −$1,132
- After-tax cash flow
- $5,166/yr
For passive investors: Depreciation is non-cash, so a rental often shows a tax loss while cash-flowing — sheltering income. Rental losses are passive: they offset passive income freely, and up to $25,000/yr can offset ordinary (W-2) income if you actively participate and your MAGI is under $100k (phasing out to $0 by $150k); unused losses carry forward. On sale, claimed depreciation is recaptured at up to 25%, and gains may owe capital-gains tax (a 1031 exchange can defer both). Figures are a year-1 estimate at your 24.0% rate — not tax advice; consult a CPA.
Schools (NCES district)
- District
- Jefferson Parish
- NCES district ID
- 2200840
- Math proficiency
- 24% ▼ -36.00%
- Reading proficiency
- 34% ▼ -30.00%
- Median HH income
- $48,421
- Composite
- 25.19/100
- National rank
- #7511
- State rank
- #44 of 98 in LA
Livability — Kenner
- Score
- 78/100
- State rank
- #6
- US rank
- #2414
Category grades
Schools grade is shown separately in the Schools card above.
Census & demographics
- Census place
- Kenner, LA
- County
- Jefferson Parish · 426,999 people
- City population
- 66,707
- Metro
- New Orleans-Metairie, LA
- Population (ZIP)
- 17,771
- Household income
- $51,477
- Rent vs Own
- Severe rent burden
- 1082.0
Population outlook (Jefferson County) Hauer SSP2
- Today (2025)
- 451,696 people
- By 2030
- 455,451 · +0.8%
- By 2040
- 458,308 · +1.5%
- By 2050
- 461,031 · +2.1%
- By 2075
- 476,351 · +5.5%
- By 2100
- 499,377 · +10.6%
Race, ethnicity, and origin ACS 2023
- Neighborhood character
- Highly diverse neighborhood (Simpson 0.70)
- Race & ethnicity
- Hispanic / Latino 37% Black 29% White 27% Two or more races 17% Asian 2% Native American 1%
- Hispanic origin (detail)
- Mexican 6% Cuban 2% Dominican 2%
- Common ancestry
- Lithuanian 5%
- Foreign-born
- 22% · Canada
- Languages at home
- 66% English-only · Spanish 32% Other Indo-European 2%
Political lean MEDSL · Jefferson
- 2024 margin
- R (+12.9) · D 42.5% · R 55.5% · Other 2.1%
- 2008→2024 swing
- +13.6pp toward D · 2008: -26.6pp · 2024: -12.9pp
- All cycles
- 2024: R+12.9 2020: R+11.1 2016: R+14.8 2012: R+18.4 2008: R+26.6
Not yet ingested
- Civics
- —
Market trends
- HPI YoY
- ▼ -108.55%
- Current HPI
- 105.3411
- Rent YoY
- —
- Metro
- New Orleans-Metairie, LA
- State GDP YoY
- ▲ 3.29%
- F500 in state
- 10
Industry mix (Fortune 500 HQ in LA)
| Industry | F500 HQs | Revenue |
|---|---|---|
| Telecommunications | 2 | $23B |
|
||
| Utilities | 1 | $12B |
|
||
| Wholesale / Distribution | 1 | $5B |
|
||
| Advertising | 1 | $2B |
|
||
Price history
+53.3% since first listed10 events — show timeline
- 2026-05-29 Listed $115,000 GSREIN
- 2026-05-29 Listed $115,000 AcadianaMLS
- 2007-04-30 Sold (Public Records) $114,500 Public Records
- 2007-04-26 Sold (MLS) $114,500 GSREIN
- 2007-01-15 Listed $119,900 GSREIN
- 2007-01-15 Listed $119,900 AcadianaMLS
- 2004-07-01 Sold (Public Records) $75,000 Public Records
- 2004-06-29 Sold (MLS) $75,000 GSREIN
- 2004-06-28 Listed $75,000 GSREIN
- 2004-06-28 Listed $75,000 AcadianaMLS
Property tax history
+2.2%/yrLatest (2025): $1,173 · -0.4% YoY. Source: county tax records.
Cash-flow waterfall
monthlySold comps — $/sqft
last 12 mo · ≤1 miLoading sold comps…