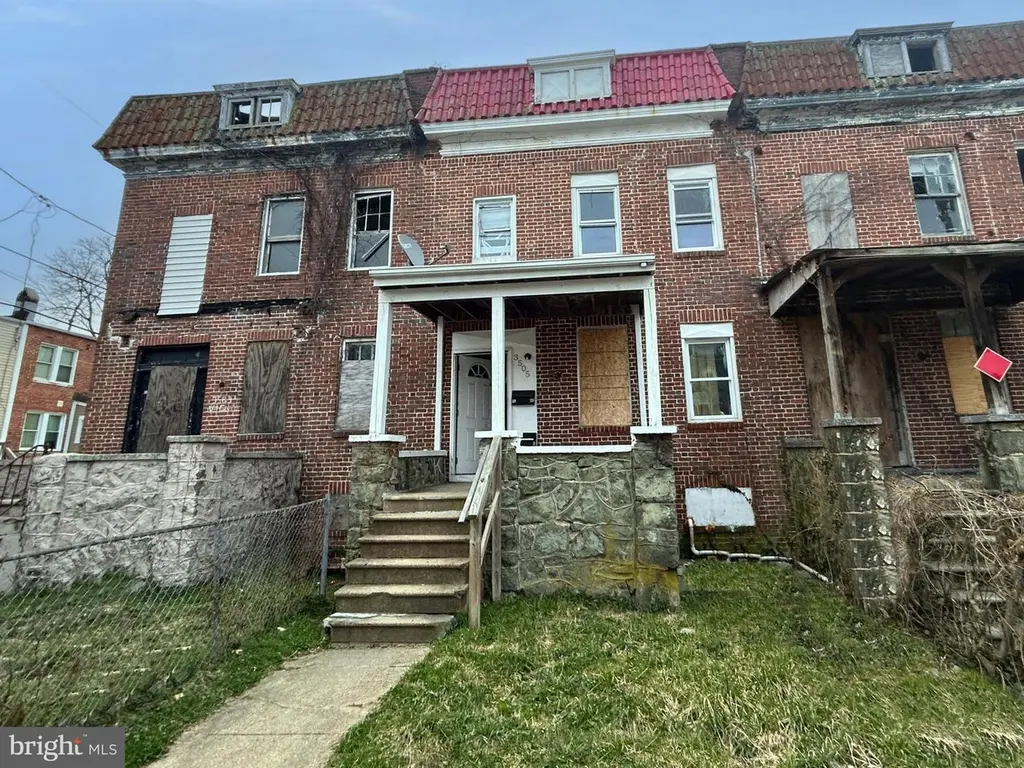
3505 Virginia Ave · Baltimore, MD
Flood risk 6/10 · Moderate
- FEMA flood zone
- X (unshaded)
- Chance of flooding over 30 yrs
- 0.73%
- Est. flood insurance / yr
- $473 – $860
Fire risk 1/10 · Minimal
- Est. fire insurance / yr
- $755 – $1,403
Heat risk 7/10 · Major
- Hot days now (above 104°F)
- 7 days/yr
- Hot days in 30 yrs
- 15 days/yr
Wind risk 5/10 · Moderate
- Chance of severe wind over 30 yrs
- 26.0%
Air-quality risk 3/10 · Minor
- Unhealthy air days now
- 3 days/yr
- Unhealthy air days in 30 yrs
- 4 days/yr
Risk factors via First Street. Map © Google.
Why this score? — see what drove the B+ grade
The composite is a weighted blend of 9 inputs, each scored 0–100. Each bar is that input's sub-score; the figure is the points it added to the 100-point composite (weight × sub-score).
- Cash flow +30.0/30.0
- ARV discount +15.0/15.0
- 1% rule +10.0/10.0
- DSCR +10.0/10.0
- Livability +3.8/5.0
- Rent growth +3.1/5.0
- Condition / age +2.5/5.0
- Schools +1.0/10.0
- Appreciation +0.0/10.0
$84,900
🖨 Deal sheet (PDF) 📄 Offer letter ✓ Due diligence
Listing remarks MLS
Discover an exceptional investment opportunity in the heart of Lucille Park! This charming 4-bedroom, 3-bathroom townhouse, built in 1920, seamlessly blends historic character with modern functionality. The Federal architectural style, complemented by a classic brick façade, offers timeless appeal that attracts discerning buyers or investors. Venture inside to discover laminated plank and ceramic tile flooring that enhances the home's warmth. The interior features include convenient basement bedroom and a second kitchen, perfect for multi-generational living or as an additional income-generating space. The exterior has a porch that invites relaxation, while the rear yard offers a private outdoor space for gatherings or gardening, increasing the property's allure. The home is close in proximity to local amenities and shopping ensures high demand for rental opportunities. Don't miss the chance to invest in a property that combines comfort, charm, and potential returns.
Key facts
- Basement bedroom
- Historic character
- Brick façade
Tags
Neighborhood map
What this means for you Summary
Snapshot
- This is a 4-bed/3.0-bath townhouse listed at $85k.
Deal economics
- At list price, monthly cash flow is $821 ($10k/yr) — positive.
- The deal already cash-flows at list — no discount required.
- Meets the 1% rule at list price ($2k rent vs $85k).
- Recommended offer: $80k (6.0% below list) — sets the bar for market timing.
Location & tenants
- Location reads 76/100 on livability (#90 in MD, #3,396 nationally) — a middle-class / working-renter tenant base. Strengths: amenities A+, commute A+, housing A+; Watch: crime F.
- Baltimore City Public Schools (urban): math 7% / reading 16% proficiency, ranked #24 of 24 in MD (top 100%) — low school quality limits family demand, transient renter base, plan for 1-2y turnover; 79% free/reduced lunch — lower-income household profile, screen leases tightly.
- Zoned schools: Elmer A. Henderson: A Johns Hopkins Partnership (math 2% / reading 16%, grade F, #650 of 860 statewide, top 77%, 642 students, 80% FRL); Baltimore Polytechnic Institute (math 71% / reading 84%, grade A-, #22 of 222 statewide, top 10%, 1,555 students, 43% FRL) — zoned schools average 62% FRL vs 79% district-wide (17 pts lower); this property's tenant base skews higher-income than the district average.
- Zoned-school proficiency averages 43% at this address vs 12% district-wide (+32 pts) — the actual schools serving this property are materially stronger than the Baltimore City Public Schools average implies; a family-tenant draw the district grade alone would hide.
- Market conditions: Rents rising (+2.4%/yr); 354 active listings in the ZIP; 18 comparable units currently listed for rent nearby; rentals at typical pace (median 26d on market — plan ~3-4 weeks tenant-placement turnaround); 44% of comp listings sitting > 30 days — soft ceiling on asking rent; 1,273 units permitted in Baltimore city in 2024 (1,104 in 5+ unit buildings).
Forward outlook
- Local home prices are declining (-3.0%/yr); year-one equity from $587 of loan paydown is wiped out by about $3k of value loss. Plan a longer hold.
- Baltimore County population projected to shrink 4% by 2050 — rents likely to lag national; underwrite the cash flow, not the appreciation.
- At projected returns (-3.0% appreciation + 2.4% rent growth), your $24k cash investment doubles in ~3 years — after that, you're playing with house money.
Negotiation context
- It's been on market 73 days — a 6% lower offer ($80k) is reasonable based on typical stale-listing flexibility.
- 6 sale attempts since 10y ago; this cycle's ask has dropped $25k (23%) from the opening price — seller is motivated, your offer sets the floor, not the list.
- Current owner paid $60k; 42% above their basis — modest negotiation headroom, anchor on the comps not their cost.
Risks & watch-outs
- Watch-outs: property tax is 3.6% of price; built in 1920 — expect roof / HVAC / electrical / plumbing capex.
- Climate carrying-cost: major flood risk; moderate wind risk, 26% chance of damaging wind over 30y; extreme-heat days projected 7→15/yr by 2055 (HVAC capex compounding) — expect insurance premiums to compound above CPI over the hold.
Questions for the listing agent
- It's been on market 73 days. Have you received any prior offers? Is the seller open to a 6% concession, seller financing, or rate buy-down credit?
- Built in 1920 — when were the roof, HVAC, electrical panel, plumbing, and water heater last replaced?
- Property tax is high relative to price — has the assessment been appealed recently, and will the sale trigger a re-assessment?
- Why hasn't it sold? Are there any deal-killer items the seller is aware of (foundation, flood, title, zoning, code violations)?
- Is there a deadline driving the sale (1031 exchange, divorce, estate, relocation)? That informs how much negotiation room exists.
- Schools are D-rated, which usually means shorter tenancies and higher turnover. Who's the typical renter profile here, and what's been the actual vacancy rate?
- Crime grade is F in this area — have there been break-ins, vandalism, or insurance claims at this property in the last 3 years? What carrier currently insures it and at what premium?
- What's the average days-on-market for RENTAL listings here right now (not sales)? A rising rental-DOM trend means longer vacancies and softer asking-rent achievability than the comps imply.
- What's the recent tenant-quality profile in this submarket — average credit score on applications, eviction rate, late-payment / NSF rate, and stable-employment percentage? A property-management company in the area should have these aggregated.
- How much new for-sale + rental construction is in the pipeline within 1–3 miles? Heavy new supply typically softens prices + rents 12–24 months out; constrained supply supports both.
Investment metrics
- 1% rule
- 2.32% ✓
- Cap rate
- 17.89%
- Cash-on-cash
- 41.42%
- DSCR
- 2.84
- GRM
- 3.6
CMA / ARV
- ARV (median comp)
- $150,869
- List price
- $84,900
- Delta
- -43.73%
- Verdict
- UNDERPRICED
- Comps
- 20 within 1.0 mi
Show comp detail 12 sales within ~0.75 mi
| Address | Dist | Beds/Ba | Sqft | Sold | Price | $/sf | Match |
|---|---|---|---|---|---|---|---|
| 3824 Beehler Ave | 0.21mi | 3/1.5 (-1) | 1,080 (-2%) | 3mo | $88,000 | $81 | 74 |
| 3716 Columbus Dr | 0.23mi | 4/2.0 | 1,200 (+9%) | 3mo | $242,000 | $202 | 68 |
| 3709 Columbus Dr | 0.26mi | 3/1.5 (-1) | 1,200 (+9%) | 0mo | $133,900 | $112 | 62 |
| 2904 Virginia Ave | 0.59mi | 3/1.5 (-1) | 1,116 (+2%) | 2mo | $202,000 | $181 | 57 |
| 3701 Columbus Dr | 0.26mi | 3/1.0 (-1) | 1,200 (+9%) | 4mo | $108,000 | $90 | 57 |
| 3912 Reisterstown Rd | 0.69mi | 3/1.5 (-1) | 1,100 (0%) | 1mo | $55,000 | $50 | 56 |
| 3906 Grantley Rd | 0.48mi | 3/1.5 (-1) | 1,178 (+7%) | 1mo | $127,000 | $108 | 54 |
| 3914 Ridgewood Ave | 0.62mi | 3/1.5 (-1) | 1,110 (+1%) | 6mo | $95,400 | $86 | 53 |
| 2841 Oakford Ave | 0.53mi | 3/2.0 (-1) | 1,044 (-5%) | 8mo | $79,000 | $76 | 52 |
| 3918 Dolfield Ave | 0.49mi | 3/1.5 (-1) | 1,216 (+10%) | 5mo | $200,000 | $164 | 44 |
| 4541 The Strand | 0.71mi | 3/1.5 (-1) | 1,152 (+5%) | 8mo | $110,000 | $95 | 42 |
| 3841 Boarman Ave | 0.58mi | 3/2.0 (-1) | 1,249 (+14%) | 5mo | $52,250 | $42 | 37 |
Match score weights: distance 35% · size 25% · config 20% · recency 20%. Top-matched comps best support the ARV.
Projected returns pro-forma
-3.0% appreciation · 2.41% rent growth · sell at horizon
- IRR
- 37.3%
- Equity multiple
- 2.58×
- Total profit
- $37,460
- Equity at exit
- $12,659
- IRR
- 43.6%
- Equity multiple
- 5.03×
- Total profit
- $95,689
- Equity at exit
- $7,341
Cash invested: $23,772 (down + closing). Projections, not guarantees.
Landlord ↔ Tenant lean methodology
- Overall (CITY)
- 12 Strongly Tenant-Friendly
- State Maryland
- 27 Tenant-Leaning · D+14
- County
- — inherits STATE
- City Baltimore
- 12 Strongly Tenant-Friendly · D+58
ZIP-level market 21215
- Rents YoY
- 2.4%
- Active inventory
- 354
- Price-to-rent
- 3.6×
Monthly cashflow live
- Estimated rent
- $1,970 high interval (Pro) →
- Mortgage (P&I)
- −$445
- Tax from tax record
- −$255 /mo · $3,058/yr
- Insurance
- −$35
- HOA
- −$0
- Vacancy / Maint / Mgmt
- −$414
- Net cashflow
- $821
Break-even live
Sensitivity live
| Price | -10% $869 | -5% $845 | +0% $821 | +5% $796 | +10% $772 |
|---|---|---|---|---|---|
| Rent | -10% $665 | -5% $743 | +0% $821 | +5% $898 | +10% $976 |
| Rate | -1.0pp $863 | -0.5pp $842 | base $821 | +0.5pp $799 | +1.0pp $776 |
UW: 25.0% down · 7.5% · 30yr · 1.5% tax · 5.0% vac · 8.0% maint · 8.0% mgmt
Financing live
Cash to close
- Down payment
- $21,225
- Closing costs
- $2,547
- Reserves months
- —
- Total cash needed
- —
Loan-product check · same deal, 3 products live
Conventional
25% down · 7.5% · 30yr
- Down + closing
- —
- Monthly P&I
- —
- Monthly cashflow
- —
- DSCR
- —
- Eligible?
- —
Personal DTI + credit; lowest rate.
DSCR
20% down · 8.5% · 30yr
- Down + closing
- —
- Monthly P&I
- —
- Monthly cashflow
- —
- DSCR
- —
- Eligible?
- —
No personal income docs; deal must DSCR.
Hard money
10% down · 12.0% · 12mo
- Down + closing
- —
- Monthly P&I
- —
- Monthly cashflow
- —
- DSCR
- —
- Eligible?
- —
Short-term bridge; refi at stabilization.
Rent comps 18 comps
| Address | Beds | Baths | Sqft | Rent | $/sqft | DOM | Units | Dist |
|---|---|---|---|---|---|---|---|---|
| 3784 Columbus Dr Baltimore, MD | 4.0 | 2.0 | 1250 | $2,200 | $1.76 | 25d | 1 | 0.27mi |
| 4230 Towanda Ave Baltimore, MD | 3.0 | 2.0 | 1400 | $1,800 | $1.29 | 19d | 1 | 0.37mi |
| 4037 Cedardale Rd Baltimore, MD | 5.0 | 3.0 | 1500 | $2,800 | $1.87 | 16d | 1 | 0.48mi |
| 3016 Thorndale Ave Baltimore, MD | 1.0–3.0 | 1.0 | 700 | $1,200 | $1.71 | 6d | 14 | 0.50mi |
| 2915 Oakford Ave Baltimore, MD | 3.0 | 2.0 | 1102 | $1,600 | $1.45 | 19d | 1 | 0.52mi |
| 2527 W Cold Spring Ln Baltimore, MD | 3.0 | 2.0 | 1152 | $1,695 | $1.47 | 0d | 1 | 0.53mi |
| 2619 Loyola Northway Baltimore, MD | 3.0 | 2.0 | 1400 | $1,995 | $1.43 | 25d | 1 | 0.57mi |
| 2454 W Cold Spring Ln Baltimore, MD | 3.0 | 1.0 | 1200 | $1,650 | $1.38 | 25d | 1 | 0.65mi |
| 5115 Pembridge Ave Baltimore, MD | 3.0 | 2.0 | 1088 | $2,150 | $1.98 | 45d | 1 | 0.77mi |
| 2415 Loyola Southway Baltimore, MD | 3.0 | 1.5 | 1200 | $2,033 | $1.69 | 45d | 1 | 0.78mi |
| 5301 Maple Ave Baltimore, MD | 3.0 | 1.0 | 960 | $1,700 | $1.77 | 45d | 1 | 0.82mi |
| 2530 Edgecombe Cir N Baltimore, MD | 2.0–3.0 | 1.0 | 920 | $1,325 | $1.44 | 4d | 4 | 0.84mi |
| 3822 Pall Mall Rd Baltimore, MD | 3.0 | 1.5 | 1320 | $1,875 | $1.42 | 45d | 1 | 0.86mi |
| 3912 Mortimer Ave Baltimore, MD | 3.0 | 2.0 | 1204 | $2,723 | $2.26 | 45d | 1 | 1.21mi |
| 2001 W Cold Spring Ln Baltimore, MD | 1.0–3.0 | 1.0–2.0 | 1133 | $3,300 | $2.91 | 0d | 27 | 1.28mi |
| 3727 Milford Ave Gwynn Oak, MD | 3.0 | 1.0 | 900 | $1,450 | $1.61 | 45d | 1 | 1.37mi |
| 3632 Parkdale Ave Baltimore, MD | 3.0 | 1.0 | 1400 | $3,000 | $2.14 | 45d | 1 | 1.38mi |
| 3601 Howard Park Ave Unit 2 Baltimore, MD | 3.0 | 1.0 | 1000 | $1,650 | $1.65 | 45d | 1 | 1.42mi |
Listing history 31 events
-
2026-06-21days on market $84,900 Active 73 DOM
-
2026-06-18days on market $84,900 Active 70 DOM
-
2026-06-17days on market $84,900 Active 69 DOM
-
2026-06-16days on market $84,900 Active 68 DOM
-
2026-06-15pricedays on market $84,900 Active 67 DOM
-
2026-06-13days on market $99,900 Active 65 DOM
-
2026-06-09days on market $99,900 Active 61 DOM
-
2026-06-08days on market $99,900 Active 60 DOM
-
2026-06-07days on market $99,900 Active 59 DOM
-
2026-06-04days on market $99,900 Active 56 DOM
-
2026-06-03days on market $99,900 Active 55 DOM
-
2026-06-02days on market $99,900 Active 54 DOM
-
2026-06-01days on market $99,900 Active 53 DOM
-
2026-05-31days on market $99,900 Active 52 DOM
-
2026-05-09price $99,900 988-char remark
Show marketing remark (988 chars)
Discover an exceptional investment opportunity in the heart of Lucille Park! This charming 4-bedroom, 3-bathroom townhouse, built in 1920, seamlessly blends historic character with modern functionality. The Federal architectural style, complemented by a classic brick façade, offers timeless appeal that attracts discerning buyers or investors. Venture inside to discover laminated plank and ceramic tile flooring that enhances the home's warmth. The interior features include convenient basement bedroom and a second kitchen, perfect for multi-generational living or as an additional income-generating space. The exterior has a porch that invites relaxation, while the rear yard offers a private outdoor space for gatherings or gardening, increasing the property's allure. The home is close in proximity to local amenities and shopping ensures high demand for rental opportunities. Don't miss the chance to invest in a property that combines comfort, charm, and potential returns.
-
2026-04-09$109,900 Active 988-char remark
Show marketing remark (988 chars)
Discover an exceptional investment opportunity in the heart of Lucille Park! This charming 4-bedroom, 3-bathroom townhouse, built in 1920, seamlessly blends historic character with modern functionality. The Federal architectural style, complemented by a classic brick façade, offers timeless appeal that attracts discerning buyers or investors. Venture inside to discover laminated plank and ceramic tile flooring that enhances the home's warmth. The interior features include convenient basement bedroom and a second kitchen, perfect for multi-generational living or as an additional income-generating space. The exterior has a porch that invites relaxation, while the rear yard offers a private outdoor space for gatherings or gardening, increasing the property's allure. The home is close in proximity to local amenities and shopping ensures high demand for rental opportunities. Don't miss the chance to invest in a property that combines comfort, charm, and potential returns.
-
2026-01-20historical
-
2025-12-09price $99,000
-
2025-11-07price $120,000
-
2025-10-24$150,000 Active
-
2025-10-16historical
-
2025-08-31$195,000 Active
-
2024-04-30soldstatus $60,000
-
2017-01-26historical
-
2017-01-26historical Withdrawn
-
2017-01-09status Active
-
2017-01-09historical Withdrawn
-
2016-12-20Active
-
2016-12-20$15,000
-
2016-05-27soldstatus $210,000
-
1984-02-02soldstatus $14,000
ⓘ Source: listings_history table (triggers on properties + properties_extension) + one-shot
backfill from property_details.listing_events for pre-trigger history.
Tax reassessment forecast MD · Partial reset (capped growth)
- Current annual tax
- $3,058 · $255/mo
- Projected year-2 tax
- $3,058 · $255/mo
- Expected delta
- $0/yr ($0/mo · 0.0%)
ⓘ Screening estimate from a state-policy table — verify with the county assessor before closing.
Climate risk First Street
- Flood 6/10 Major FEMA zone X (unshaded) · 73% chance over 30 yrs
- Wildfire 1/10 Low
- Heat 7/10 Severe 7 d/yr ≥104°F today · 15 d/yr by 30 yrs out
- Wind 5/10 Major 26% chance of damaging wind over 30 yrs
- Air quality 3/10 Moderate 3 unhealthy d/yr today · 4 by 30 yrs out
Nearby sold comps map
Loading sold comps map…
Walkable amenities ~0.75 mi
Loading nearby amenities…
Taxation est. · year 1
- Rental income
- $23,635
- − Mortgage interest
- −$4,756
- − Property taxes
- −$3,058
- − Insurance
- −$424
- − Repairs & maintenance
- −$1,891
- − Management
- −$1,891
- − Depreciation
- −$2,470
- Taxable income
- $9,145
- Est. tax owed @ 24.0%
- −$2,195
- After-tax cash flow
- $7,651/yr
For passive investors: Depreciation is non-cash, so a rental often shows a tax loss while cash-flowing — sheltering income. Rental losses are passive: they offset passive income freely, and up to $25,000/yr can offset ordinary (W-2) income if you actively participate and your MAGI is under $100k (phasing out to $0 by $150k); unused losses carry forward. On sale, claimed depreciation is recaptured at up to 25%, and gains may owe capital-gains tax (a 1031 exchange can defer both). Figures are a year-1 estimate at your 24.0% rate — not tax advice; consult a CPA.
Schools (NCES district)
- District
- Baltimore City Public Schools
- NCES district ID
- 2400090
- Math proficiency
- 7% ▼ -9.00%
- Reading proficiency
- 16% ▼ -5.00%
- Median HH income
- $42,108
- Composite
- 10.08/100
- National rank
- #9805
- State rank
- #24 of 24 in MD
Livability — Baltimore
- Score
- 76/100
- State rank
- #90
- US rank
- #3396
Category grades
Schools grade is shown separately in the Schools card above.
Census & demographics
- Census place
- Baltimore, MD
- County
- Baltimore City · 558,601 people
- City population
- 588,727
- Metro
- Baltimore-Columbia-Towson, MD
- Population (ZIP)
- 52,229
- Household income
- $51,587
- Rent vs Own
- Severe rent burden
- 3644.0
Population outlook (Baltimore County) Hauer SSP2
- Today (2025)
- 624,249 people
- By 2030
- 621,541 · -0.4%
- By 2040
- 609,756 · -2.3%
- By 2050
- 597,249 · -4.3%
- By 2075
- 552,236 · -11.5%
- By 2100
- 513,934 · -17.7%
Race, ethnicity, and origin ACS 2023
- Neighborhood character
- Predominantly Black (73%)
- Race & ethnicity
- Black 73% White 17% Hispanic / Latino 5% Two or more races 4% Asian 1%
- Common ancestry
- Scotch-Irish 2% Romanian 2% Italian 1%
- Foreign-born
- 9% · Canada, South Korea
- Languages at home
- 91% English-only · Spanish 4% French/Haitian/Cajun 1% Other Indo-European 1%
Political lean MEDSL · Baltimore
- 2024 margin
- Solid D (+73.0) · D 85.2% · R 12.2% · Other 2.6%
- 2008→2024 swing
- -2.5pp toward R · 2008: 75.5pp · 2024: 73.0pp
- All cycles
- 2024: D+73.0 2020: D+76.6 2016: D+74.6 2012: D+76.4 2008: D+75.5
Not yet ingested
- Civics
- —
Market trends
- HPI YoY
- ▼ -318.58%
- Current HPI
- 291.4926
- Rent YoY
- ▲ 2.41%
- Metro
- Baltimore-Columbia-Towson, MD
- State GDP YoY
- ▲ 2.97%
- F500 in state
- 12
Industry mix (Fortune 500 HQ in MD)
| Industry | F500 HQs | Revenue |
|---|---|---|
| Aerospace / Defense | 1 | $71B |
|
||
| Utilities | 1 | $25B |
|
||
| Hotels | 1 | $24B |
|
||
| Consumer Goods | 1 | $7B |
|
||
| Real Estate | 1 | $6B |
|
||
| Chemicals | 1 | $2B |
|
||
Price history
+613.6% since first listed17 events — show timeline
- 2026-05-09 Price Changed $99,900 BRIGHT MLS
- 2026-04-09 Listed $109,900 BRIGHT MLS
- 2026-01-20 Listing Removed — BRIGHT MLS
- 2025-12-09 Price Changed $99,000 BRIGHT MLS
- 2025-11-07 Price Changed $120,000 BRIGHT MLS
- 2025-10-24 Listed $150,000 BRIGHT MLS
- 2025-10-16 Listing Removed — BRIGHT MLS
- 2025-08-31 Listed $195,000 BRIGHT MLS
- 2024-04-30 Sold (Public Records) $60,000 Public Records
- 2017-01-26 Delisted — MRIS
- 2017-01-26 Listing Removed — BRIGHT MLS
- 2017-01-09 Relisted — MRIS
- 2017-01-09 Delisted — MRIS
- 2016-12-20 Listed — MRIS
- 2016-12-20 Listed $15,000 BRIGHT MLS
- 2016-05-27 Sold (Public Records) $210,000 Public Records
- 1984-02-02 Sold (Public Records) $14,000 Public Records
Property tax history
+22.7%/yrLatest (2025): $3,058 · +21.2% YoY. Source: county tax records.
Cash-flow waterfall
monthlySold comps — $/sqft
last 12 mo · ≤1 miLoading sold comps…