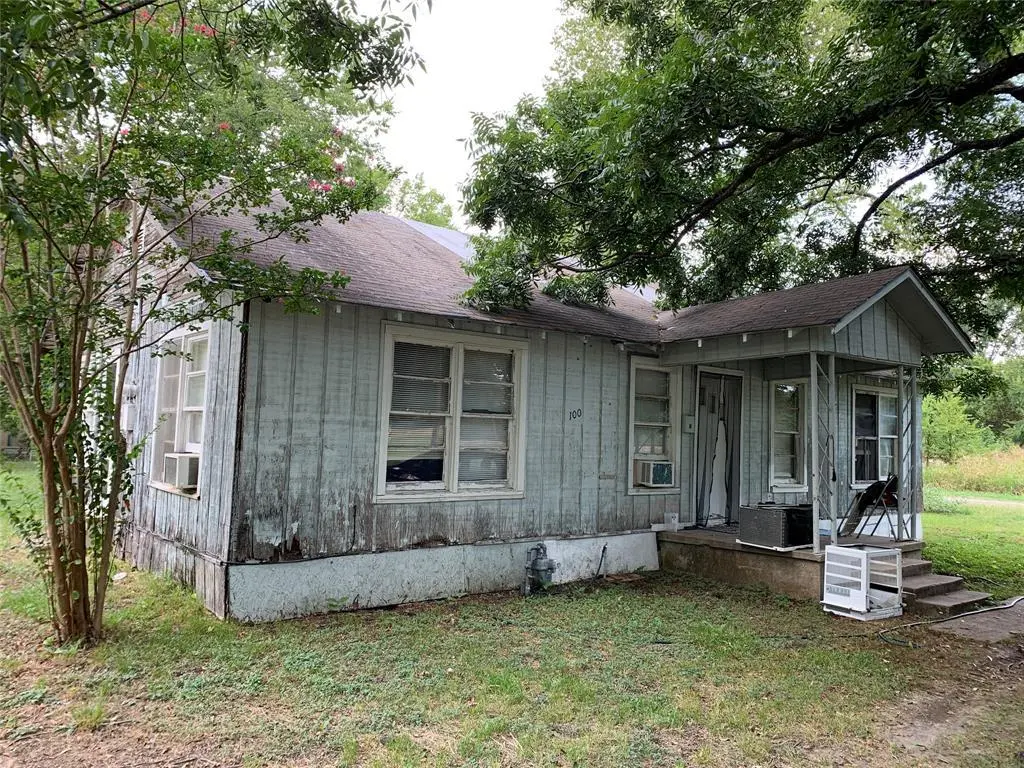
100 S Wright Ave · Kerens, TX
Flood risk 1/10 · Minimal
- FEMA flood zone
- X (unshaded)
- Chance of flooding over 30 yrs
- 0.0%
- Est. flood insurance / yr
- $507 – $1,088
Fire risk 5/10 · Moderate
- Est. fire insurance / yr
- $1,222 – $2,270
Heat risk 7/10 · Major
- Hot days now (above 109°F)
- 7 days/yr
- Hot days in 30 yrs
- 25 days/yr
Wind risk 6/10 · Moderate
- Chance of severe wind over 30 yrs
- 60.0%
Air-quality risk 2/10 · Minimal
- Unhealthy air days now
- 0 days/yr
- Unhealthy air days in 30 yrs
- 1 days/yr
Risk factors via First Street. Map © Google.
Why this score? — see what drove the B+ grade
The composite is a weighted blend of 9 inputs, each scored 0–100. Each bar is that input's sub-score; the figure is the points it added to the 100-point composite (weight × sub-score).
- Cash flow +30.0/30.0
- 1% rule +10.0/10.0
- DSCR +10.0/10.0
- Appreciation +7.8/10.0
- ARV discount +7.5/15.0
- Livability +3.2/5.0
- Schools +3.1/10.0
- Rent growth +2.5/5.0
- Condition / age +2.5/5.0
$57,500
🖨 Deal sheet 📄 Offer letter ✓ Due diligence
Listing remarks MLS
Handyman special with endless potential! Discover this cozy 1,126 sq. ft. home right in the heart of Kerens. Bursting with charm, this property offers a functional, flowing floorplan with generously sized bedrooms and a spacious kitchen—perfect for comfortable living. Whether you’re seeking a rental, investment opportunity, or a downsizing option, this home checks the boxes. Situated on a .21-acre lot, there’s ample outdoor space for gardening, entertaining, or simply relaxing. With a little TLC, this property can truly shine!
Key facts
- Spacious kitchen
- Outdoor space
- 21 acre lot
Tags
Neighborhood map
What this means for you Summary
Snapshot
- This is a 3-bed/1.0-bath single-family listed at $58k.
Deal economics
- At list price, monthly cash flow is $466 ($6k/yr) — positive.
- The deal already cash-flows at list — no discount required.
- Meets the 1% rule at list price ($1k rent vs $58k).
- Recommended offer: $51k (12.0% below list) — sets the bar for market timing.
- Cap rate 16.0% vs local median 1.6% in Kerens — top-decile yield for the area; either an underpriced asset or a hidden risk that comps aren't pricing in. Stress-test before assuming the spread holds.
Location & tenants
- Location reads 63/100 on livability (#866 in TX) — a middle-class / working-renter tenant base. Strengths: crime A+, cost of living A+, housing A+; Watch: schools D-, amenities F, commute F.
- Kerens ISD (rural): math 37% / reading 37% proficiency, ranked #495 of 826 in TX (top 60%) — families likely to look elsewhere, expect single-tenant / working-renter base with shorter leases; 68% free/reduced lunch — lower-income household profile, screen leases tightly.
- Market conditions: 179 active listings in the ZIP; 522 units permitted in Navarro County in 2024 (0 in 5+ unit buildings).
Forward outlook
- In year one you build about $4k of equity ($398 loan paydown + $3k appreciation (5.6% local appreciation)).
- Navarro County population projected to shrink 4% by 2050 — rents likely to lag national; underwrite the cash flow, not the appreciation.
- At projected returns (5.6% appreciation + 3.0% rent growth), your $16k cash investment doubles in ~2 years — after that, you're playing with house money.
- By year 9, paydown + projected appreciation supports a ~$32k cash-out refi (75% LTV) — recoverable capital for the next deal without selling this one.
Negotiation context
- It's been on market 310 days — a 12% lower offer ($51k) is reasonable based on typical stale-listing flexibility.
- 2 sale attempts with the ask held roughly flat each time — persistent listings suggest the price (not the market) is what's stuck; bring a comps-based counter.
Risks & watch-outs
- Watch-outs: built in 1940 — expect roof / HVAC / electrical / plumbing capex.
- Climate carrying-cost: major wind risk, 60% chance of damaging wind over 30y; moderate wildfire risk; extreme-heat days projected 7→25/yr by 2055 (HVAC capex compounding) — expect insurance premiums to compound above CPI over the hold.
Questions for the listing agent
- It's been on market 310 days. Have you received any prior offers? Is the seller open to a 12% concession, seller financing, or rate buy-down credit?
- Built in 1940 — when were the roof, HVAC, electrical panel, plumbing, and water heater last replaced?
- Why hasn't it sold? Are there any deal-killer items the seller is aware of (foundation, flood, title, zoning, code violations)?
- Is there a deadline driving the sale (1031 exchange, divorce, estate, relocation)? That informs how much negotiation room exists.
- Schools are D-rated, which usually means shorter tenancies and higher turnover. Who's the typical renter profile here, and what's been the actual vacancy rate?
- What's the average days-on-market for RENTAL listings here right now (not sales)? A rising rental-DOM trend means longer vacancies and softer asking-rent achievability than the comps imply.
- What's the recent tenant-quality profile in this submarket — average credit score on applications, eviction rate, late-payment / NSF rate, and stable-employment percentage? A property-management company in the area should have these aggregated.
- How much new for-sale + rental construction is in the pipeline within 1–3 miles? Heavy new supply typically softens prices + rents 12–24 months out; constrained supply supports both.
Investment metrics
- 1% rule
- 1.96% ✓
- Cap rate
- 16.02%
- Cash-on-cash
- 34.75%
- DSCR
- 2.55
- GRM
- 4.2
CMA / ARV
- ARV (median comp)
- $152,315
- List price
- $57,500
- Delta
- -62.25%
- Verdict
- UNDERPRICED
- Comps
- 20 within 1.0 mi
Show comp detail 7 sales within ~0.75 mi
| Address | Dist | Beds/Ba | Sqft | Sold | Price | $/sf | Match |
|---|---|---|---|---|---|---|---|
| 504 NW 4th St | 0.25mi | 3/2.0 | 1,270 (+8%) | 7mo | $184,900 | $146 | 66 |
| 604 Donna Cir | 0.44mi | 2/1.0 (-1) | 1,155 (-2%) | 10mo | $179,000 | $155 | 63 |
| 304 S Humphrey Ave | 0.34mi | 2/1.0 (-1) | 1,135 (-4%) | 12mo | $175,000 | $154 | 63 |
| 104 N Sinclair Ave | 0.54mi | 3/2.0 | 1,216 (+3%) | 5mo | $130,000 | $107 | 61 |
| 110 S Alma Ave | 0.09mi | 4/1.0 (+1) | 1,023 (-13%) | 12mo | $139,999 | $137 | 60 |
| 408 S Throckmorton Ave | 0.35mi | 2/1.0 (-1) | 1,283 (+9%) | 6mo | $150,000 | $117 | 59 |
| 316 N Overlook Dr | 0.31mi | 3/2.0 | 1,279 (+9%) | 21mo | $129,000 | $101 | 50 |
Match score weights: distance 35% · size 25% · config 20% · recency 20%. Top-matched comps best support the ARV.
Projected returns pro-forma
5.61% appreciation · 3.0% rent growth · sell at horizon
- IRR
- 44.5%
- Equity multiple
- 3.80×
- Total profit
- $45,004
- Equity at exit
- $34,737
- IRR
- 41.8%
- Equity multiple
- 7.81×
- Total profit
- $109,577
- Equity at exit
- $61,811
Cash invested: $16,100 (down + closing). Projections, not guarantees.
Landlord ↔ Tenant lean methodology
- Overall (STATE)
- 87 Strongly Landlord-Friendly
- State Texas
- 87 Strongly Landlord-Friendly · R+5
- County
- — inherits STATE
- City
- — inherits STATE
ZIP-level market 75144
- Home prices YoY
- 2.4%
- Active inventory
- 179
- Price-to-rent
- 4.2×
Monthly cashflow live
- Estimated rent
- $1,129 medium interval (Pro) →
- Mortgage (P&I)
- −$302
- Tax from tax record
- −$100 /mo · $1,204/yr
- Insurance
- −$24
- HOA
- −$0
- Vacancy / Maint / Mgmt
- −$237
- Net cashflow
- $466
Break-even live
UW: 25.0% down · 7.5% · 30yr · 1.5% tax · 5.0% vac · 8.0% maint · 8.0% mgmt
Financing live
Cash to close
- Down payment
- $14,375
- Closing costs
- $1,725
- Reserves months
- —
- Total cash needed
- —
Loan-product check · same deal, 3 products live
Conventional
25% down · 7.5% · 30yr
- Down + closing
- —
- Monthly P&I
- —
- Monthly cashflow
- —
- DSCR
- —
- Eligible?
- —
Personal DTI + credit; lowest rate.
DSCR
20% down · 8.5% · 30yr
- Down + closing
- —
- Monthly P&I
- —
- Monthly cashflow
- —
- DSCR
- —
- Eligible?
- —
No personal income docs; deal must DSCR.
Hard money
10% down · 12.0% · 12mo
- Down + closing
- —
- Monthly P&I
- —
- Monthly cashflow
- —
- DSCR
- —
- Eligible?
- —
Short-term bridge; refi at stabilization.
Listing history 21 events
-
2026-06-18days on market $57,500 Active 310 DOM
-
2026-06-17days on market $57,500 Active 309 DOM
-
2026-06-16days on market $57,500 Active 308 DOM
-
2026-06-15days on market $57,500 Active 307 DOM
-
2026-06-13days on market $57,500 Active 305 DOM
-
2026-06-12days on market $57,500 Active 304 DOM
-
2026-06-10days on market $57,500 Active 301 DOM
-
2026-06-08days on market $57,500 Active 300 DOM
-
2026-06-08days on market $57,500 Active 299 DOM
-
2026-06-07days on market $57,500 Active 298 DOM
-
2026-06-03days on market $57,500 Active 295 DOM
-
2026-06-02days on market $57,500 Active 294 DOM
-
2026-06-01days on market $57,500 Active 293 DOM
-
2026-05-31days on market $57,500 Active 292 DOM
-
2026-03-19price $57,500 550-char remark
Show marketing remark (550 chars)
Handyman special with endless potential! Discover this cozy 1,126 sq. ft. home right in the heart of Kerens. Bursting with charm, this property offers a functional, flowing floorplan with generously sized bedrooms and a spacious kitchen—perfect for comfortable living. Whether you’re seeking a rental, investment opportunity, or a downsizing option, this home checks the boxes. Situated on a .21-acre lot, there’s ample outdoor space for gardening, entertaining, or simply relaxing. With a little TLC, this property can truly shine!
-
2026-03-18price $57,500 539-char remark
Show marketing remark (539 chars)
Handyman special with endless potential! Discover this cozy 1,126 sq. ft. home right in the heart of Kerens. Bursting with charm, this property offers a functional, flowing floorplan with generously sized bedrooms and a spacious kitchen—perfect for comfortable living. Whether you're seeking a rental, investment opportunity, or a downsizing option, this home checks the boxes. Situated on a . 21-acre lot, there's ample outdoor space for gardening, entertaining, or simply relaxing. With a little TLC, this property can truly shine!
-
2025-08-12$60,000 Active 550-char remark
Show marketing remark (539 chars)
Handyman special with endless potential! Discover this cozy 1,126 sq. ft. home right in the heart of Kerens. Bursting with charm, this property offers a functional, flowing floorplan with generously sized bedrooms and a spacious kitchen—perfect for comfortable living. Whether you're seeking a rental, investment opportunity, or a downsizing option, this home checks the boxes. Situated on a . 21-acre lot, there's ample outdoor space for gardening, entertaining, or simply relaxing. With a little TLC, this property can truly shine!
-
2025-08-12$60,000 Active 539-char remark
Show marketing remark (539 chars)
Handyman special with endless potential! Discover this cozy 1,126 sq. ft. home right in the heart of Kerens. Bursting with charm, this property offers a functional, flowing floorplan with generously sized bedrooms and a spacious kitchen—perfect for comfortable living. Whether you're seeking a rental, investment opportunity, or a downsizing option, this home checks the boxes. Situated on a . 21-acre lot, there's ample outdoor space for gardening, entertaining, or simply relaxing. With a little TLC, this property can truly shine!
-
2000-02-01soldstatus
-
2000-01-06soldstatus
-
1993-10-11soldstatus
ⓘ Source: listings_history table (triggers on properties + properties_extension) + one-shot
backfill from property_details.listing_events for pre-trigger history.
Tax reassessment forecast TX · Resets to sale price
- Current annual tax
- $1,204 · $100/mo
- Projected year-2 tax
- $1,204 · $100/mo
- Expected delta
- $0/yr ($0/mo · 0.0%)
ⓘ Screening estimate from a state-policy table — verify with the county assessor before closing.
Climate risk First Street
- Flood 1/10 Low FEMA zone X (unshaded) · 0% chance over 30 yrs
- Wildfire 5/10 Major
- Heat 7/10 Severe 7 d/yr ≥109°F today · 25 d/yr by 30 yrs out
- Wind 6/10 Major 60% chance of damaging wind over 30 yrs
- Air quality 2/10 Low 0 unhealthy d/yr today · 1 by 30 yrs out
Nearby sold comps map
Loading sold comps map…
Walkable amenities ~0.75 mi
Loading nearby amenities…
Taxation est. · year 1
- Rental income
- $13,549
- − Mortgage interest
- −$3,221
- − Property taxes
- −$1,204
- − Insurance
- −$288
- − Repairs & maintenance
- −$1,084
- − Management
- −$1,084
- − Depreciation
- −$1,673
- Taxable income
- $4,997
- Est. tax owed @ 24.0%
- −$1,199
- After-tax cash flow
- $4,395/yr
For passive investors: Depreciation is non-cash, so a rental often shows a tax loss while cash-flowing — sheltering income. Rental losses are passive: they offset passive income freely, and up to $25,000/yr can offset ordinary (W-2) income if you actively participate and your MAGI is under $100k (phasing out to $0 by $150k); unused losses carry forward. On sale, claimed depreciation is recaptured at up to 25%, and gains may owe capital-gains tax (a 1031 exchange can defer both). Figures are a year-1 estimate at your 24.0% rate — not tax advice; consult a CPA.
Schools (NCES district)
- District
- Kerens ISD
- NCES district ID
- 4825530
- Math proficiency
- 37% ▼ -9.00%
- Reading proficiency
- 37% ▲ 3.00%
- Median HH income
- $37,364
- Composite
- 30.81/100
- National rank
- #6142
- State rank
- #495 of 826 in TX
Livability — Kerens
- Score
- 63/100
- State rank
- #866
- US rank
- #15598
Category grades
Schools grade is shown separately in the Schools card above.
Census & demographics
- Census place
- Kerens, TX
- Population (ZIP)
- 3,798
Population outlook (Navarro County) Hauer SSP2
- Today (2025)
- 48,397 people
- By 2030
- 48,096 · -0.6%
- By 2040
- 47,394 · -2.1%
- By 2050
- 46,541 · -3.8%
- By 2075
- 44,940 · -7.1%
- By 2100
- 42,288 · -12.6%
Race, ethnicity, and origin ACS 2023
- Neighborhood character
- Majority White (64%)
- Race & ethnicity
- White 64% Black 18% Hispanic / Latino 12% Two or more races 8%
- Hispanic origin (detail)
- Mexican 9%
- Common ancestry
- Lithuanian 3% Serbian 1% Italian 1%
- Foreign-born
- 5% · Canada
- Languages at home
- 92% English-only · Spanish 8%
Political lean MEDSL · Navarro
- 2024 margin
- Solid R (+51.8) · D 23.7% · R 75.6%
- 2008→2024 swing
- -18.7pp toward R · 2008: -33.1pp · 2024: -51.8pp
- All cycles
- 2024: R+51.8 2020: R+45.5 2016: R+48.8 2012: R+42.4 2008: R+33.1
Not yet ingested
- Civics
- —
Market trends
- HPI YoY
- ▲ 5.61%
- Current HPI
- 236.2915
- Rent YoY
- —
- Metro
- —
- State GDP YoY
- ▲ 3.95%
- F500 in state
- 110
Industry mix (Fortune 500 HQ in TX)
| Industry | F500 HQs | Revenue |
|---|---|---|
| Energy | 16 | $1,198B |
|
||
| Technology | 5 | $198B |
|
||
| Engineering / Construction | 4 | $72B |
|
||
| Energy Services | 3 | $60B |
|
||
| Utilities | 3 | $41B |
|
||
| Healthcare | 2 | $330B |
|
||
Price history
-4.2% since first listed7 events — show timeline
- 2026-03-19 Price Changed $57,500 NTREIS
- 2026-03-18 Price Changed $57,500 HCBOR
- 2025-08-12 Listed $60,000 HCBOR
- 2025-08-12 Listed $60,000 NTREIS
- 2000-02-01 Sold (Public Records) — Public Records
- 2000-01-06 Sold (Public Records) — Public Records
- 1993-10-11 Sold (Public Records) — Public Records
Property tax history
+5.4%/yrLatest (2025): $1,204 · -33.3% YoY. Source: county tax records.
Cash-flow waterfall
monthlySold comps — $/sqft
last 12 mo · ≤1 miLoading sold comps…