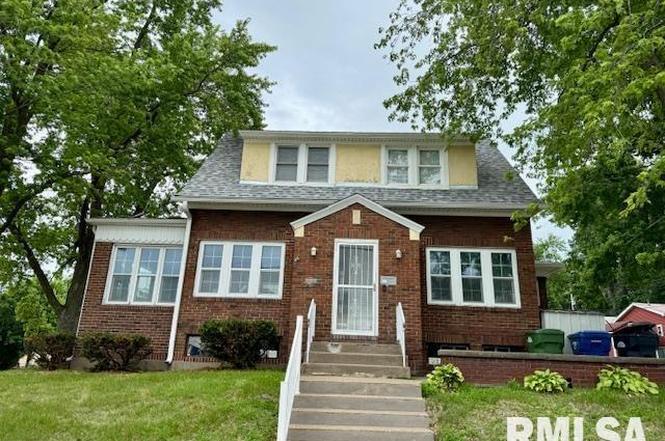
765 9th Ave S · Clinton, IA
Flood risk 1/10 · Minimal
- FEMA flood zone
- X (unshaded)
- Chance of flooding over 30 yrs
- 0.0%
- Est. flood insurance / yr
- $473 – $860
Fire risk 1/10 · Minimal
- Est. fire insurance / yr
- $902 – $1,676
Heat risk 3/10 · Minor
- Hot days now (above 103°F)
- 7 days/yr
- Hot days in 30 yrs
- 16 days/yr
Wind risk 2/10 · Minimal
- Chance of severe wind over 30 yrs
- —
Air-quality risk 3/10 · Minor
- Unhealthy air days now
- 2 days/yr
- Unhealthy air days in 30 yrs
- 3 days/yr
Risk factors via First Street. Map © Google.
Why this score? — see what drove the C grade
The composite is a weighted blend of 9 inputs, each scored 0–100. Each bar is that input's sub-score; the figure is the points it added to the 100-point composite (weight × sub-score).
- Cash flow +26.9/30.0
- DSCR +9.3/10.0
- 1% rule +7.1/10.0
- Schools +4.5/10.0
- Livability +3.8/5.0
- Rent growth +2.5/5.0
- Condition / age +2.5/5.0
- ARV discount +0.2/15.0
- Appreciation +0.0/10.0
$98,000
🖨 Deal sheet (PDF) 📄 Offer letter ✓ Due diligence
Listing remarks
This open floor plan home is so welcoming and homey! And the updates are crazy! There is a fresh coat of paint throughout, the kitchen was remodeled in 2018. That included new cabinets and new deep sink. All the appliances were new in 2018. New "top of the line" Carrier furnace and AC unit installed in 2018. The furnace offers a built-in humidifier AND air purifier. The pex plumbing was new in 2018. The walk-in shower was installed in 2021. All new LVP flooring throughout. The roof was new in 2025. There is a new retaining was that was installed in 2023. You need to see this beauty for yourself!! All the updates are done for you, just move right in!!
Key facts
- 6,534 sq ft lot
- Built 1918
Neighborhood map
What this means for you Summary
Snapshot
- This is a 2-bed/1.5-bath single-family listed at $98k.
Deal economics
- At list price, monthly cash flow is $272 ($3k/yr) — positive.
- The deal already cash-flows at list — no discount required.
- Meets the 1% rule at list price ($1k rent vs $98k).
- Cap rate 9.6% vs local median 6.7% in Clinton — top-decile yield for the area; either an underpriced asset or a hidden risk that comps aren't pricing in. Stress-test before assuming the spread holds.
Location & tenants
- Location reads 75/100 on livability (#222 in IA, #4,192 nationally) — a middle-class / working-renter tenant base. Strengths: cost of living A+, housing A+, health & safety A+; Watch: amenities C-, crime D, employment D.
- Clinton Community School District (town): math 52% / reading 56% proficiency, ranked #273 of 289 in IA (top 94%) — acceptable for families but not a draw, mixed tenant base, ~2y average lease.
- Zoned schools: Clinton Middle School (math 49% / reading 53%, grade C, #210 of 246 statewide, top 87%, 749 students, 59% FRL); Clinton High School (math 43% / reading 57%, grade D+, #313 of 336 statewide, top 93%, 981 students, 49% FRL) — zoned schools at 54% FRL track the district average.
- Market conditions: 246 active listings in the ZIP; 7 comparable units currently listed for rent nearby; rentals lingering (median 45d on market — plan ~5-8 weeks vacancy on turnover, expect pricing pressure); 100% of comp listings sitting > 30 days — soft ceiling on asking rent; 116 units permitted in Clinton County in 2024 (50 in 5+ unit buildings).
Forward outlook
- Local home prices are declining (-3.0%/yr); year-one equity from $678 of loan paydown is wiped out by about $3k of value loss. Plan a longer hold.
- Clinton County population projected at -19% by 2050 — secular population decline; favor cash flow + early exit over multi-decade hold.
- At projected returns (-3.0% appreciation + 3.0% rent growth), your $27k cash investment doubles in ~10 years — after that, you're playing with house money.
Negotiation context
- Only 0 days on market — expect competitive offers; lowballing is unlikely to land.
- 2 sale attempts with the ask held roughly flat each time — persistent listings suggest the price (not the market) is what's stuck; bring a comps-based counter.
Risks & watch-outs
- Watch-outs: built in 1918 — expect roof / HVAC / electrical / plumbing capex.
Questions for the listing agent
- Built in 1918 — when were the roof, HVAC, electrical panel, plumbing, and water heater last replaced?
- Is there a deadline driving the sale (1031 exchange, divorce, estate, relocation)? That informs how much negotiation room exists.
- Schools are B-rated — typically a magnet for longer-tenancy family renters. What's the average tenant stay here, and is there a school-zone premium baked into asking?
- Crime grade is D in this area — have there been break-ins, vandalism, or insurance claims at this property in the last 3 years? What carrier currently insures it and at what premium?
- What's the average days-on-market for RENTAL listings here right now (not sales)? A rising rental-DOM trend means longer vacancies and softer asking-rent achievability than the comps imply.
- What's the recent tenant-quality profile in this submarket — average credit score on applications, eviction rate, late-payment / NSF rate, and stable-employment percentage? A property-management company in the area should have these aggregated.
- How much new for-sale + rental construction is in the pipeline within 1–3 miles? Heavy new supply typically softens prices + rents 12–24 months out; constrained supply supports both.
Investment metrics
- 1% rule
- 1.21% ✓
- Cap rate
- 9.63%
- Cash-on-cash
- 11.90%
- DSCR
- 1.53
- GRM
- 6.9
CMA / ARV
- ARV (on-the-fly)
- $84,312
- Comps found
- 12
Show comp detail 12 sales within ~0.75 mi
| Address | Dist | Beds/Ba | Sqft | Sold | Price | $/sf | Match |
|---|---|---|---|---|---|---|---|
| 635 8th Ave S | 0.18mi | 2/1.0 | 1,210 (+3%) | 6mo | $36,525 | $30 | 79 |
| 1408 S 10th St | 0.47mi | 2/1.0 | 1,164 (-1%) | 1mo | $125,000 | $107 | 74 |
| 756 13th Ave S | 0.28mi | 3/1.5 (+1) | 1,219 (+4%) | 4mo | $50,500 | $41 | 72 |
| 1115 S 12th St | 0.55mi | 3/1.5 (+1) | 1,175 (+0%) | 2mo | $87,000 | $74 | 67 |
| 837 14th Ave S | 0.38mi | 2/1.0 | 1,098 (-6%) | 3mo | $79,500 | $72 | 67 |
| 740 15th Ave S | 0.40mi | 2/1.0 | 1,086 (-7%) | 2mo | $40,000 | $37 | 65 |
| 545 3rd Ave S | 0.57mi | 2/1.0 | 1,245 (+6%) | 2mo | $74,900 | $60 | 59 |
| 624 9th Ave S | 0.20mi | 3/3.0 (+1) | 1,016 (-13%) | 5mo | $37,500 | $37 | 54 |
| 113 N 6th St | 0.74mi | 3/1.0 (+1) | 1,142 (-2%) | 6mo | $48,000 | $42 | 49 |
| 1030 Grandview Dr | 0.40mi | 3/2.0 (+1) | 1,024 (-13%) | 6mo | $125,000 | $122 | 48 |
| 1316 Florence Ave | 0.75mi | 2/1.0 | 1,276 (+9%) | 4mo | $154,255 | $121 | 45 |
| 1324 Caroline Ave | 0.70mi | 3/1.0 (+1) | 1,298 (+11%) | 2mo | $185,000 | $143 | 40 |
Match score weights: distance 35% · size 25% · config 20% · recency 20%. Top-matched comps best support the ARV.
Projected returns pro-forma
-3.0% appreciation · 3.0% rent growth · sell at horizon
- IRR
- 1.4%
- Equity multiple
- 1.05×
- Total profit
- $1,464
- Equity at exit
- $14,612
- IRR
- 11.0%
- Equity multiple
- 1.86×
- Total profit
- $23,632
- Equity at exit
- $8,473
Cash invested: $27,440 (down + closing). Projections, not guarantees.
Landlord ↔ Tenant lean methodology
- Overall (STATE)
- 83 Strongly Landlord-Friendly
- State Iowa
- 83 Strongly Landlord-Friendly · R+6
- County
- — inherits STATE
- City
- — inherits STATE
ZIP-level market 52732
- Home prices YoY
- -34.9%
- Active inventory
- 246
- Price-to-rent
- 6.9×
Monthly cashflow live
- Estimated rent
- $1,183 high interval (Pro) →
- Mortgage (P&I)
- −$514
- Tax from tax record
- −$108 /mo · $1,290/yr
- Insurance
- −$41
- HOA
- −$0
- Vacancy / Maint / Mgmt
- −$248
- Net cashflow
- $272
Break-even live
Sensitivity live
| Price | -10% $328 | -5% $300 | +0% $272 | +5% $244 | +10% $217 |
|---|---|---|---|---|---|
| Rent | -10% $179 | -5% $225 | +0% $272 | +5% $319 | +10% $366 |
| Rate | -1.0pp $322 | -0.5pp $297 | base $272 | +0.5pp $247 | +1.0pp $221 |
UW: 25.0% down · 7.5% · 30yr · 1.5% tax · 5.0% vac · 8.0% maint · 8.0% mgmt
Financing live
Cash to close
- Down payment
- $24,500
- Closing costs
- $2,940
- Reserves months
- —
- Total cash needed
- —
Loan-product check · same deal, 3 products live
Conventional
25% down · 7.5% · 30yr
- Down + closing
- —
- Monthly P&I
- —
- Monthly cashflow
- —
- DSCR
- —
- Eligible?
- —
Personal DTI + credit; lowest rate.
DSCR
20% down · 8.5% · 30yr
- Down + closing
- —
- Monthly P&I
- —
- Monthly cashflow
- —
- DSCR
- —
- Eligible?
- —
No personal income docs; deal must DSCR.
Hard money
10% down · 12.0% · 12mo
- Down + closing
- —
- Monthly P&I
- —
- Monthly cashflow
- —
- DSCR
- —
- Eligible?
- —
Short-term bridge; refi at stabilization.
Rent comps 7 comps
| Address | Beds | Baths | Sqft | Rent | $/sqft | DOM | Units | Dist |
|---|---|---|---|---|---|---|---|---|
| 1004 S 4th St Clinton, IA | 3.0 | 2.5 | 1467 | $1,700 | $1.16 | 44d | 1 | 0.55mi |
| 1006 S 4th St Clinton, IA | 3.0 | 2.5 | 1467 | $1,700 | $1.16 | 44d | 1 | 0.55mi |
| 1002 S 4th St Clinton, IA | 3.0 | 2.5 | 1467 | $1,750 | $1.19 | 44d | 1 | 0.55mi |
| 416 7th Ave S Unit C Clinton, IA | 1.0 | 1.0 | 773 | $700 | $0.91 | 44d | 1 | 0.55mi |
| 1008 S 4th St Clinton, IA | 3.0 | 2.5 | 1467 | $1,750 | $1.19 | 44d | 1 | 0.56mi |
| 1216 9th Ave S Clinton, IA | 2.0 | 1.0 | 804 | $1,000 | $1.24 | 44d | 1 | 0.56mi |
| 516 2nd Ave S Unit 2 Clinton, IA | 2.0 | 1.0 | 1082 | $750 | $0.69 | 44d | 1 | 0.71mi |
Listing history 15 events
-
2026-05-24status Pending
-
2026-05-24status Pending
-
2026-05-22status Pending
-
2026-01-08status Pending
-
2026-01-05historical
-
2026-01-05soldstatus $102,500
-
2025-12-22soldstatus $102,500 Closed
-
2025-12-22soldstatus $102,500 Closed
-
2025-12-22soldstatus $102,500 Closed
-
2025-12-22soldstatus $102,500 Closed
-
2025-07-07status Pending
-
2025-07-06historical
-
2025-07-06historical
-
2025-07-03$98,000
-
2025-07-03Active
ⓘ Source: listings_history table (triggers on properties + properties_extension) + one-shot
backfill from property_details.listing_events for pre-trigger history.
Tax reassessment forecast IA · Partial reset (capped growth)
- Current annual tax
- $1,290 · $108/mo
- Projected year-2 tax
- $1,414 · $118/mo
- Expected delta
- +$124/yr (+$10/mo · 9.6%)
ⓘ Screening estimate from a state-policy table — verify with the county assessor before closing.
Climate risk First Street
- Flood 1/10 Low FEMA zone X (unshaded) · 0% chance over 30 yrs
- Wildfire 1/10 Low
- Heat 3/10 Moderate 7 d/yr ≥103°F today · 16 d/yr by 30 yrs out
- Wind 2/10 Low
- Air quality 3/10 Moderate 2 unhealthy d/yr today · 3 by 30 yrs out
Nearby sold comps map
Loading sold comps map…
Walkable amenities ~0.75 mi
Loading nearby amenities…
Taxation est. · year 1
- Rental income
- $14,194
- − Mortgage interest
- −$5,490
- − Property taxes
- −$1,290
- − Insurance
- −$490
- − Repairs & maintenance
- −$1,136
- − Management
- −$1,136
- − Depreciation
- −$2,851
- Taxable income
- $1,802
- Est. tax owed @ 24.0%
- −$433
- After-tax cash flow
- $2,834/yr
For passive investors: Depreciation is non-cash, so a rental often shows a tax loss while cash-flowing — sheltering income. Rental losses are passive: they offset passive income freely, and up to $25,000/yr can offset ordinary (W-2) income if you actively participate and your MAGI is under $100k (phasing out to $0 by $150k); unused losses carry forward. On sale, claimed depreciation is recaptured at up to 25%, and gains may owe capital-gains tax (a 1031 exchange can defer both). Figures are a year-1 estimate at your 24.0% rate — not tax advice; consult a CPA.
Schools (NCES district)
- District
- Clinton Community School District
- NCES district ID
- 1907710
- Math proficiency
- 52% ▼ -13.00%
- Reading proficiency
- 56% ▼ -8.00%
- Median HH income
- $40,900
- Composite
- 45.22/100
- National rank
- #2666
- State rank
- #273 of 289 in IA
Livability — Clinton
- Score
- 75/100
- State rank
- #222
- US rank
- #4192
Category grades
Schools grade is shown separately in the Schools card above.
Census & demographics
- Census place
- Clinton, IA
- County
- Clinton County · 25,880 people
- City population
- 25,880
- Metro
- Clinton, IA
- Population (ZIP)
- 25,880
- Household income
- $61,105
- Rent vs Own
- Severe rent burden
- 889.0
Population outlook (Clinton County) Hauer SSP2
- Today (2025)
- 44,817 people
- By 2030
- 43,090 · -3.9%
- By 2040
- 39,513 · -11.8%
- By 2050
- 36,209 · -19.2%
- By 2075
- 31,888 · -28.8%
- By 2100
- 30,382 · -32.2%
Race, ethnicity, and origin ACS 2023
- Neighborhood character
- Predominantly White (86%)
- Race & ethnicity
- White 86% Two or more races 7% Hispanic / Latino 5% Black 4%
- Common ancestry
- Iranian 4% Portuguese 2% Lithuanian 2%
- Foreign-born
- 2% · Canada
- Languages at home
- 97% English-only · Spanish 2% Arabic 1%
Political lean MEDSL · Clinton
- 2024 margin
- R (+18.9) · D 39.8% · R 58.6% · Other 1.6%
- 2008→2024 swing
- -41.9pp toward R · 2008: 23.0pp · 2024: -18.9pp
- All cycles
- 2024: R+18.9 2020: R+10.3 2016: R+5.1 2012: D+22.9 2008: D+23.0
Not yet ingested
- Civics
- —
Market trends
- HPI YoY
- ▼ -83.23%
- Current HPI
- 155.3426
- Rent YoY
- —
- Metro
- Clinton, IA
- State GDP YoY
- ▲ 2.48%
- F500 in state
- 4
Industry mix (Fortune 500 HQ in IA)
| Industry | F500 HQs | Revenue |
|---|---|---|
| Financial Services | 1 | $16B |
|
||
| Retail / Convenience | 1 | $15B |
|
||
Price history
+4.6% since first listed15 events — show timeline
- 2026-05-24 Pending — MRED as Distributed by MLS Grid
- 2026-05-24 Pending — MRED as Distributed by MLS Grid
- 2026-05-22 Pending — MRED as Distributed by MLS Grid
- 2026-01-08 Pending — MRED as Distributed by MLS Grid
- 2026-01-05 Listing Removed — MRED as Distributed by MLS Grid
- 2026-01-05 Sold (Public Records) $102,500 Public Records
- 2025-12-22 Sold (MLS) $102,500 MRED as Distributed by MLS Grid
- 2025-12-22 Sold (MLS) $102,500 MRED as Distributed by MLS Grid
- 2025-12-22 Sold (MLS) $102,500 MRED as Distributed by MLS Grid
- 2025-12-22 Sold (MLS) $102,500 MRED as Distributed by MLS Grid
- 2025-07-07 Pending — RMLSA as Distributed by MLS Grid
- 2025-07-06 Listing Removed — RMLSA as Distributed by MLS Grid
- 2025-07-06 Listing Removed — MRED as Distributed by MLS Grid
- 2025-07-03 Listed — RMLSA as Distributed by MLS Grid
- 2025-07-03 Listed $98,000 MRED as Distributed by MLS Grid
Property tax history
-0.7%/yrLatest (2025): $1,290 · +1.7% YoY. Source: county tax records.
Cash-flow waterfall
monthlySold comps — $/sqft
last 12 mo · ≤1 miLoading sold comps…