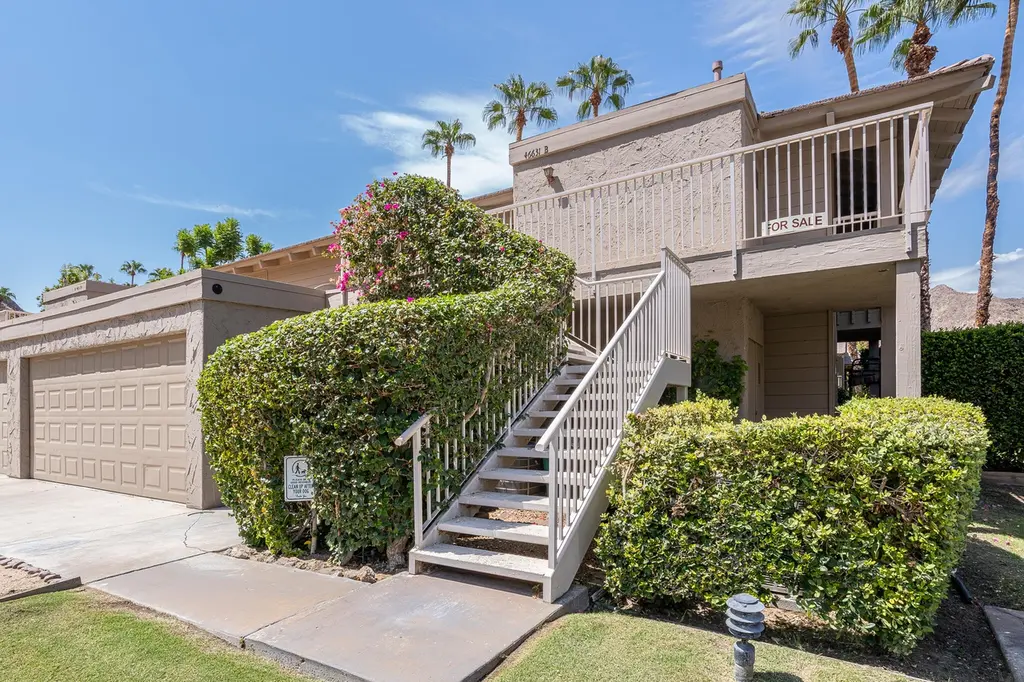
46631 Arapahoe Ln Unit B · Indian Wells, CA
Flood risk 1/10 · Minimal
- FEMA flood zone
- X (unshaded)
- Chance of flooding over 30 yrs
- 0.0%
- Est. flood insurance / yr
- $507 – $1,088
Fire risk 5/10 · Moderate
- Est. fire insurance / yr
- $659 – $1,223
Heat risk 9/10 · Severe
- Hot days now (above 114°F)
- 7 days/yr
- Hot days in 30 yrs
- 17 days/yr
Wind risk 1/10 · Minimal
- Chance of severe wind over 30 yrs
- —
Air-quality risk 4/10 · Minor
- Unhealthy air days now
- 4 days/yr
- Unhealthy air days in 30 yrs
- 5 days/yr
Risk factors via First Street. Map © Google.
Why this score? — see what drove the B grade
The composite is a weighted blend of 9 inputs, each scored 0–100. Each bar is that input's sub-score; the figure is the points it added to the 100-point composite (weight × sub-score).
- Cash flow +27.1/30.0
- DSCR +9.4/10.0
- 1% rule +9.3/10.0
- ARV discount +7.5/15.0
- Appreciation +6.9/10.0
- Schools +3.8/10.0
- Livability +2.7/5.0
- Rent growth +2.5/5.0
- Condition / age +2.5/5.0
$385,000
🖨 Deal sheet (PDF) 📄 Offer letter ✓ Due diligence
Listing remarks MLS
Step into resort-style living in this sophisticated 2-bedroom, 2-bath condo within the gated Mountain Cove community. Enjoy an open floor plan with vaulted ceilings and three private balconies that seamlessly blend indoor-outdoor living. Savor breathtaking southwest-facing mountain and sunset views from the main living room, primary bedroom, and balconies. Partially furnished for your ease, this home is primed for entertaining and relaxation. The primary suite is a luxurious retreat with a walk-in closet, updated bath with dual vanity and custom-tiled shower, and a private balcony overlooking the pool and mountains. A guest suite with its own bath ensures comfort for visitors, with both bathrooms elegantly renovated. Enjoy exclusive Indian Wells resident discounts on golf, dining, and local amenities, just minutes from world-class tennis, golf, shopping, and dining. With a 30-day minimum rental policy, this condo offers flexibility for part-time residence and rental income potential.
Key facts
- Custom-tiled shower
- $657 HOA
- Garage
Tags
Neighborhood map
What this means for you Summary
Snapshot
- This is a 2-bed/2.0-bath condo listed at $385k.
Deal economics
- At list price, monthly cash flow is $1k ($13k/yr) — positive.
- The deal already cash-flows at list — no discount required.
- Meets the 1% rule at list price ($5k rent vs $385k).
- Recommended offer: $350k (9.0% below list) — sets the bar for market timing.
- Cap rate 9.7% vs local median 1.5% in Indian Wells — top-decile yield for the area; either an underpriced asset or a hidden risk that comps aren't pricing in. Stress-test before assuming the spread holds.
Location & tenants
- Location reads 53/100 on livability (#968 in CA) — a working-class tenant base; expect higher turnover. Strengths: employment A+, crime B+; Watch: amenities F, commute F, cost of living F.
- Desert Sands Unified (suburban): math 31% / reading 56% proficiency, ranked #199 of 517 in CA (top 38%) — families likely to look elsewhere, expect single-tenant / working-renter base with shorter leases.
- Zoned schools: Gerald R. Ford Elementary (math 24% / reading 24%, grade F, #973 of 1,571 statewide, top 73%, 603 students, 59% FRL); La Quinta Middle (math 24% / reading 24%, grade F, #277 of 498 statewide, top 73%, 754 students, 83% FRL); Palm Desert High (math 42% / reading 67%, grade C-, #256 of 1,170 statewide, top 24%, 2,050 students, 57% FRL).
- Market conditions: 151 active listings in the ZIP; 40 comparable units currently listed for rent nearby; rentals lingering (median 46d on market — plan ~5-8 weeks vacancy on turnover, expect pricing pressure); 52% of comp listings sitting > 30 days — soft ceiling on asking rent; high-income renter base; 9,195 units permitted in Riverside County in 2024 (1,512 in 5+ unit buildings).
Forward outlook
- In year one you build about $17k of equity ($3k loan paydown + $14k appreciation (3.8% local appreciation)).
- Riverside County population projected at +22% by 2050 — long-run rental-demand tailwind backs the buy-and-hold thesis.
- At projected returns (3.8% appreciation + 3.0% rent growth), your $108k cash investment doubles in ~4 years — after that, you're playing with house money.
- By year 3, paydown + projected appreciation supports a ~$42k cash-out refi (75% LTV) — recoverable capital for the next deal without selling this one.
Negotiation context
- It's been on market 95 days — a 9% lower offer ($350k) is reasonable based on typical stale-listing flexibility.
- 22 sale attempts since 28y ago with the ask held roughly flat each time — persistent listings suggest the price (not the market) is what's stuck; bring a comps-based counter.
- Current owner paid $256k; list at $385k implies a 50% gain — meaningful room to come down on a strong offer.
Risks & watch-outs
- Climate carrying-cost: moderate wildfire risk; extreme-heat days projected 7→17/yr by 2055 (HVAC capex compounding) — expect insurance premiums to compound above CPI over the hold.
Questions for the listing agent
- It's been on market 95 days. Have you received any prior offers? Is the seller open to a 9% concession, seller financing, or rate buy-down credit?
- What does the HOA fee cover, when was the last increase, and are there any pending special assessments or reserve-fund shortfalls?
- Any open or pending special assessments — roof, HVAC, plumbing, elevator, façade? What's the per-unit balance and payoff schedule, and is the seller paying it off at close or rolling it to the buyer?
- Why hasn't it sold? Are there any deal-killer items the seller is aware of (foundation, flood, title, zoning, code violations)?
- Is there a deadline driving the sale (1031 exchange, divorce, estate, relocation)? That informs how much negotiation room exists.
- Schools are B-rated — typically a magnet for longer-tenancy family renters. What's the average tenant stay here, and is there a school-zone premium baked into asking?
- What's the average days-on-market for RENTAL listings here right now (not sales)? A rising rental-DOM trend means longer vacancies and softer asking-rent achievability than the comps imply.
- What's the recent tenant-quality profile in this submarket — average credit score on applications, eviction rate, late-payment / NSF rate, and stable-employment percentage? A property-management company in the area should have these aggregated.
- How much new apartment / multifamily construction is in the pipeline within 1–3 miles? Heavy new supply (>2% of stock underway) typically softens rents 12–24 months out; light construction supports rent growth.
Investment metrics
- 1% rule
- 1.43% ✓
- Cap rate
- 9.70%
- Cash-on-cash
- 12.15%
- DSCR
- 1.54
- GRM
- 5.8
CMA / ARV
No comps found within radius.
Projected returns pro-forma
3.76% appreciation · 3.0% rent growth · sell at horizon
- IRR
- 20.7%
- Equity multiple
- 2.22×
- Total profit
- $132,041
- Equity at exit
- $189,795
- IRR
- 21.3%
- Equity multiple
- 4.29×
- Total profit
- $354,473
- Equity at exit
- $306,188
Cash invested: $107,800 (down + closing). Projections, not guarantees.
Landlord ↔ Tenant lean methodology
- Overall (STATE)
- 18 Strongly Tenant-Friendly
- State California
- 18 Strongly Tenant-Friendly · D+13
- County
- — inherits STATE
- City
- — inherits STATE
ZIP-level market 92210
- Home prices YoY
- 1.3%
- Active inventory
- 151
- Price-to-rent
- 5.8×
Monthly cashflow live
- Estimated rent
- $5,487 high interval (Pro) →
- Mortgage (P&I)
- −$2,019
- Tax from tax record
- −$406 /mo · $4,873/yr
- Insurance
- −$160
- HOA
- −$657
- Lot rent
- −$0
- Vacancy / Maint / Mgmt
- −$1,152
- Net cashflow
- $1,092
Break-even live
Sensitivity live
| Price | -10% $1,310 | -5% $1,201 | +0% $1,092 | +5% $983 | +10% $874 |
|---|---|---|---|---|---|
| Rent | -10% $658 | -5% $875 | +0% $1,092 | +5% $1,309 | +10% $1,525 |
| Rate | -1.0pp $1,286 | -0.5pp $1,190 | base $1,092 | +0.5pp $992 | +1.0pp $891 |
UW: 25.0% down · 7.5% · 30yr · 1.5% tax · 5.0% vac · 8.0% maint · 8.0% mgmt
Financing live
Cash to close
- Down payment
- $96,250
- Closing costs
- $11,550
- Reserves months
- —
- Total cash needed
- —
Loan-product check · same deal, 3 products live
Conventional
25% down · 7.5% · 30yr
- Down + closing
- —
- Monthly P&I
- —
- Monthly cashflow
- —
- DSCR
- —
- Eligible?
- —
Personal DTI + credit; lowest rate.
DSCR
20% down · 8.5% · 30yr
- Down + closing
- —
- Monthly P&I
- —
- Monthly cashflow
- —
- DSCR
- —
- Eligible?
- —
No personal income docs; deal must DSCR.
Hard money
10% down · 12.0% · 12mo
- Down + closing
- —
- Monthly P&I
- —
- Monthly cashflow
- —
- DSCR
- —
- Eligible?
- —
Short-term bridge; refi at stabilization.
Rent comps 40 comps
| Address | Beds | Baths | Sqft | Rent | $/sqft | DOM | Units | Dist |
|---|---|---|---|---|---|---|---|---|
| 46644 Arapahoe Unit A Indian Wells, CA | 2.0 | 2.0 | 1446 | $5,000 | $3.46 | 46d | 1 | 0.03mi |
| 46642 Arapahoe Unit B Indian Wells, CA | 2.0 | 2.0 | 1446 | $4,750 | $3.28 | 46d | 1 | 0.03mi |
| 46632 Arapahoe Unit B Indian Wells, CA | 2.0 | 2.0 | 1446 | $4,200 | $2.90 | 46d | 1 | 0.03mi |
| 46594 Arapahoe Indian Wells, CA | 3.0 | 3.0 | 1791 | $7,900 | $4.41 | 46d | 1 | 0.05mi |
| 46596 Arapahoe Indian Wells, CA | 3.0 | 3.0 | 1791 | $6,000 | $3.35 | 24d | 1 | 0.05mi |
| 46568 Arapahoe Unit A Indian Wells, CA | 2.0 | 2.0 | 1446 | $3,200 | $2.21 | 26d | 1 | 0.06mi |
| 78130 Cortez Ln Indian Wells, CA | 1.0–2.0 | 1.0–2.0 | 874 | $3,500 | $4.00 | 46d | 2 | 0.10mi |
| 78205 Cortez Ln #178 Indian Wells, CA | 2.0 | 2.0 | 1152 | $3,000 | $2.60 | 46d | 1 | 0.14mi |
| 77675 Seminole Rd Indian Wells, CA | 2.0 | 2.5 | 1716 | $5,500 | $3.21 | 26d | 1 | 0.29mi |
| 46890 Highland Palms Dr La Quinta, CA | 3.0 | 2.0 | 1588 | $8,500 | $5.35 | 46d | 1 | 0.36mi |
| 46890 Highland Palms Dr La Quinta, CA | 3.0 | 2.0 | 1588 | $8,500 | $5.35 | 7d | 1 | 0.36mi |
| 46560 Cameo Palms Dr La Quinta, CA | 3.0 | 2.0 | 1782 | $4,500 | $2.53 | 26d | 1 | 0.37mi |
| 45245 Seeley Dr La Quinta, CA | 2.0 | 2.0–2.5 | 1200 | $3,250 | $2.71 | 26d | 3 | 0.84mi |
| 45245 Seeley Dr La Quinta, CA | 2.0 | 2.0–2.5 | 1200 | $3,750 | $3.12 | 20d | 2 | 0.84mi |
| 48602 Paseo Tarazo La Quinta, CA | 2.0 | 2.0 | 1562 | $3,100 | $1.98 | 46d | 1 | 0.86mi |
| 48625 Calle Esperanza La Quinta, CA | 3.0 | 2.0 | 1852 | $2,999 | $1.62 | 26d | 1 | 0.91mi |
| 78780 Birchcrest Cir La Quinta, CA | 3.0 | 2.0 | 1411 | $3,500 | $2.48 | 24d | 1 | 0.96mi |
| 77777 Tradition Dr Unit B La Quinta, CA | 3.0 | 3.0 | 1706 | $6,950 | $4.07 | 46d | 1 | 0.98mi |
| 77110 Desi Dr Indian Wells, CA | 3.0 | 2.0 | 1801 | $8,500 | $4.72 | 46d | 1 | 1.00mi |
| 48110 Calle Seranas La Quinta, CA | 3.0 | 2.0 | 1581 | $5,500 | $3.48 | 46d | 1 | 1.00mi |
| 48114 Calle Seranas La Quinta, CA | 2.0 | 2.0 | 1466 | $6,000 | $4.09 | 46d | 1 | 1.02mi |
| 77709 Tradition Dr La Quinta, CA | 2.0 | 2.0 | 1307 | $4,500 | $3.44 | 46d | 1 | 1.04mi |
| 77713 Tradition Dr La Quinta, CA | 3.0 | 3.0 | 1706 | $5,500 | $3.22 | 26d | 1 | 1.04mi |
| 48613 Classic Dr La Quinta, CA | 2.0 | 2.0 | 1307 | $4,500 | $3.44 | 46d | 1 | 1.08mi |
| 48573 Classic Dr La Quinta, CA | 2.0 | 2.0 | 1307 | $4,500 | $3.44 | 46d | 1 | 1.09mi |
| 47470 Aloe Way La Quinta, CA | 3.0–4.0 | 2.5–3.5 | 1793 | $3,279 | $1.83 | 1d | 14 | 1.10mi |
| 44753 Warner Trl Indian Wells, CA | 3.0 | 2.0 | 1280 | $6,000 | $4.69 | 5d | 1 | 1.12mi |
| 77430 Miles Ave Indian Wells, CA | 3.0 | 2.0 | 1353 | $2,500 | $1.85 | 46d | 1 | 1.13mi |
| 47750 Adams St La Quinta, CA | 1.0–2.0 | 1.0–2.0 | 956 | $2,220 | $2.32 | 46d | 1 | 1.16mi |
| 78435 Magenta Dr La Quinta, CA | 2.0 | 2.0 | 912 | $3,500 | $3.84 | 7d | 1 | 1.21mi |
| 78720 W Harland Dr La Quinta, CA | 3.0 | 2.0 | 1452 | $3,000 | $2.07 | 20d | 1 | 1.21mi |
| 49005 Washington St La Quinta, CA | 2.0 | 2.0 | 1368 | $2,950 | $2.16 | 20d | 1 | 1.26mi |
| 76895 Lark Dr Indian Wells, CA | 2.0 | 2.0 | 1864 | $4,500 | $2.41 | 46d | 1 | 1.29mi |
| 76895 Lark Dr Indian Wells, CA | 2.0 | 2.0 | 1864 | $4,500 | $2.41 | 22d | 1 | 1.29mi |
| 78301 Terra Cotta Ct La Quinta, CA | 2.0 | 2.0 | 926 | $2,200 | $2.38 | 19d | 1 | 1.31mi |
| 45930 Las Colinas La Quinta, CA | 3.0 | 2.0 | 1500 | $2,850 | $1.90 | 26d | 1 | 1.31mi |
| 49100 Tango Ct La Quinta, CA | 3.0 | 2.5 | 1804 | $3,000 | $1.66 | 46d | 1 | 1.35mi |
| 78880 Sanita Dr La Quinta, CA | 3.0 | 2.0 | 1659 | $3,400 | $2.05 | 1d | 1 | 1.37mi |
| 45705 Hopi Rd Indian Wells, CA | 2.0 | 2.0 | 1776 | $8,000 | $4.50 | 46d | 1 | 1.38mi |
| 77707 Calle Las Brisas S Palm Desert, CA | 2.0 | 2.0 | 1441 | $4,900 | $3.40 | 46d | 1 | 1.39mi |
HOA detail condo
- Monthly dues
- $657 · $7,884/yr
- Likely covers
- poolsecurity
- Assessments
- None detected in remarks — confirm with the listing agent.
Listing history 50 events
-
2026-06-07days on market $385,000 Active 95 DOM
-
2026-06-04days on market $385,000 Active 92 DOM
-
2026-06-03days on market $385,000 Active 91 DOM
-
2026-06-02days on market $385,000 Active 90 DOM
-
2026-06-01days on market $385,000 Active 89 DOM
-
2026-05-31days on market $385,000 Active 88 DOM
-
2026-03-04$385,000 Active 998-char remark
Show marketing remark (998 chars)
Step into resort-style living in this sophisticated 2-bedroom, 2-bath condo within the gated Mountain Cove community. Enjoy an open floor plan with vaulted ceilings and three private balconies that seamlessly blend indoor-outdoor living. Savor breathtaking southwest-facing mountain and sunset views from the main living room, primary bedroom, and balconies. Partially furnished for your ease, this home is primed for entertaining and relaxation. The primary suite is a luxurious retreat with a walk-in closet, updated bath with dual vanity and custom-tiled shower, and a private balcony overlooking the pool and mountains. A guest suite with its own bath ensures comfort for visitors, with both bathrooms elegantly renovated. Enjoy exclusive Indian Wells resident discounts on golf, dining, and local amenities, just minutes from world-class tennis, golf, shopping, and dining. With a 30-day minimum rental policy, this condo offers flexibility for part-time residence and rental income potential.
-
2026-02-04historical
-
2025-09-04$385,000 Active
-
2025-08-26historical
-
2025-08-21status Active
-
2025-06-28price $450,000
-
2025-06-27status Active
-
2025-05-06status Active
-
2025-04-22$460,000 Active
-
2024-06-13historical
-
2024-05-04$467,000 Active
-
2024-04-30historical
-
2018-07-11status Pending
-
2018-07-11soldstatus $256,000 Sold
-
2018-07-02soldstatus $256,000
-
2018-07-02soldstatus $256,000
-
2018-06-09historical Contingent
-
2018-06-06$259,000 Active
-
2018-05-31historical
-
2018-04-21status Active
-
2018-04-21historical
-
2018-04-21$259,000 Active
-
2018-04-05historical Contingent
-
2018-03-03$269,000 Active
-
2018-02-07historical
-
2018-02-07$239,000 Active
-
2017-06-30soldstatus $209,000 Sold
-
2017-06-30soldstatus $205,000
-
2017-06-07status Pending
-
2017-05-16historical Contingent
-
2017-04-18price $209,900
-
2017-03-25$224,900 Active
-
2008-03-14soldstatus $220,000
-
2008-02-11historical
-
2007-12-01price $254,900
-
2007-10-18price $274,000
-
2007-09-21$289,000
-
2007-09-14historical
-
2007-03-19$319,000
-
2007-03-16historical
-
2006-11-16$319,000
-
2006-03-06historical
-
2006-03-01soldstatus $310,000
-
2005-11-29$329,990
ⓘ Source: listings_history table (triggers on properties + properties_extension) + one-shot
backfill from property_details.listing_events for pre-trigger history.
Tax reassessment forecast CA · Resets to sale price
- Current annual tax
- $4,873 · $406/mo
- Projected year-2 tax
- $4,873 · $406/mo
- Expected delta
- $0/yr ($0/mo · 0.0%)
ⓘ Screening estimate from a state-policy table — verify with the county assessor before closing.
Climate risk First Street
- Flood 1/10 Low FEMA zone X (unshaded) · 0% chance over 30 yrs
- Wildfire 5/10 Major
- Heat 9/10 Extreme 7 d/yr ≥114°F today · 17 d/yr by 30 yrs out
- Wind 1/10 Low
- Air quality 4/10 Moderate 4 unhealthy d/yr today · 5 by 30 yrs out
Nearby sold comps map
Loading sold comps map…
Walkable amenities ~0.75 mi
Loading nearby amenities…
Taxation est. · year 1
- Rental income
- $65,838
- − Mortgage interest
- −$21,566
- − Property taxes
- −$4,873
- − Insurance
- −$1,925
- − Repairs & maintenance
- −$5,267
- − Management
- −$5,267
- − HOA
- −$7,884
- − Depreciation
- −$11,200
- Taxable income
- $7,856
- Est. tax owed @ 24.0%
- −$1,885
- After-tax cash flow
- $11,217/yr
For passive investors: Depreciation is non-cash, so a rental often shows a tax loss while cash-flowing — sheltering income. Rental losses are passive: they offset passive income freely, and up to $25,000/yr can offset ordinary (W-2) income if you actively participate and your MAGI is under $100k (phasing out to $0 by $150k); unused losses carry forward. On sale, claimed depreciation is recaptured at up to 25%, and gains may owe capital-gains tax (a 1031 exchange can defer both). Figures are a year-1 estimate at your 24.0% rate — not tax advice; consult a CPA.
Schools (NCES district)
- District
- Desert Sands Unified
- NCES district ID
- 0611110
- Math proficiency
- 31% ▼ -4.00%
- Reading proficiency
- 56% ▲ 7.00%
- Median HH income
- $54,957
- Composite
- 37.77/100
- National rank
- #4346
- State rank
- #199 of 517 in CA
Livability — Indian Wells
- Score
- 53/100
- State rank
- #968
- US rank
- #24559
Category grades
Schools grade is shown separately in the Schools card above.
Census & demographics
- Census place
- Indian Wells, CA
- County
- Riverside County · 2,287,001 people
- City population
- 4,871
- Metro
- Riverside-San Bernardino-Ontario, CA
- Population (ZIP)
- 4,871
- Household income
- $162,990
- Rent vs Own
- Severe rent burden
- 56.0
Population outlook (Riverside County) Hauer SSP2
- Today (2025)
- 2,664,475 people
- By 2030
- 2,802,692 · +5.2%
- By 2040
- 3,050,904 · +14.5%
- By 2050
- 3,256,783 · +22.2%
- By 2075
- 3,655,058 · +37.2%
- By 2100
- 3,766,594 · +41.4%
Race, ethnicity, and origin ACS 2023
- Neighborhood character
- Predominantly White (86%)
- Race & ethnicity
- White 86% Hispanic / Latino 5% Two or more races 5% Asian 3% Black 3%
- Common ancestry
- Slovak 5% Lithuanian 4% Romanian 3%
- Foreign-born
- 10% · Canada, China
- Languages at home
- 92% English-only · Spanish 3% Russian/Polish/Slavic 1% Tagalog/Filipino 1%
Political lean MEDSL · Riverside
- 2024 margin
- Toss-up / Even · D 48.0% · R 49.3% · Other 2.6%
- 2008→2024 swing
- -3.6pp toward R · 2008: 2.3pp · 2024: -1.3pp
- All cycles
- 2024: R+1.3 2020: D+8.0 2016: D+4.3 2012: R+0.4 2008: D+2.3
Not yet ingested
- Civics
- —
Market trends
- HPI YoY
- ▲ 3.76%
- Current HPI
- 299.2632
- Rent YoY
- —
- Metro
- Riverside-San Bernardino-Ontario, CA
- State GDP YoY
- ▲ 3.21%
- F500 in state
- 116
Industry mix (Fortune 500 HQ in CA)
| Industry | F500 HQs | Revenue |
|---|---|---|
| Technology | 27 | $1,492B |
|
||
| Financial Services | 3 | $174B |
|
||
| Retail | 3 | $44B |
|
||
| Insurance | 3 | $26B |
|
||
| Media / Entertainment | 2 | $115B |
|
||
| Pharmaceuticals / Biotech | 2 | $62B |
|
||
Price history
+384.3% since first listed56 events — show timeline
- 2026-03-04 Listed $385,000 GPSMLS
- 2026-02-04 Listing Removed — GPSMLS
- 2025-09-04 Listed $385,000 GPSMLS
- 2025-08-26 Listing Removed — GPSMLS
- 2025-08-21 Relisted — GPSMLS
- 2025-06-28 Price Changed $450,000 GPSMLS
- 2025-06-27 Relisted — GPSMLS
- 2025-05-06 Relisted — GPSMLS
- 2025-04-22 Listed $460,000 GPSMLS
- 2024-06-13 Listing Removed — GPSMLS
- 2024-05-04 Listed $467,000 GPSMLS
- 2024-04-30 Coming Soon — GPSMLS
- 2018-07-11 Pending — GPSMLS
- 2018-07-11 Sold (MLS) $256,000 GPSMLS
- 2018-07-02 Sold (Public Records) $256,000 Public Records
- 2018-07-02 Sold (Public Records) $256,000 Public Records
- 2018-06-09 Contingent — GPSMLS
- 2018-06-06 Listed $259,000 GPSMLS
- 2018-05-31 Listing Removed — GPSMLS
- 2018-04-21 Relisted — GPSMLS
- 2018-04-21 Listed $259,000 GPSMLS
- 2018-04-21 Listing Removed — GPSMLS
- 2018-04-05 Contingent — GPSMLS
- 2018-03-03 Listed $269,000 GPSMLS
- 2018-02-07 Listed $239,000 GPSMLS
- 2018-02-07 Listing Removed — GPSMLS
- 2017-06-30 Sold (Public Records) $205,000 Public Records
- 2017-06-30 Sold (MLS) $209,000 GPSMLS
- 2017-06-07 Pending — GPSMLS
- 2017-05-16 Contingent — GPSMLS
- 2017-04-18 Price Changed $209,900 GPSMLS
- 2017-03-25 Listed $224,900 GPSMLS
- 2008-03-14 Sold (Public Records) $220,000 Public Records
- 2008-02-11 Listing Removed — GPSMLS
- 2007-12-01 Price Changed $254,900 GPSMLS
- 2007-10-18 Price Changed $274,000 GPSMLS
- 2007-09-21 Listed $289,000 GPSMLS
- 2007-09-14 Listing Removed — GPSMLS
- 2007-03-19 Listed $319,000 GPSMLS
- 2007-03-16 Listing Removed — GPSMLS
- 2006-11-16 Listed $319,000 GPSMLS
- 2006-03-06 Listing Removed — GPSMLS
- 2006-03-01 Sold (Public Records) $310,000 Public Records
- 2005-11-29 Listed $329,990 GPSMLS
- 2005-11-23 Listing Removed — GPSMLS
- 2005-08-31 Listed $329,000 GPSMLS
- 2004-10-01 Listing Removed — GPSMLS
- 2004-03-05 Listed $219,900 GPSMLS
- 2003-10-01 Listing Removed — GPSMLS
- 2003-09-24 Listing Removed — GPSMLS
- 2003-09-24 Listed $159,500 GPSMLS
- 2003-06-23 Listed $160,000 GPSMLS
- 1999-05-12 Sold (Public Records) $77,500 Public Records
- 1999-05-12 Sold (Public Records) $155,000 Public Records
- 1999-04-07 Listing Removed — GPSMLS
- 1998-12-11 Listed $79,500 GPSMLS
Property tax history
+0.7%/yrLatest (2025): $4,873 · +3.3% YoY. Source: county tax records.
Cash-flow waterfall
monthlySold comps — $/sqft
last 12 mo · ≤1 miLoading sold comps…