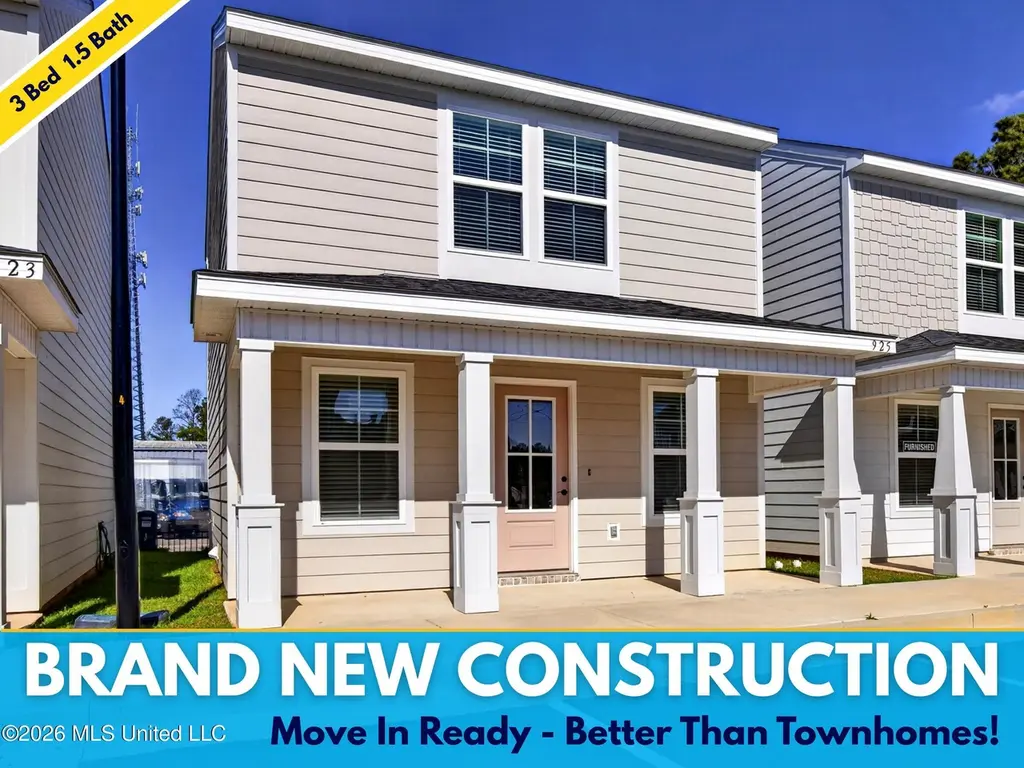
925 Motsie Rd · Biloxi, MS
Flood risk 1/10 · Minimal
- FEMA flood zone
- X (unshaded)
- Chance of flooding over 30 yrs
- 0.0%
- Est. flood insurance / yr
- $507 – $1,088
Fire risk 3/10 · Minor
- Est. fire insurance / yr
- $1,241 – $2,305
Heat risk 10/10 · Severe
- Hot days now (above 106°F)
- 7 days/yr
- Hot days in 30 yrs
- 22 days/yr
Wind risk 9/10 · Severe
- Chance of severe wind over 30 yrs
- 99.0%
Air-quality risk 2/10 · Minimal
- Unhealthy air days now
- 1 days/yr
- Unhealthy air days in 30 yrs
- 2 days/yr
Risk factors via First Street. Map © Google.
Why this score? — see what drove the D grade
The composite is a weighted blend of 9 inputs, each scored 0–100. Each bar is that input's sub-score; the figure is the points it added to the 100-point composite (weight × sub-score).
- Cash flow +12.9/30.0
- Condition / age +5.0/5.0
- 1% rule +4.9/10.0
- Schools +4.5/10.0
- Livability +4.0/5.0
- DSCR +3.9/10.0
- ARV discount +3.9/15.0
- Rent growth +3.2/5.0
- Appreciation +0.0/10.0
$189,900
🖨 Deal sheet (PDF) 📄 Offer letter ✓ Due diligence
Listing remarks
Discover the perfect blend of privacy and low-maintenance living in this charming, fully detached 3-bedroom, 1.5-bath cottage, ideally located just minutes from Keesler AFB, I-10, and Biloxi's premier dining and entertainment. Designed for those who want the independence of a single-family home with the effortless "lock-and-leave" lifestyle of a townhome, this zero-lot-line property eliminates weekend yard work without the hassle of shared walls. The inviting interior features a smart, open-concept main floor where the living room flows into the kitchen and dining area, complete with a convenient half bath. Upstairs, you'll find a private retreat featuring three bedrooms and a ful
Key facts
- Fully detached
- Private rear patio
- 1,306 sq ft lot
Tags
Property features AI
Finance
- HOA & community: Association with quarterly fee of $580; Association covers grounds maintenance
Exterior
- Parking: Common parking lot with 1 parking space total
- Utilities: Public water; Public sewer; Electricity connected; Water connected; Sewer connected
- Home design: Single-family house; Two levels; Model: Parker; New construction
- Construction: HardiPlank siding; Siding construction; Architectural shingle roof; Slab foundation; Built per plans (year built from public records)
- Exterior features: Front porch; Patio; Private yard; City lot; Zero lot line
Interior
- Kitchen: Dishwasher; Disposal; Oven; Refrigerator
- Bedrooms: Three bedrooms on the second floor; One bedroom on the first floor
- Bathrooms: One full bathroom; One half bathroom (1.5 total bathrooms)
- Heating & cooling: Central heating; Central air conditioning
- Interior features: Move-in ready; Living room; Total of 6 rooms
- Laundry & utility: Washer/Dryer included
Neighborhood map
What this means for you Summary
Snapshot
- This is a 3-bed/1.5-bath single-family listed at $190k. Condition is rated excellent.
Deal economics
- At list price, monthly cash flow is $-14 ($-173/yr) — negative.
- To cash-flow at today's rent, offer at most $188k (1.1% below list).
- To meet the 1% rule (rent ≥ 1% of price), the offer needs to be $189k (0.6% below list).
- Recommended offer: $184k (3.0% below list) — sets the bar for market timing.
- Cap rate 6.2% vs local median 3.5% in Biloxi — top-decile yield for the area; either an underpriced asset or a hidden risk that comps aren't pricing in. Stress-test before assuming the spread holds.
Location & tenants
- Location reads 79/100 on livability (#6 in MS, #2,141 nationally) — a middle-class / working-renter tenant base. Strengths: crime A+, cost of living A+, housing A+; Watch: commute D+, amenities F, employment D-.
- Biloxi Public School District (urban): math 60% / reading 48% proficiency, ranked #7 of 130 in MS (top 5%) — acceptable for families but not a draw, mixed tenant base, ~2y average lease.
- Zoned schools: North Bay Elementary School (math 67% / reading 67%, grade B+, #11 of 375 statewide, top 3%, 754 students, 100% FRL); Biloxi Junior High (math 60% / reading 43%, grade C, #27 of 179 statewide, top 16%, 881 students, 100% FRL); Biloxi High School (math 65% / reading 53%, grade C+, #7 of 197 statewide, top 3%, 1,728 students, 100% FRL) — zoned schools average 100% FRL vs 59% district-wide (40 pts higher); higher-poverty schools than district average — tighter screening recommended.
- Market conditions: Rents rising (+3.0%/yr); 393 active listings in the ZIP; 24 comparable units currently listed for rent nearby; rentals lingering (median 46d on market — plan ~5-8 weeks vacancy on turnover, expect pricing pressure); 83% of comp listings sitting > 30 days — soft ceiling on asking rent; 2,194 units permitted in Harrison County in 2024 (0 in 5+ unit buildings).
- This rent runs 33% of the median local income ($69k/yr) — at the standard rent-burdened threshold; future hikes will face affordability resistance.
Forward outlook
- Local home prices are declining (-3.0%/yr); year-one equity from $1k of loan paydown is wiped out by about $6k of value loss. Plan a longer hold.
- Harrison County population projected at +27% by 2050 — long-run rental-demand tailwind backs the buy-and-hold thesis.
Negotiation context
- It's been on market 58 days — a 3% lower offer ($184k) is reasonable based on typical stale-listing flexibility.
- 3 sale attempts; this cycle's ask has dropped $10k (5%) from the opening price — seller is motivated, your offer sets the floor, not the list.
Risks & watch-outs
- Climate carrying-cost: severe wind risk, 99% chance of damaging wind over 30y; extreme-heat days projected 7→22/yr by 2055 (HVAC capex compounding) — expect insurance premiums to compound above CPI over the hold.
Questions for the listing agent
- What do current leases actually rent for vs. the listed asking? Can we see a recent rent roll and the last 12 months of T-12 income?
- It's been on market 58 days. Have you received any prior offers? Is the seller open to a 3% concession, seller financing, or rate buy-down credit?
- What does the HOA fee cover, when was the last increase, and are there any pending special assessments or reserve-fund shortfalls?
- Is there a deadline driving the sale (1031 exchange, divorce, estate, relocation)? That informs how much negotiation room exists.
- The area grade is low — what's the realistic commute time and amenity access for the typical tenant pool here? Any planned neighborhood developments (good or bad) we should know about?
- What's the average days-on-market for RENTAL listings here right now (not sales)? A rising rental-DOM trend means longer vacancies and softer asking-rent achievability than the comps imply.
- What's the recent tenant-quality profile in this submarket — average credit score on applications, eviction rate, late-payment / NSF rate, and stable-employment percentage? A property-management company in the area should have these aggregated.
- How much new for-sale + rental construction is in the pipeline within 1–3 miles? Heavy new supply typically softens prices + rents 12–24 months out; constrained supply supports both.
Investment metrics
- 1% rule
- 0.99% ✗
- Cap rate
- 6.20%
- Cash-on-cash
- -0.32%
- DSCR
- 0.99
- GRM
- 8.4
CMA / ARV
- ARV (median comp)
- $175,895
- List price
- $189,900
- Delta
- 7.96%
- Verdict
- FAIR
- Comps
- 15 within 1.0 mi
Show comp detail 3 sales within ~0.75 mi
| Address | Dist | Beds/Ba | Sqft | Sold | Price | $/sf | Match |
|---|---|---|---|---|---|---|---|
| 903 Motsie Rd | 0.03mi | 3/1.5 | 1,030 (0%) | 8mo | $202,990 | $197 | 92 |
| 943 Motsie Rd #25 | 0.03mi | 3/1.5 | 1,000 (-3%) | 10mo | $189,990 | $190 | 86 |
| 931 Motsie Rd #6 | 0.01mi | 3/1.5 | 1,000 (-3%) | 15mo | $190,990 | $191 | 83 |
Match score weights: distance 35% · size 25% · config 20% · recency 20%. Top-matched comps best support the ARV.
Projected returns pro-forma
-3.0% appreciation · 2.98% rent growth · sell at horizon
- IRR
- -16.8%
- Equity multiple
- 0.41×
- Total profit
- $-31,579
- Equity at exit
- $28,315
- IRR
- -8.5%
- Equity multiple
- 0.47×
- Total profit
- $-28,237
- Equity at exit
- $16,419
Cash invested: $53,172 (down + closing). Projections, not guarantees.
Landlord ↔ Tenant lean methodology
- Overall (STATE)
- 90 Strongly Landlord-Friendly
- State Mississippi
- 90 Strongly Landlord-Friendly · R+11
- County
- — inherits STATE
- City
- — inherits STATE
ZIP-level market 39532
- Rents YoY
- 3.0%
- Active inventory
- 393
- Price-to-rent
- 8.4×
Monthly cashflow live
- Estimated rent
- $1,887 high interval (Pro) →
- Mortgage (P&I)
- −$996
- Tax est. 1.5%
- −$237 /mo · $2,848/yr
- Insurance
- −$79
- HOA
- −$193
- Vacancy / Maint / Mgmt
- −$396
- Net cashflow
- $-14
Break-even live
Sensitivity live
| Price | -10% $117 | -5% $51 | +0% $-14 | +5% $-80 | +10% $-146 |
|---|---|---|---|---|---|
| Rent | -10% $-163 | -5% $-89 | +0% $-14 | +5% $60 | +10% $135 |
| Rate | -1.0pp $81 | -0.5pp $34 | base $-14 | +0.5pp $-64 | +1.0pp $-114 |
UW: 25.0% down · 7.5% · 30yr · 1.5% tax · 5.0% vac · 8.0% maint · 8.0% mgmt
Financing live
Cash to close
- Down payment
- $47,475
- Closing costs
- $5,697
- Reserves months
- —
- Total cash needed
- —
Loan-product check · same deal, 3 products live
Conventional
25% down · 7.5% · 30yr
- Down + closing
- —
- Monthly P&I
- —
- Monthly cashflow
- —
- DSCR
- —
- Eligible?
- —
Personal DTI + credit; lowest rate.
DSCR
20% down · 8.5% · 30yr
- Down + closing
- —
- Monthly P&I
- —
- Monthly cashflow
- —
- DSCR
- —
- Eligible?
- —
No personal income docs; deal must DSCR.
Hard money
10% down · 12.0% · 12mo
- Down + closing
- —
- Monthly P&I
- —
- Monthly cashflow
- —
- DSCR
- —
- Eligible?
- —
Short-term bridge; refi at stabilization.
Rent comps 24 comps
| Address | Beds | Baths | Sqft | Rent | $/sqft | DOM | Units | Dist |
|---|---|---|---|---|---|---|---|---|
| 941 Motsie Rd Biloxi, MS | 3.0 | 1.5 | 1030 | $1,950 | $1.89 | 45d | 1 | 0.03mi |
| 927 Motsie Rd Biloxi, MS | 3.0 | 1.5 | 1030 | $1,950 | $1.89 | 45d | 1 | 0.04mi |
| 923 Motsie Rd Biloxi, MS | 3.0 | 1.5 | 1030 | $1,950 | $1.89 | 45d | 1 | 0.06mi |
| 949 Motsie Rd Biloxi, MS | 3.0 | 1.5 | 1030 | $1,950 | $1.89 | 45d | 1 | 0.06mi |
| 947 Motsie Rd Biloxi, MS | 3.0 | 1.5 | 1030 | $1,950 | $1.89 | 45d | 1 | 0.07mi |
| 945 Motsie Rd Biloxi, MS | 3.0 | 1.5 | 1030 | $1,950 | $1.89 | 45d | 1 | 0.07mi |
| 935 Motsie Rd Biloxi, MS | 3.0 | 1.5 | 1030 | $1,950 | $1.89 | 45d | 1 | 0.07mi |
| 933 Motsie Rd Biloxi, MS | 3.0 | 1.5 | 1030 | $1,950 | $1.89 | 45d | 1 | 0.07mi |
| 919 Motsie Rd Biloxi, MS | 3.0 | 1.5 | 1030 | $1,950 | $1.89 | 45d | 1 | 0.08mi |
| 917 Motsie Rd Biloxi, MS | 3.0 | 1.5 | 1030 | $1,950 | $1.89 | 45d | 1 | 0.08mi |
| 913 Motsie Rd Biloxi, MS | 3.0 | 1.5 | 1030 | $1,950 | $1.89 | 45d | 1 | 0.08mi |
| 909 Motsie Rd Biloxi, MS | 3.0 | 1.5 | 1030 | $1,950 | $1.89 | 45d | 1 | 0.08mi |
| 907 Motsie Rd Biloxi, MS | 3.0 | 1.5 | 1030 | $1,950 | $1.89 | 45d | 1 | 0.08mi |
| 905 Motsie Rd Biloxi, MS | 3.0 | 1.5 | 1030 | $1,950 | $1.89 | 45d | 1 | 0.10mi |
| 880 Motsie Rd Apt C109 Biloxi, MS | 3.0 | 2.0 | 1140 | $1,600 | $1.40 | 45d | 1 | 0.26mi |
| 831 Cedar Lake Rd Biloxi, MS | 1.0–3.0 | 1.0–2.0 | 1065 | $1,699 | $1.59 | 15d | 9 | 0.60mi |
| 1773 Popps Ferry Rd Biloxi, MS | 1.0–2.0 | 1.0–2.0 | 968 | $1,205 | $1.24 | 15d | 13 | 0.61mi |
| 1735 Tribe Dr Biloxi, MS | 3.0 | 2.0 | 1290 | $2,195 | $1.70 | 15d | 12 | 0.83mi |
| 11136 Windsor Hill Dr Diberville, MS | 3.0 | 2.0 | 1301 | $1,749 | $1.34 | 45d | 1 | 0.91mi |
| 2 Sandalwood Ct Diberville, MS | 3.0 | 2.0 | 1290 | $1,625 | $1.26 | 45d | 1 | 1.16mi |
| 4294 Popps Ferry Rd Diberville, MS | 2.0 | 2.0 | 1176 | $1,575 | $1.34 | 45d | 1 | 1.17mi |
| 678 Meadow Dr Diberville, MS | 3.0 | 1.5 | 1112 | $1,500 | $1.35 | 15d | 1 | 1.18mi |
| 329 Springdale Cir D'Iberville, MS | 3.0 | 2.0 | 1176 | $1,600 | $1.36 | 45d | 1 | 1.32mi |
| 630 Bay Cove Dr Biloxi, MS | 2.0–3.0 | 2.0 | 1780 | $3,450 | $1.94 | 45d | 2 | 1.39mi |
HOA detail
- Monthly dues
- $193 · $2,316/yr
Listing history 21 events
-
2026-06-21days on market $189,900 Active 58 DOM
-
2026-06-18days on market $189,900 Active 55 DOM
-
2026-06-17days on market $189,900 Active 54 DOM
-
2026-06-16days on market $189,900 Active 53 DOM
-
2026-06-15days on market $189,900 Active 52 DOM
-
2026-06-14days on market $189,900 Active 50 DOM
-
2026-06-13days on market $189,900 Active 49 DOM
-
2026-06-09days on market $189,900 Active 46 DOM
-
2026-06-08days on market $189,900 Active 45 DOM
-
2026-06-07days on market $189,900 Active 44 DOM
-
2026-06-05days on market $189,900 Active 41 DOM
-
2026-06-03days on market $189,900 Active 40 DOM
-
2026-06-02days on market $189,900 Active 39 DOM
-
2026-06-01days on market $189,900 Active 38 DOM
-
2026-05-31days on market $189,900 Active 37 DOM
-
2026-05-30pricedays on market $189,900 Active 36 DOM
-
2026-05-16historical $1,950
-
2026-04-24$199,900 Active 1069-char remark
-
2026-01-22$1,950
-
2026-01-07historical
-
2025-07-03$202,990 Active
ⓘ Source: listings_history table (triggers on properties + properties_extension) + one-shot
backfill from property_details.listing_events for pre-trigger history.
Climate risk First Street
- Flood 1/10 Low FEMA zone X (unshaded) · 0% chance over 30 yrs
- Wildfire 3/10 Moderate
- Heat 10/10 Extreme 7 d/yr ≥106°F today · 22 d/yr by 30 yrs out
- Wind 9/10 Extreme 99% chance of damaging wind over 30 yrs
- Air quality 2/10 Low 1 unhealthy d/yr today · 2 by 30 yrs out
Nearby sold comps map
Loading sold comps map…
Walkable amenities ~0.75 mi
Loading nearby amenities…
Taxation est. · year 1
- Rental income
- $22,648
- − Mortgage interest
- −$10,637
- − Property taxes
- −$2,848
- − Insurance
- −$950
- − Repairs & maintenance
- −$1,812
- − Management
- −$1,812
- − HOA
- −$2,316
- − Depreciation
- −$5,524
- Taxable loss
- −$3,252
- Est. tax savings @ 24.0%
- +$780
- After-tax cash flow
- $608/yr
For passive investors: Depreciation is non-cash, so a rental often shows a tax loss while cash-flowing — sheltering income. Rental losses are passive: they offset passive income freely, and up to $25,000/yr can offset ordinary (W-2) income if you actively participate and your MAGI is under $100k (phasing out to $0 by $150k); unused losses carry forward. On sale, claimed depreciation is recaptured at up to 25%, and gains may owe capital-gains tax (a 1031 exchange can defer both). Figures are a year-1 estimate at your 24.0% rate — not tax advice; consult a CPA.
Condition & rehab AI · 13 photos
This brand new construction home is move-in ready with excellent condition and no visible repairs needed. It offers a great opportunity for both resale and rental value with potential for further improvements.
Value-add opportunities
- Both Landscaping and curb appeal improvements — Enhances curb appeal and can attract more buyers
- Both Add smart home features — Improves convenience and can increase both resale and rental value
Renovation cost estimate screening
Value-add ROI direction
- Both Landscaping and curb appeal improvements — Enhances curb appeal and can attract more buyers ↑
- Both Add smart home features — Improves convenience and can increase both resale and rental value ↑
ⓘ Cost ranges are severity-bucket heuristics (US national rule-of-thumb). Get contractor quotes + a written scope before underwriting a rehab budget.
Schools (NCES district)
- District
- Biloxi Public School District
- NCES district ID
- 2800630
- Math proficiency
- 60% ▼ -7.00%
- Reading proficiency
- 48% ▼ -3.00%
- Median HH income
- $40,608
- Composite
- 45.26/100
- National rank
- #2657
- State rank
- #7 of 130 in MS
Livability — Biloxi
- Score
- 79/100
- State rank
- #6
- US rank
- #2141
Category grades
Schools grade is shown separately in the Schools card above.
Census & demographics
- Census place
- Biloxi, MS
- County
- Harrison County · 178,171 people
- City population
- 63,281
- Metro
- Gulfport-Biloxi, MS
- Population (ZIP)
- 36,662
- Household income
- $68,710
- Rent vs Own
- Severe rent burden
- 954.0
Population outlook (Harrison County) Hauer SSP2
- Today (2025)
- 228,444 people
- By 2030
- 241,942 · +5.9%
- By 2040
- 267,531 · +17.1%
- By 2050
- 291,062 · +27.4%
- By 2075
- 346,711 · +51.8%
- By 2100
- 378,165 · +65.5%
Race, ethnicity, and origin ACS 2023
- Neighborhood character
- Predominantly White (69%)
- Race & ethnicity
- White 69% Black 15% Two or more races 9% Hispanic / Latino 6% Asian 4%
- Hispanic origin (detail)
- Mexican 2%
- Common ancestry
- Lithuanian 5% Italian 2% Serbian 2%
- Foreign-born
- 4% · Vietnam, Canada
- Languages at home
- 94% English-only · Spanish 2% Vietnamese 1% Other Indo-European 1%
Political lean MEDSL · Harrison
- 2024 margin
- Strong R (+28.9) · D 35.0% · R 63.9% · Other 1.1%
- 2008→2024 swing
- -2.9pp toward R · 2008: -26.0pp · 2024: -28.9pp
- All cycles
- 2024: R+28.9 2020: R+25.2 2016: R+30.7 2012: R+26.6 2008: R+26.0
Not yet ingested
- Civics
- —
Market trends
- HPI YoY
- ▼ -90.04%
- Current HPI
- 154.9975
- Rent YoY
- ▲ 2.98%
- Metro
- Gulfport-Biloxi, MS
- State GDP YoY
- —
- F500 in state
- 0
Price history
-6.4% since first listed6 events — show timeline
- 2026-05-29 Price Changed $189,900 MLSU
- 2026-05-16 Rental Removed $1,950 MLSU
- 2026-04-24 Listed $199,900 MLSU
- 2026-01-22 Listed for Rent $1,950 MLSU
- 2026-01-07 Listing Removed — MLSU
- 2025-07-03 Listed $202,990 MLSU
Cash-flow waterfall
monthlySold comps — $/sqft
last 12 mo · ≤1 miLoading sold comps…