 🏗️ New Construction
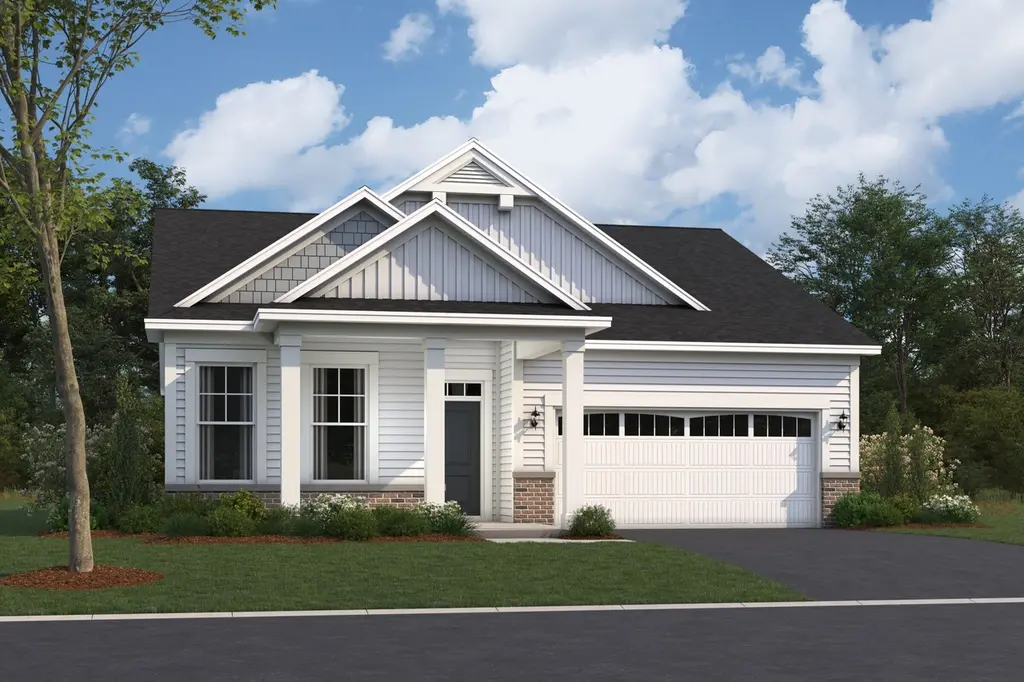
Deacon Plan · Oswego, IL
Flood risk 1/10 · Minimal
- FEMA flood zone
- X (unshaded)
- Chance of flooding over 30 yrs
- 0.0%
- Est. flood insurance / yr
- $507 – $1,088
Fire risk 1/10 · Minimal
- Est. fire insurance / yr
- $804 – $1,492
Heat risk 3/10 · Minor
- Hot days now (above 103°F)
- 7 days/yr
- Hot days in 30 yrs
- 15 days/yr
Wind risk 2/10 · Minimal
- Chance of severe wind over 30 yrs
- 1.0%
Air-quality risk 3/10 · Minor
- Unhealthy air days now
- 3 days/yr
- Unhealthy air days in 30 yrs
- 4 days/yr
Risk factors via First Street. Map © Google.
Why this score? — see what drove the F grade
The composite is a weighted blend of 9 inputs, each scored 0–100. Each bar is that input's sub-score; the figure is the points it added to the 100-point composite (weight × sub-score).
- ARV discount +7.5/15.0
- Cash flow +5.9/30.0
- Condition / age +5.0/5.0
- Livability +4.0/5.0
- Rent growth +3.6/5.0
- Schools +3.1/10.0
- 1% rule +1.8/10.0
- DSCR +0.3/10.0
- Appreciation +0.0/10.0
$357,990
🖨 Deal sheet (PDF) 📄 Offer letter ✓ Due diligence
Listing remarks MLS
Welcome to your dream new home! The Deacon is a single-story floorplan with 2-3 bedrooms, 2 baths, an open-concept kitchen, and a 2-car garage.
Key facts
- Open-concept kitchen
- 2 garage spots
- Listed 656 days
Tags
Neighborhood map
What this means for you Summary
Snapshot
- This is a 2-bed/2.0-bath single-family listed at $358k. Condition is rated excellent.
Deal economics
- At list price, monthly cash flow is $-835 ($-10k/yr) — negative.
- To cash-flow at today's rent, offer at most $308k (14.1% below list).
- To meet the 1% rule (rent ≥ 1% of price), the offer needs to be $292k (18.5% below list).
- Recommended offer: $292k (18.5% below list) — sets the bar for 1% rule.
Location & tenants
- Location reads 81/100 on livability (#83 in IL, #1,366 nationally) — a professional / high-income tenant draw. Strengths: crime A+, employment A+, housing A+; Watch: amenities F, commute F.
- CUSD 308 (suburban): math 29% / reading 34% proficiency, ranked #179 of 620 in IL (top 29%) — families likely to look elsewhere, expect single-tenant / working-renter base with shorter leases; only 20% free/reduced lunch — higher-income household profile.
- Zoned schools: Southbury Elem School (math 33% / reading 39%, grade F, #503 of 2,056 statewide, top 25%, 581 students, 0% FRL); Traughber Jr High School (math 25% / reading 31%, grade F, #284 of 665 statewide, top 44%, 1,135 students, 0% FRL); Oswego High School (math 29% / reading 36%, grade F, #152 of 693 statewide, top 22%, 2,901 students, 0% FRL) — zoned schools average 0% FRL vs 20% district-wide (20 pts lower); this property's tenant base skews higher-income than the district average.
- Market conditions: Rents rising fast (+4.5%/yr); 300 active listings in the ZIP; 15 comparable units currently listed for rent nearby; rentals lingering (median 46d on market — plan ~5-8 weeks vacancy on turnover, expect pricing pressure); 53% of comp listings sitting > 30 days — soft ceiling on asking rent; high-income renter base; 706 units permitted in Kendall County in 2024 (263 in 5+ unit buildings).
Forward outlook
- Local home prices are declining (-3.0%/yr); year-one equity from $3k of loan paydown is wiped out by about $13k of value loss. Plan a longer hold.
- Kendall County population projected at +20% by 2050 — long-run rental-demand tailwind backs the buy-and-hold thesis.
Negotiation context
- It's been on market 656 days — a 12% lower offer ($315k) is reasonable based on typical stale-listing flexibility.
- 3 sale attempts since 2y ago; this cycle's ask has dropped $61k (15%) from the opening price — seller is motivated, your offer sets the floor, not the list.
Questions for the listing agent
- What do current leases actually rent for vs. the listed asking? Can we see a recent rent roll and the last 12 months of T-12 income?
- It's been on market 656 days. Have you received any prior offers? Is the seller open to a 19% concession, seller financing, or rate buy-down credit?
- What does the HOA fee cover, when was the last increase, and are there any pending special assessments or reserve-fund shortfalls?
- Why hasn't it sold? Are there any deal-killer items the seller is aware of (foundation, flood, title, zoning, code violations)?
- Is there a deadline driving the sale (1031 exchange, divorce, estate, relocation)? That informs how much negotiation room exists.
- Schools are B-rated — typically a magnet for longer-tenancy family renters. What's the average tenant stay here, and is there a school-zone premium baked into asking?
- The area grade is low — what's the realistic commute time and amenity access for the typical tenant pool here? Any planned neighborhood developments (good or bad) we should know about?
- What's the average days-on-market for RENTAL listings here right now (not sales)? A rising rental-DOM trend means longer vacancies and softer asking-rent achievability than the comps imply.
- What's the recent tenant-quality profile in this submarket — average credit score on applications, eviction rate, late-payment / NSF rate, and stable-employment percentage? A property-management company in the area should have these aggregated.
- How much new for-sale + rental construction is in the pipeline within 1–3 miles? Heavy new supply typically softens prices + rents 12–24 months out; constrained supply supports both.
Investment metrics
- 1% rule
- 0.68% ✗
- Cap rate
- 3.95%
- Cash-on-cash
- -8.35%
- DSCR
- 0.63
- GRM
- 12.2
CMA / ARV
- ARV (median comp)
- $428,404
- List price
- $357,990
- Delta
- -16.44%
- Verdict
- UNDERPRICED
- Comps
- 20 within 1.0 mi
Show comp detail 12 sales within ~0.75 mi
| Address | Dist | Beds/Ba | Sqft | Sold | Price | $/sf | Match |
|---|---|---|---|---|---|---|---|
| 309 Dennis Ln | 0.12mi | 2/2.0 | 1,800 (0%) | 7mo | $409,990 | $228 | 88 |
| 734 Alberta Ave | 0.13mi | 2/2.0 | 1,700 (-6%) | 1mo | $430,990 | $254 | 83 |
| 737 Alberta Ave | 0.13mi | 2/2.0 | 1,700 (-6%) | 3mo | $471,515 | $277 | 82 |
| 724 Alberta Ave | 0.15mi | 2/2.0 | 1,700 (-6%) | 6mo | $429,990 | $253 | 79 |
| 307 Dennis Ln | 0.12mi | 2/2.0 | 1,700 (-6%) | 8mo | $452,400 | $266 | 78 |
| 713 Alberta Ave | 0.11mi | 2/2.0 | 1,938 (+8%) | 10mo | $429,990 | $222 | 74 |
| 740 Alberta Ave | 0.15mi | 2/2.0 | 1,573 (-13%) | 1mo | $390,145 | $248 | 71 |
| 730 Alberta Ave | 0.15mi | 2/2.0 | 1,573 (-13%) | 5mo | $389,990 | $248 | 68 |
| 735 Alberta Ave | 0.12mi | 3/2.0 (+1) | 1,573 (-13%) | 6mo | $379,990 | $242 | 63 |
| 836 Colchester Dr | 0.63mi | 2/2.0 | 1,933 (+7%) | 0mo | $495,000 | $256 | 58 |
| 124 Cinderford Ct | 0.54mi | 3/2.5 (+1) | 1,705 (-5%) | 8mo | $372,000 | $218 | 52 |
| 794 Suffield Ct | 0.70mi | 3/2.0 (+1) | 1,729 (-4%) | 10mo | $445,000 | $257 | 47 |
Match score weights: distance 35% · size 25% · config 20% · recency 20%. Top-matched comps best support the ARV.
Projected returns pro-forma
-3.0% appreciation · 4.47% rent growth · sell at horizon
- IRR
- -29.2%
- Equity multiple
- 0.02×
- Total profit
- $-118,065
- Equity at exit
- $63,876
- IRR
- -23.8%
- Equity multiple
- -0.27×
- Total profit
- $-152,152
- Equity at exit
- $37,041
Cash invested: $119,953 (down + closing). Projections, not guarantees.
Landlord ↔ Tenant lean methodology
- Overall (STATE)
- 43 Moderately Tenant-Leaning
- State Illinois
- 43 Moderately Tenant-Leaning · D+7
- County
- — inherits STATE
- City
- — inherits STATE
ZIP-level market 60543
- Home prices YoY
- -30.3%
- Rents YoY
- 4.5%
- Active inventory
- 300
- Price-to-rent
- 10.2×
Monthly cashflow live
- Estimated rent
- $2,916 high interval (Pro) →
- Mortgage (P&I)
- −$2,247
- Tax est. 1.5%
- −$536 /mo · $6,426/yr
- Insurance
- −$179
- HOA
- −$178
- Vacancy / Maint / Mgmt
- −$612
- Net cashflow
- $-835
Break-even live
Sensitivity live
| Price | -10% $-539 | -5% $-687 | +0% $-835 | +5% $-983 | +10% $-1,131 |
|---|---|---|---|---|---|
| Rent | -10% $-1,065 | -5% $-950 | +0% $-835 | +5% $-720 | +10% $-605 |
| Rate | -1.0pp $-619 | -0.5pp $-726 | base $-835 | +0.5pp $-946 | +1.0pp $-1,059 |
UW: 25.0% down · 7.5% · 30yr · 1.5% tax · 5.0% vac · 8.0% maint · 8.0% mgmt
Financing live
Cash to close
- Down payment
- $107,101
- Closing costs
- $12,852
- Reserves months
- —
- Total cash needed
- —
Loan-product check · same deal, 3 products live
Conventional
25% down · 7.5% · 30yr
- Down + closing
- —
- Monthly P&I
- —
- Monthly cashflow
- —
- DSCR
- —
- Eligible?
- —
Personal DTI + credit; lowest rate.
DSCR
20% down · 8.5% · 30yr
- Down + closing
- —
- Monthly P&I
- —
- Monthly cashflow
- —
- DSCR
- —
- Eligible?
- —
No personal income docs; deal must DSCR.
Hard money
10% down · 12.0% · 12mo
- Down + closing
- —
- Monthly P&I
- —
- Monthly cashflow
- —
- DSCR
- —
- Eligible?
- —
Short-term bridge; refi at stabilization.
Rent comps 15 comps
| Address | Beds | Baths | Sqft | Rent | $/sqft | DOM | Units | Dist |
|---|---|---|---|---|---|---|---|---|
| 615 Starling Cir Oswego, IL | 1.0–4.0 | 1.5–2.5 | 1421 | $2,513 | $1.77 | 0d | 14 | 0.59mi |
| 169 Lakeshore Dr Oswego, IL | 3.0 | 2.5 | 2221 | $3,000 | $1.35 | 45d | 1 | 0.89mi |
| 285 Lakeshore Dr Oswego, IL | 3.0 | 2.5 | 1914 | $3,000 | $1.57 | 9d | 1 | 0.90mi |
| 285 Lakeshore Dr Oswego, IL | 3.0 | 2.5 | 1914 | $3,200 | $1.67 | 45d | 1 | 0.90mi |
| 137 Dorset Ave Oswego, IL | 3.0 | 2.0 | 2189 | $4,000 | $1.83 | 14d | 1 | 1.31mi |
| 119 Dorset Ave Oswego, IL | 3.0 | 2.5 | 1559 | $2,900 | $1.86 | 45d | 1 | 1.32mi |
| 157 Dorset Ave Oswego, IL | 3.0 | 2.5 | 1559 | $2,751 | $1.76 | 45d | 1 | 1.33mi |
| 501 Vinca Ln Oswego, IL | 2.0–3.0 | 1.5–2.5 | 1792 | $2,500 | $1.40 | 0d | 19 | 1.37mi |
| 182 Dorset Ave Oswego, IL | 3.0 | 2.5 | 1747 | $3,501 | $2.00 | 12d | 1 | 1.39mi |
| 513 Vinca Ln Oswego, IL | 3.0 | 2.0 | 1609 | $3,000 | $1.86 | 45d | 1 | 1.40mi |
| 517 Vinca Ln Oswego, IL | 3.0 | 2.5 | 1747 | $2,900 | $1.66 | 45d | 1 | 1.41mi |
| 519 Vinca Ln Oswego, IL | 3.0 | 2.5 | 1559 | $2,700 | $1.73 | 45d | 1 | 1.41mi |
| 519 Vinca Ln Oswego, IL | 3.0 | 2.5 | 1559 | $3,401 | $2.18 | 12d | 1 | 1.41mi |
| 254 Dorset Ave Oswego, IL | 3.0 | 2.5 | 1559 | $2,651 | $1.70 | 45d | 1 | 1.44mi |
| 279 Dorset Ave Oswego, IL | 3.0 | 2.0 | 1609 | $4,000 | $2.49 | 12d | 1 | 1.47mi |
HOA detail
- Monthly dues
- $178 · $2,136/yr
Listing history 29 events
-
2026-06-21days on market $357,990 Active 656 DOM
-
2026-06-18days on market $357,990 Active 653 DOM
-
2026-06-17days on market $357,990 Active 652 DOM
-
2026-06-16days on market $357,990 Active 651 DOM
-
2026-06-15days on market $357,990 Active 650 DOM
-
2026-06-13days on market $357,990 Active 648 DOM
-
2026-06-09days on market $357,990 Active 644 DOM
-
2026-06-08days on market $357,990 Active 643 DOM
-
2026-06-07days on market $357,990 Active 642 DOM
-
2026-06-04days on market $357,990 Active 639 DOM
-
2026-06-03days on market $357,990 Active 638 DOM
-
2026-06-02days on market $357,990 Active 637 DOM
-
2026-06-01days on market $357,990 Active 636 DOM
-
2026-05-31days on market $357,990 Active 635 DOM
-
2026-05-10price $357,990 143-char remark
Show marketing remark (143 chars)
Welcome to your dream new home! The Deacon is a single-story floorplan with 2-3 bedrooms, 2 baths, an open-concept kitchen, and a 2-car garage.
-
2026-04-02price $447,990 143-char remark
Show marketing remark (143 chars)
Welcome to your dream new home! The Deacon is a single-story floorplan with 2-3 bedrooms, 2 baths, an open-concept kitchen, and a 2-car garage.
-
2026-02-28price $446,990 143-char remark
Show marketing remark (143 chars)
Welcome to your dream new home! The Deacon is a single-story floorplan with 2-3 bedrooms, 2 baths, an open-concept kitchen, and a 2-car garage.
-
2026-02-12price $445,990 143-char remark
Show marketing remark (143 chars)
Welcome to your dream new home! The Deacon is a single-story floorplan with 2-3 bedrooms, 2 baths, an open-concept kitchen, and a 2-car garage.
-
2025-11-25status Active 143-char remark
Show marketing remark (143 chars)
Welcome to your dream new home! The Deacon is a single-story floorplan with 2-3 bedrooms, 2 baths, an open-concept kitchen, and a 2-car garage.
-
2025-11-19historical 143-char remark
Show marketing remark (143 chars)
Welcome to your dream new home! The Deacon is a single-story floorplan with 2-3 bedrooms, 2 baths, an open-concept kitchen, and a 2-car garage.
-
2025-11-05price $465,990 143-char remark
Show marketing remark (143 chars)
Welcome to your dream new home! The Deacon is a single-story floorplan with 2-3 bedrooms, 2 baths, an open-concept kitchen, and a 2-car garage.
-
2025-08-29price $463,990 143-char remark
Show marketing remark (143 chars)
Welcome to your dream new home! The Deacon is a single-story floorplan with 2-3 bedrooms, 2 baths, an open-concept kitchen, and a 2-car garage.
-
2025-07-03price $453,990 143-char remark
Show marketing remark (143 chars)
Welcome to your dream new home! The Deacon is a single-story floorplan with 2-3 bedrooms, 2 baths, an open-concept kitchen, and a 2-car garage.
-
2025-03-21price $433,990 143-char remark
Show marketing remark (143 chars)
Welcome to your dream new home! The Deacon is a single-story floorplan with 2-3 bedrooms, 2 baths, an open-concept kitchen, and a 2-car garage.
-
2025-03-06price $423,990 143-char remark
Show marketing remark (143 chars)
Welcome to your dream new home! The Deacon is a single-story floorplan with 2-3 bedrooms, 2 baths, an open-concept kitchen, and a 2-car garage.
-
2025-01-28status Active 143-char remark
Show marketing remark (143 chars)
Welcome to your dream new home! The Deacon is a single-story floorplan with 2-3 bedrooms, 2 baths, an open-concept kitchen, and a 2-car garage.
-
2025-01-23historical 143-char remark
Show marketing remark (143 chars)
Welcome to your dream new home! The Deacon is a single-story floorplan with 2-3 bedrooms, 2 baths, an open-concept kitchen, and a 2-car garage.
-
2025-01-02price $421,990 143-char remark
Show marketing remark (143 chars)
Welcome to your dream new home! The Deacon is a single-story floorplan with 2-3 bedrooms, 2 baths, an open-concept kitchen, and a 2-car garage.
-
2024-08-21$418,990 Active 143-char remark
Show marketing remark (143 chars)
Welcome to your dream new home! The Deacon is a single-story floorplan with 2-3 bedrooms, 2 baths, an open-concept kitchen, and a 2-car garage.
ⓘ Source: listings_history table (triggers on properties + properties_extension) + one-shot
backfill from property_details.listing_events for pre-trigger history.
Climate risk First Street
- Flood 1/10 Low FEMA zone X (unshaded) · 0% chance over 30 yrs
- Wildfire 1/10 Low
- Heat 3/10 Moderate 7 d/yr ≥103°F today · 15 d/yr by 30 yrs out
- Wind 2/10 Low 100% chance of damaging wind over 30 yrs
- Air quality 3/10 Moderate 3 unhealthy d/yr today · 4 by 30 yrs out
Nearby sold comps map
Loading sold comps map…
Walkable amenities ~0.75 mi
Loading nearby amenities…
Taxation est. · year 1
- Rental income
- $34,993
- − Mortgage interest
- −$23,997
- − Property taxes
- −$6,426
- − Insurance
- −$2,142
- − Repairs & maintenance
- −$2,799
- − Management
- −$2,799
- − HOA
- −$2,136
- − Depreciation
- −$12,463
- Taxable loss
- −$17,770
- Est. tax savings @ 24.0%
- +$4,265
- After-tax cash flow
- $-5,754/yr
For passive investors: Depreciation is non-cash, so a rental often shows a tax loss while cash-flowing — sheltering income. Rental losses are passive: they offset passive income freely, and up to $25,000/yr can offset ordinary (W-2) income if you actively participate and your MAGI is under $100k (phasing out to $0 by $150k); unused losses carry forward. On sale, claimed depreciation is recaptured at up to 25%, and gains may owe capital-gains tax (a 1031 exchange can defer both). Figures are a year-1 estimate at your 24.0% rate — not tax advice; consult a CPA.
Condition & rehab AI · 6 photos
This single-family home is in excellent condition with no visible repairs or maintenance needed. It offers a modern kitchen, spacious bathrooms, and a well-maintained exterior. Upgrades in paint, landscaping, and smart home features would further enhance its value.
Value-add opportunities
- Both Painting the exterior and interior — Fresh paint enhances curb appeal and interior aesthetics.
- Both Landscaping improvements — Enhances curb appeal and adds value to the property.
- Both Adding smart home features — Improves convenience and adds modern appeal, attracting more buyers and renters.
- Both Upgrading the kitchen appliances — Modern appliances enhance functionality and appeal, making the home more attractive to buyers and renters.
- Both Upgrading the bathroom fixtures — Modern fixtures improve functionality and aesthetics, making the home more attractive to buyers and renters.
Renovation cost estimate screening
Value-add ROI direction
- Both Painting the exterior and interior — Fresh paint enhances curb appeal and interior aesthetics. ↑
- Both Landscaping improvements — Enhances curb appeal and adds value to the property. ↑
- Both Adding smart home features — Improves convenience and adds modern appeal, attracting more buyers and renters. ↑
- Both Upgrading the kitchen appliances — Modern appliances enhance functionality and appeal, making the home more attractive to buyers and renters. ↑
- Both Upgrading the bathroom fixtures — Modern fixtures improve functionality and aesthetics, making the home more attractive to buyers and renters. ↑
ⓘ Cost ranges are severity-bucket heuristics (US national rule-of-thumb). Get contractor quotes + a written scope before underwriting a rehab budget.
Schools (NCES district)
- District
- CUSD 308
- NCES district ID
- 1730270
- Math proficiency
- 29% ▼ -10.00%
- Reading proficiency
- 34% ▼ -9.00%
- Median HH income
- $89,945
- Composite
- 31.25/100
- National rank
- #6028
- State rank
- #179 of 620 in IL
Livability — Oswego
- Score
- 81/100
- State rank
- #83
- US rank
- #1366
Category grades
Schools grade is shown separately in the Schools card above.
Census & demographics
- County
- Kendall County · 71,842 people
- City population
- 43,047
- Metro
- Chicago-Naperville-Elgin, IL-IN-WI
- Population (ZIP)
- 43,047
- Household income
- $119,371
- Rent vs Own
- Severe rent burden
- 317.0
Population outlook (Kendall County) Hauer SSP2
- Today (2025)
- 138,283 people
- By 2030
- 144,935 · +4.8%
- By 2040
- 156,944 · +13.5%
- By 2050
- 165,424 · +19.6%
- By 2075
- 174,715 · +26.3%
- By 2100
- 168,523 · +21.9%
Race, ethnicity, and origin ACS 2023
- Neighborhood character
- Majority White (64%)
- Race & ethnicity
- White 64% Hispanic / Latino 18% Two or more races 13% Black 10% Asian 4%
- Hispanic origin (detail)
- Mexican 14% Puerto Rican 2%
- Common ancestry
- Romanian 7% Lithuanian 2% Italian 2%
- Foreign-born
- 13% · Canada
- Languages at home
- 79% English-only · Spanish 14% Other Indo-European 2% Russian/Polish/Slavic 2%
Political lean MEDSL · Kendall
- 2024 margin
- Toss-up / Even · D 50.0% · R 48.5% · Other 1.6%
- 2008→2024 swing
- -5.7pp toward R · 2008: 7.2pp · 2024: 1.5pp
- All cycles
- 2024: D+1.5 2020: D+5.7 2016: R+1.5 2012: R+4.1 2008: D+7.2
Not yet ingested
- Civics
- —
Market trends
- HPI YoY
- ▼ -91.42%
- Current HPI
- 210.3944
- Rent YoY
- ▲ 4.47%
- Metro
- Chicago-Naperville-Elgin, IL-IN-WI
- State GDP YoY
- ▲ 1.59%
- F500 in state
- 60
Industry mix (Fortune 500 HQ in IL)
| Industry | F500 HQs | Revenue |
|---|---|---|
| Insurance | 4 | $201B |
|
||
| Consumer Goods | 4 | $87B |
|
||
| Industrial Machinery | 3 | $64B |
|
||
| Healthcare | 2 | $55B |
|
||
| Retail / Pharmacy | 1 | $148B |
|
||
| Agriculture / Food | 1 | $86B |
|
||
Price history
-14.6% since first listed15 events — show timeline
- 2026-05-10 Price Changed $357,990 Zillow
- 2026-04-02 Price Changed $447,990 Zillow
- 2026-02-28 Price Changed $446,990 Zillow
- 2026-02-12 Price Changed $445,990 Zillow
- 2025-11-25 Relisted — Zillow
- 2025-11-19 Delisted — Zillow
- 2025-11-05 Price Changed $465,990 Zillow
- 2025-08-29 Price Changed $463,990 Zillow
- 2025-07-03 Price Changed $453,990 Zillow
- 2025-03-21 Price Changed $433,990 Zillow
- 2025-03-06 Price Changed $423,990 Zillow
- 2025-01-28 Relisted — Zillow
- 2025-01-23 Delisted — Zillow
- 2025-01-02 Price Changed $421,990 Zillow
- 2024-08-21 Listed $418,990 Zillow
Cash-flow waterfall
monthlySold comps — $/sqft
last 12 mo · ≤1 miLoading sold comps…