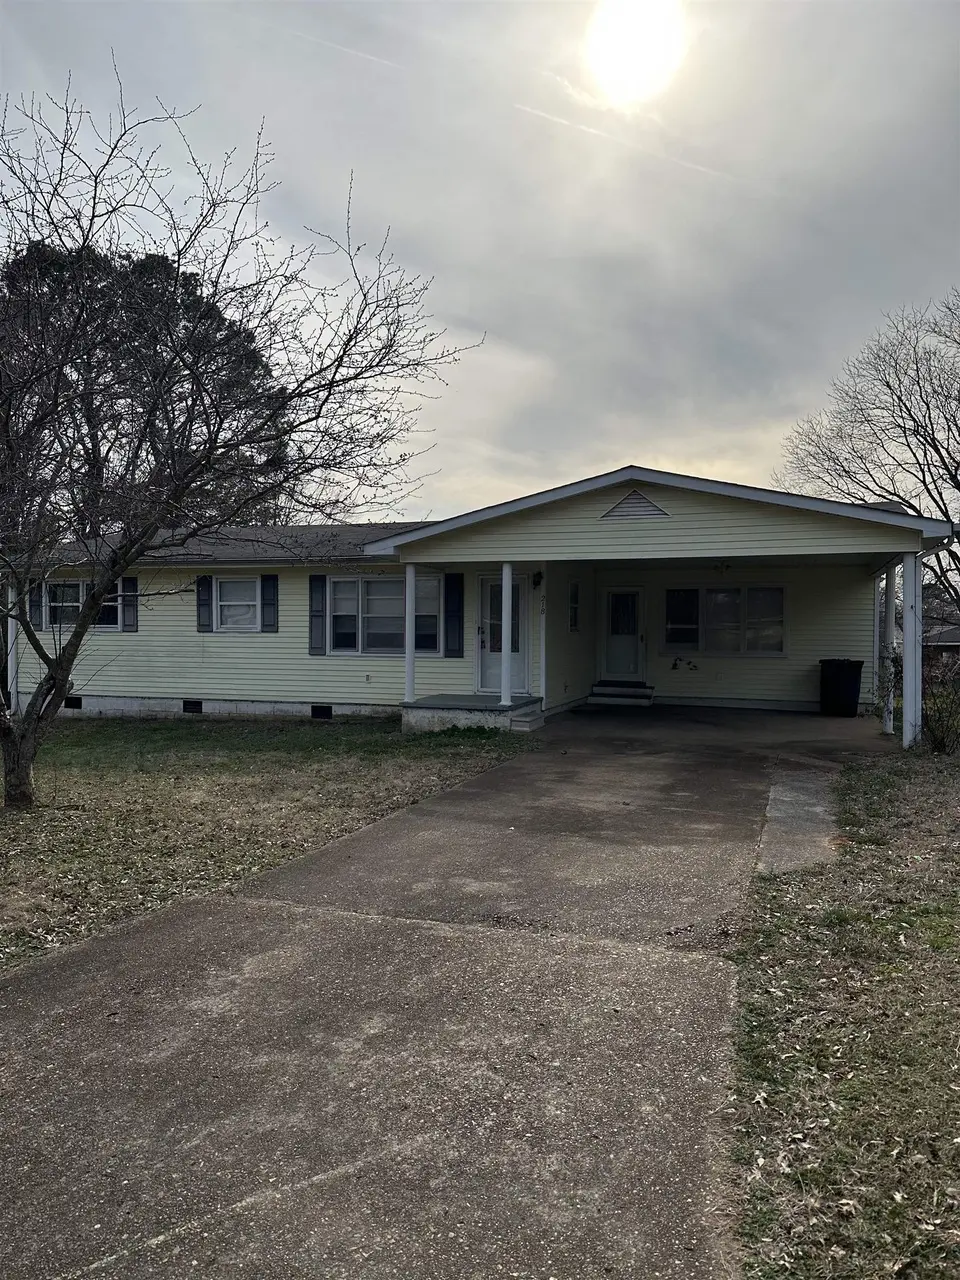
218 S Prairie St · Florence, AL
Flood risk 1/10 · Minimal
- FEMA flood zone
- X (unshaded)
- Chance of flooding over 30 yrs
- 0.0%
- Est. flood insurance / yr
- $507 – $1,088
Fire risk 1/10 · Minimal
- Est. fire insurance / yr
- $916 – $1,700
Heat risk 6/10 · Moderate
- Hot days now (above 108°F)
- 7 days/yr
- Hot days in 30 yrs
- 20 days/yr
Wind risk 5/10 · Moderate
- Chance of severe wind over 30 yrs
- 23.0%
Air-quality risk 2/10 · Minimal
- Unhealthy air days now
- 0 days/yr
- Unhealthy air days in 30 yrs
- 2 days/yr
Risk factors via First Street. Map © Google.
Why this score? — see what drove the C grade
The composite is a weighted blend of 9 inputs, each scored 0–100. Each bar is that input's sub-score; the figure is the points it added to the 100-point composite (weight × sub-score).
- Cash flow +21.1/30.0
- ARV discount +12.8/15.0
- DSCR +6.7/10.0
- 1% rule +4.9/10.0
- Livability +4.1/5.0
- Rent growth +4.0/5.0
- Schools +3.0/10.0
- Condition / age +2.5/5.0
- Appreciation +0.0/10.0
$155,000
🖨 Deal sheet (PDF) 📄 Offer letter ✓ Due diligence
Listing remarks MLS
Great opportunity to own a home in Florence, AL! This property at 218 S. Prairie Street offers plenty of potential for the right buyer. The home needs some updating and repairs, making it ideal for investors, handy buyers, or anyone looking to customize a home to their taste. Conveniently located near local amenities, schools, and shopping, this property is ready for someone to bring it back to its full potential. Don’t miss this chance to create your dream home. Buyer to verify all information.
Key facts
- 0.34 acre lot
- 2 parking spots
- Built 1955
Neighborhood map
What this means for you Summary
Snapshot
- This is a 4-bed/2.0-bath single-family listed at $155k.
Deal economics
- At list price, monthly cash flow is $221 ($3k/yr) — positive.
- The deal already cash-flows at list — no discount required.
- To meet the 1% rule (rent ≥ 1% of price), the offer needs to be $153k (1.3% below list).
- Recommended offer: $141k (9.0% below list) — sets the bar for market timing.
- Cap rate 8.0% vs local median 3.6% in Florence — top-decile yield for the area; either an underpriced asset or a hidden risk that comps aren't pricing in. Stress-test before assuming the spread holds.
Location & tenants
- Location reads 82/100 on livability (#4 in AL, #1,140 nationally) — a professional / high-income tenant draw. Strengths: amenities A+, commute A+, cost of living A+; Watch: crime F, employment F.
- Florence City (urban): math 28% / reading 44% proficiency, ranked #44 of 129 in AL (top 34%) — families likely to look elsewhere, expect single-tenant / working-renter base with shorter leases.
- Zoned schools: Forest Hills School (math 39% / reading 65%, grade C-, #102 of 627 statewide, top 17%, 831 students, 45% FRL); Florence Middle School (math 22% / reading 44%, grade F, #101 of 257 statewide, top 40%, 689 students, 51% FRL); Florence High School (math 28% / reading 34%, grade F, #66 of 305 statewide, top 21%, 1,034 students, 36% FRL).
- Market conditions: Rents rising fast (+6.2%/yr); 270 active listings in the ZIP; 1 comparable units currently listed for rent nearby; 164 units permitted in Lauderdale County in 2024 (72 in 5+ unit buildings).
- This rent runs 40% of the median local income ($46k/yr) — at the standard rent-burdened threshold; future hikes will face affordability resistance.
Forward outlook
- Local home prices are declining (-3.0%/yr); year-one equity from $1k of loan paydown is wiped out by about $5k of value loss. Plan a longer hold.
- At projected returns (-3.0% appreciation + 6.2% rent growth), your $43k cash investment doubles in ~10 years — after that, you're playing with house money.
Negotiation context
- It's been on market 94 days — a 9% lower offer ($141k) is reasonable based on typical stale-listing flexibility.
- 3 sale attempts since 16y ago; this cycle's ask has dropped $25k (14%) from the opening price — seller is motivated, your offer sets the floor, not the list.
Risks & watch-outs
- Watch-outs: built in 1955 — expect roof / HVAC / electrical / plumbing capex.
- Climate carrying-cost: moderate wind risk, 23% chance of damaging wind over 30y; extreme-heat days projected 7→20/yr by 2055 (HVAC capex compounding) — expect insurance premiums to compound above CPI over the hold.
Questions for the listing agent
- It's been on market 94 days. Have you received any prior offers? Is the seller open to a 9% concession, seller financing, or rate buy-down credit?
- Built in 1955 — when were the roof, HVAC, electrical panel, plumbing, and water heater last replaced?
- Why hasn't it sold? Are there any deal-killer items the seller is aware of (foundation, flood, title, zoning, code violations)?
- Is there a deadline driving the sale (1031 exchange, divorce, estate, relocation)? That informs how much negotiation room exists.
- Crime grade is F in this area — have there been break-ins, vandalism, or insurance claims at this property in the last 3 years? What carrier currently insures it and at what premium?
- What's the average days-on-market for RENTAL listings here right now (not sales)? A rising rental-DOM trend means longer vacancies and softer asking-rent achievability than the comps imply.
- What's the recent tenant-quality profile in this submarket — average credit score on applications, eviction rate, late-payment / NSF rate, and stable-employment percentage? A property-management company in the area should have these aggregated.
- How much new for-sale + rental construction is in the pipeline within 1–3 miles? Heavy new supply typically softens prices + rents 12–24 months out; constrained supply supports both.
Investment metrics
- 1% rule
- 0.99% ✗
- Cap rate
- 8.00%
- Cash-on-cash
- 6.10%
- DSCR
- 1.27
- GRM
- 8.4
CMA / ARV
- ARV (median comp)
- $175,476
- List price
- $155,000
- Delta
- -11.67%
- Verdict
- UNDERPRICED
- Comps
- 20 within 1.0 mi
Show comp detail 10 sales within ~0.75 mi
| Address | Dist | Beds/Ba | Sqft | Sold | Price | $/sf | Match |
|---|---|---|---|---|---|---|---|
| 104 Osteen Cir | 0.34mi | 3/2.0 (-1) | 1,660 (-10%) | 5mo | $125,000 | $75 | 59 |
| 33 Auburn St | 0.21mi | 3/1.5 (-1) | 1,660 (-10%) | 12mo | $177,400 | $107 | 57 |
| 4405 Center Dr | 0.48mi | 3/2.0 (-1) | 1,900 (+4%) | 14mo | $220,000 | $116 | 55 |
| 4746 Circle Dr | 0.53mi | 3/2.0 (-1) | 1,819 (-1%) | 20mo | $215,000 | $118 | 52 |
| 525 W Lakeside Dr | 0.56mi | 4/2.0 | 2,052 (+12%) | 17mo | $249,900 | $122 | 40 |
| 158 N Franklin St | 0.55mi | 3/2.0 (-1) | 2,066 (+12%) | 10mo | $74,400 | $36 | 40 |
| 312 W Lakeside Dr | 0.36mi | 3/1.5 (-1) | 1,613 (-12%) | 20mo | $126,000 | $78 | 40 |
| 520 Short St | 0.74mi | 3/2.0 (-1) | 1,600 (-13%) | 0mo | $180,000 | $113 | 38 |
| 321 W Lakeside Dr | 0.41mi | 3/2.0 (-1) | 1,562 (-15%) | 21mo | $195,250 | $125 | 33 |
| 505 E Lakeside Dr | 0.60mi | 3/1.5 (-1) | 1,600 (-13%) | 14mo | $189,900 | $119 | 32 |
Match score weights: distance 35% · size 25% · config 20% · recency 20%. Top-matched comps best support the ARV.
Projected returns pro-forma
-3.0% appreciation · 6.18% rent growth · sell at horizon
- IRR
- -3.6%
- Equity multiple
- 0.86×
- Total profit
- $-6,050
- Equity at exit
- $23,111
- IRR
- 9.2%
- Equity multiple
- 1.80×
- Total profit
- $34,819
- Equity at exit
- $13,402
Cash invested: $43,400 (down + closing). Projections, not guarantees.
Landlord ↔ Tenant lean methodology
- Overall (STATE)
- 90 Strongly Landlord-Friendly
- State Alabama
- 90 Strongly Landlord-Friendly · R+15
- County
- — inherits STATE
- City
- — inherits STATE
ZIP-level market 35630
- Home prices YoY
- -33.7%
- Rents YoY
- 6.2%
- Active inventory
- 270
- Price-to-rent
- 8.4×
Monthly cashflow live
- Estimated rent
- $1,529 medium interval (Pro) →
- Mortgage (P&I)
- −$813
- Tax from tax record
- −$110 /mo · $1,321/yr
- Insurance
- −$65
- HOA
- −$0
- Vacancy / Maint / Mgmt
- −$321
- Net cashflow
- $221
Break-even live
Sensitivity live
| Price | -10% $308 | -5% $264 | +0% $221 | +5% $177 | +10% $133 |
|---|---|---|---|---|---|
| Rent | -10% $100 | -5% $160 | +0% $221 | +5% $281 | +10% $341 |
| Rate | -1.0pp $299 | -0.5pp $260 | base $221 | +0.5pp $180 | +1.0pp $140 |
UW: 25.0% down · 7.5% · 30yr · 1.5% tax · 5.0% vac · 8.0% maint · 8.0% mgmt
Financing live
Cash to close
- Down payment
- $38,750
- Closing costs
- $4,650
- Reserves months
- —
- Total cash needed
- —
Loan-product check · same deal, 3 products live
Conventional
25% down · 7.5% · 30yr
- Down + closing
- —
- Monthly P&I
- —
- Monthly cashflow
- —
- DSCR
- —
- Eligible?
- —
Personal DTI + credit; lowest rate.
DSCR
20% down · 8.5% · 30yr
- Down + closing
- —
- Monthly P&I
- —
- Monthly cashflow
- —
- DSCR
- —
- Eligible?
- —
No personal income docs; deal must DSCR.
Hard money
10% down · 12.0% · 12mo
- Down + closing
- —
- Monthly P&I
- —
- Monthly cashflow
- —
- DSCR
- —
- Eligible?
- —
Short-term bridge; refi at stabilization.
Rent comps 1 comps
| Address | Beds | Baths | Sqft | Rent | $/sqft | DOM | Units | Dist |
|---|---|---|---|---|---|---|---|---|
| 4026 Peachtree St Florence, AL | 3.0 | 2.0 | 1660 | $1,300 | $0.78 | 45d | 1 | 0.55mi |
Listing history 23 events
-
2026-06-22days on market $155,000 Active 94 DOM
-
2026-06-21days on market $155,000 Active 93 DOM
-
2026-06-19days on market $155,000 Active 91 DOM
-
2026-06-18days on market $155,000 Active 90 DOM
-
2026-06-17days on market $155,000 Active 89 DOM
-
2026-06-16days on market $155,000 Active 88 DOM
-
2026-06-15days on market $155,000 Active 87 DOM
-
2026-06-14days on market $155,000 Active 85 DOM
-
2026-06-13days on market $155,000 Active 84 DOM
-
2026-06-10days on market $155,000 Active 82 DOM
-
2026-06-09days on market $155,000 Active 81 DOM
-
2026-06-08days on market $155,000 Active 80 DOM
-
2026-06-05days on market $155,000 Active 76 DOM
-
2026-06-02days on market $155,000 Active 74 DOM
-
2026-06-01days on market $155,000 Active 73 DOM
-
2026-05-31days on market $155,000 Active 72 DOM
-
2026-05-30days on market $155,000 Active 71 DOM
-
2026-03-19$180,000 Active 506-char remark
Show marketing remark (506 chars)
Great opportunity to own a home in Florence, AL! This property at 218 S. Prairie Street offers plenty of potential for the right buyer. The home needs some updating and repairs, making it ideal for investors, handy buyers, or anyone looking to customize a home to their taste. Conveniently located near local amenities, schools, and shopping, this property is ready for someone to bring it back to its full potential. Don’t miss this chance to create your dream home. Buyer to verify all information.
-
2022-03-24soldstatus $138,000
-
2022-03-22soldstatus $138,000 281-char remark
Show marketing remark (281 chars)
Split floor plan home with large master suite. Enjoy the flexibility that this home offers with a large living room and good sized eat-in kitchen. A nice sized backyard gives you plenty of room for play and activities. House sits on a dead end so no through traffic to worry about.
-
2021-12-15$149,900 281-char remark
Show marketing remark (281 chars)
Split floor plan home with large master suite. Enjoy the flexibility that this home offers with a large living room and good sized eat-in kitchen. A nice sized backyard gives you plenty of room for play and activities. House sits on a dead end so no through traffic to worry about.
-
2010-12-09soldstatus $78,700
-
2010-04-09$79,900
ⓘ Source: listings_history table (triggers on properties + properties_extension) + one-shot
backfill from property_details.listing_events for pre-trigger history.
Tax reassessment forecast AL · Resets to sale price
- Current annual tax
- $1,321 · $110/mo
- Projected year-2 tax
- $1,321 · $110/mo
- Expected delta
- $0/yr ($0/mo · 0.0%)
ⓘ Screening estimate from a state-policy table — verify with the county assessor before closing.
Climate risk First Street
- Flood 1/10 Low FEMA zone X (unshaded) · 0% chance over 30 yrs
- Wildfire 1/10 Low
- Heat 6/10 Major 7 d/yr ≥108°F today · 20 d/yr by 30 yrs out
- Wind 5/10 Major 23% chance of damaging wind over 30 yrs
- Air quality 2/10 Low 0 unhealthy d/yr today · 2 by 30 yrs out
Nearby sold comps map
Loading sold comps map…
Walkable amenities ~0.75 mi
Loading nearby amenities…
Taxation est. · year 1
- Rental income
- $18,350
- − Mortgage interest
- −$8,682
- − Property taxes
- −$1,321
- − Insurance
- −$775
- − Repairs & maintenance
- −$1,468
- − Management
- −$1,468
- − Depreciation
- −$4,509
- Taxable income
- $126
- Est. tax owed @ 24.0%
- −$30
- After-tax cash flow
- $2,616/yr
For passive investors: Depreciation is non-cash, so a rental often shows a tax loss while cash-flowing — sheltering income. Rental losses are passive: they offset passive income freely, and up to $25,000/yr can offset ordinary (W-2) income if you actively participate and your MAGI is under $100k (phasing out to $0 by $150k); unused losses carry forward. On sale, claimed depreciation is recaptured at up to 25%, and gains may owe capital-gains tax (a 1031 exchange can defer both). Figures are a year-1 estimate at your 24.0% rate — not tax advice; consult a CPA.
Schools (NCES district)
- District
- Florence City
- NCES district ID
- 0101530
- Math proficiency
- 28% ▼ -28.00%
- Reading proficiency
- 44% ▼ -4.00%
- Median HH income
- $34,997
- Composite
- 29.69/100
- National rank
- #6456
- State rank
- #44 of 129 in AL
Livability — Florence
- Score
- 82/100
- State rank
- #4
- US rank
- #1140
Category grades
Schools grade is shown separately in the Schools card above.
Census & demographics
- Census place
- Florence, AL
- County
- Lauderdale County · 47,988 people
- City population
- 34,028
- Metro
- Florence-Muscle Shoals, AL
- Population (ZIP)
- 34,028
- Household income
- $46,304
- Rent vs Own
- Severe rent burden
- 1516.0
Population outlook (Lauderdale County) Hauer SSP2
- Today (2025)
- 93,386 people
- By 2030
- 93,634 · +0.3%
- By 2040
- 93,114 · -0.3%
- By 2050
- 91,586 · -1.9%
- By 2075
- 88,667 · -5.1%
- By 2100
- 81,098 · -13.2%
Race, ethnicity, and origin ACS 2023
- Neighborhood character
- Predominantly White (70%)
- Race & ethnicity
- White 70% Black 18% Two or more races 6% Hispanic / Latino 6%
- Hispanic origin (detail)
- Mexican 5%
- Common ancestry
- Slovak 3% Serbian 2% Romanian 1%
- Foreign-born
- 4% · Canada, Vietnam, Guatemala
- Languages at home
- 92% English-only · Spanish 6% Vietnamese 1%
Political lean MEDSL · Lauderdale
- 2024 margin
- Solid R (+51.5) · D 23.8% · R 75.3%
- 2008→2024 swing
- -23.3pp toward R · 2008: -28.2pp · 2024: -51.5pp
- All cycles
- 2024: R+51.5 2020: R+44.7 2016: R+46.0 2012: R+30.9 2008: R+28.2
Not yet ingested
- Civics
- —
Market trends
- HPI YoY
- ▼ -104.78%
- Current HPI
- 206.1364
- Rent YoY
- ▲ 6.18%
- Metro
- Florence-Muscle Shoals, AL
- State GDP YoY
- ▲ 2.94%
- F500 in state
- 4
Industry mix (Fortune 500 HQ in AL)
| Industry | F500 HQs | Revenue |
|---|---|---|
| Financial Services | 1 | $8B |
|
||
| Healthcare | 1 | $5B |
|
||
Price history
+125.3% since first listed6 events — show timeline
- 2026-03-19 Listed $180,000 SAARMLS
- 2022-03-24 Sold (Public Records) $138,000 Public Records
- 2022-03-22 Sold (MLS) $138,000 SAARMLS
- 2021-12-15 Listed $149,900 SAARMLS
- 2010-12-09 Sold (MLS) $78,700 SAARMLS
- 2010-04-09 Listed $79,900 SAARMLS
Property tax history
+9.4%/yrLatest (2025): $1,321 · +7.0% YoY. Source: county tax records.
Cash-flow waterfall
monthlySold comps — $/sqft
last 12 mo · ≤1 miLoading sold comps…