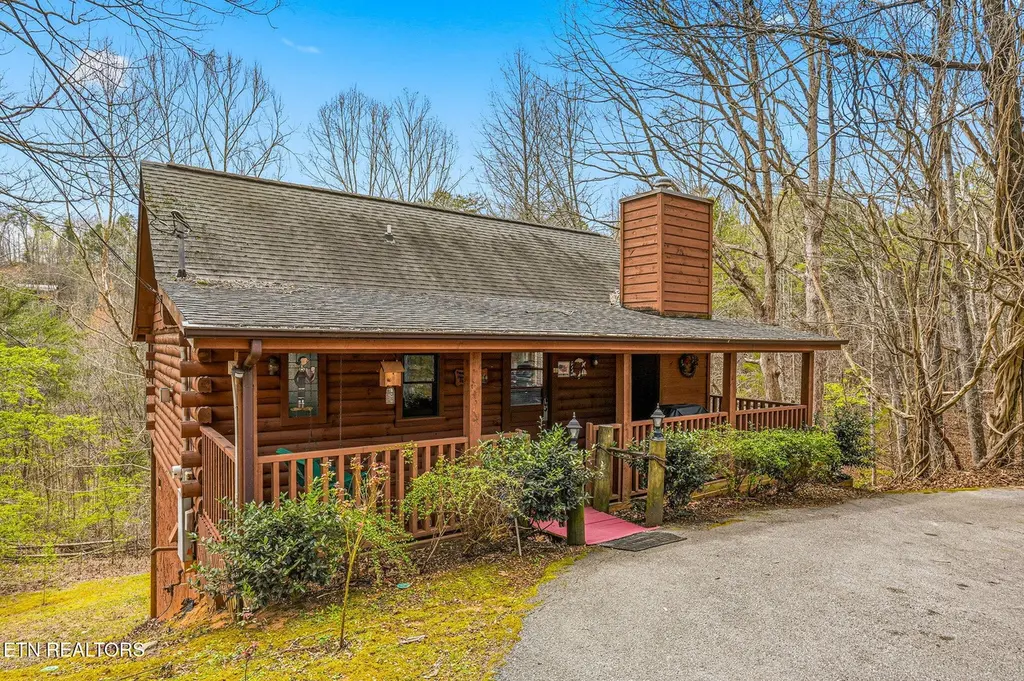
1645 S Mountain View Rd · Pigeon Forge, TN
Flood risk 6/10 · Moderate
- FEMA flood zone
- X (unshaded)
- Chance of flooding over 30 yrs
- 0.75%
- Est. flood insurance / yr
- $507 – $1,088
Fire risk 6/10 · Moderate
- Est. fire insurance / yr
- $949 – $1,763
Heat risk 5/10 · Moderate
- Hot days now (above 102°F)
- 7 days/yr
- Hot days in 30 yrs
- 22 days/yr
Wind risk 2/10 · Minimal
- Chance of severe wind over 30 yrs
- —
Air-quality risk 2/10 · Minimal
- Unhealthy air days now
- 1 days/yr
- Unhealthy air days in 30 yrs
- 1 days/yr
Risk factors via First Street. Map © Google.
Why this score? — see what drove the D- grade
The composite is a weighted blend of 9 inputs, each scored 0–100. Each bar is that input's sub-score; the figure is the points it added to the 100-point composite (weight × sub-score).
- ARV discount +15.0/15.0
- Appreciation +10.0/10.0
- Cash flow +3.8/30.0
- Livability +3.6/5.0
- Schools +2.5/10.0
- Condition / age +2.5/5.0
- Rent growth +1.9/5.0
- 1% rule +0.0/10.0
- DSCR +0.0/10.0
$349,000
🖨 Deal sheet (PDF) 📄 Offer letter ✓ Due diligence
Listing remarks MLS
Charming Mountain Retreat nestled in the Great Smoky Mountains! This fully furnished cabin features cathedral ceilings, an impressive great room with a cozy stone fireplace, an open layout, and a large wall of windows that flood the space with natural sunlight and frame a beautiful view of the serene outdoors. The fully stocked kitchen offers all appliances and a breakfast bar with seating. Just off the great room is the ensuite bedroom featuring a soaker tub with a jacuzzi, and a 2nd cozy gas fireplace. Access to the back screened-in porch is available from the bedroom and the main great room. You and your guests will love relaxing and taking in the peaceful views in the hot tub on the private screened-in back porch, as well as on the covered front porch. This lovely furnished mountain home has a zero-step entry, making it easily accessible for you and all your guests. So much to love about this home. Come see for yourself.
Key facts
- Mountain retreat
- Stone fireplace
- Great room
Tags
Neighborhood map
What this means for you Summary
Snapshot
- This is a 1-bed/2.0-bath single-family listed at $349k.
Deal economics
- At list price, monthly cash flow is $-1k ($-12k/yr) — negative.
- To cash-flow at today's rent, offer at most $170k (51.4% below list).
- To meet the 1% rule (rent ≥ 1% of price), the offer needs to be $133k (61.8% below list).
- Recommended offer: $133k (61.8% below list) — sets the bar for 1% rule.
- Cap rate 2.8% vs local median 1.1% in Pigeon Forge — top-decile yield for the area; either an underpriced asset or a hidden risk that comps aren't pricing in. Stress-test before assuming the spread holds.
Location & tenants
- Location reads 72/100 on livability (#36 in TN) — a middle-class / working-renter tenant base. Strengths: commute A+, cost of living A+, housing A+; Watch: employment C-, crime F.
- Sevier County (rural): math 31% / reading 28% proficiency, ranked #62 of 139 in TN (top 45%) — low school quality limits family demand, transient renter base, plan for 1-2y turnover.
- Zoned schools: New Center Elementary (math 32% / reading 28%, grade F, #415 of 952 statewide, top 44%, 855 students, 0% FRL); Seymour Junior High (math 40% / reading 30%, grade F, #65 of 333 statewide, top 20%, 766 students, 0% FRL); Sevier County High School (math 20% / reading 38%, grade F, #92 of 332 statewide, top 28%, 1,248 students, 0% FRL) — zoned schools average 0% FRL vs 52% district-wide (52 pts lower); this property's tenant base skews higher-income than the district average.
- Market conditions: Rents soft (-2.6%/yr); 1142 active listings in the ZIP; 1,594 units permitted in Sevier County in 2024 (456 in 5+ unit buildings).
Forward outlook
- In year one you build about $37k of equity ($2k loan paydown + $35k appreciation (10.0% local appreciation)).
- Sevier County population projected at +22% by 2050 — long-run rental-demand tailwind backs the buy-and-hold thesis.
- By year 2, paydown + projected appreciation supports a ~$60k cash-out refi (75% LTV) — recoverable capital for the next deal without selling this one.
Negotiation context
- It's been on market 89 days — a 6% lower offer ($328k) is reasonable based on typical stale-listing flexibility.
- 6 sale attempts since 6y ago; this cycle's ask has dropped $20k (5%) from the opening price — seller is motivated, your offer sets the floor, not the list.
Risks & watch-outs
- Climate carrying-cost: major flood risk; major wildfire risk; extreme-heat days projected 7→22/yr by 2055 (HVAC capex compounding) — expect insurance premiums to compound above CPI over the hold.
Questions for the listing agent
- What do current leases actually rent for vs. the listed asking? Can we see a recent rent roll and the last 12 months of T-12 income?
- It's been on market 89 days. Have you received any prior offers? Is the seller open to a 62% concession, seller financing, or rate buy-down credit?
- Why hasn't it sold? Are there any deal-killer items the seller is aware of (foundation, flood, title, zoning, code violations)?
- Is there a deadline driving the sale (1031 exchange, divorce, estate, relocation)? That informs how much negotiation room exists.
- Schools are F-rated, which usually means shorter tenancies and higher turnover. Who's the typical renter profile here, and what's been the actual vacancy rate?
- Crime grade is F in this area — have there been break-ins, vandalism, or insurance claims at this property in the last 3 years? What carrier currently insures it and at what premium?
- The area grade is low — what's the realistic commute time and amenity access for the typical tenant pool here? Any planned neighborhood developments (good or bad) we should know about?
- What's the average days-on-market for RENTAL listings here right now (not sales)? A rising rental-DOM trend means longer vacancies and softer asking-rent achievability than the comps imply.
- What's the recent tenant-quality profile in this submarket — average credit score on applications, eviction rate, late-payment / NSF rate, and stable-employment percentage? A property-management company in the area should have these aggregated.
- How much new for-sale + rental construction is in the pipeline within 1–3 miles? Heavy new supply typically softens prices + rents 12–24 months out; constrained supply supports both.
Investment metrics
- 1% rule
- 0.38% ✗
- Cap rate
- 2.80%
- Cash-on-cash
- -12.47%
- DSCR
- 0.45
- GRM
- 21.8
CMA / ARV
- ARV (median comp)
- $453,805
- List price
- $349,000
- Delta
- -23.09%
- Verdict
- UNDERPRICED
- Comps
- 20 within 1.0 mi
Show comp detail 12 sales within ~0.75 mi
| Address | Dist | Beds/Ba | Sqft | Sold | Price | $/sf | Match |
|---|---|---|---|---|---|---|---|
| 1776 Blue Ridge Rd. Rd | 0.34mi | 1/2.0 | 801 (+4%) | 12mo | $408,000 | $509 | 67 |
| 1712 Lake View Cir | 0.08mi | 1/1.0 | 840 (+9%) | 15mo | $385,000 | $458 | 64 |
| 1619 S S Mountain View Rd Rd | 0.14mi | 2/2.0 (+1) | 858 (+12%) | 6mo | $549,000 | $640 | 64 |
| 2319 Franke Hollow Rd | 0.28mi | 1/1.0 | 704 (-8%) | 6mo | $360,000 | $511 | 63 |
| 2319 Franke Hollow Rd | 0.28mi | 1/1.0 | 704 (-8%) | 6mo | $360,000 | $511 | 63 |
| 1618 Ridgecrest Dr | 0.33mi | 1/1.5 | 724 (-6%) | 18mo | $429,000 | $593 | 58 |
| 2339 Hidden Mountain Rd | 0.26mi | 1/1.0 | 864 (+12%) | 8mo | $270,000 | $313 | 56 |
| 1525 Walt Price Rd | 0.59mi | 1/1.0 | 836 (+9%) | 2mo | $349,000 | $417 | 52 |
| 1525 Walt Price Rd | 0.59mi | 1/1.0 | 836 (+9%) | 2mo | $349,000 | $417 | 52 |
| 1540 Walt Price Rd | 0.51mi | 2/2.0 (+1) | 848 (+10%) | 4mo | $290,000 | $342 | 50 |
| 2389 Misty Ln | 0.54mi | 1/1.0 | 672 (-12%) | 7mo | $330,000 | $491 | 44 |
| 2106 Memory Way | 0.73mi | 1/2.0 | 790 (+3%) | 22mo | $374,000 | $473 | 43 |
Match score weights: distance 35% · size 25% · config 20% · recency 20%. Top-matched comps best support the ARV.
Projected returns pro-forma
10.0% appreciation · 0.0% rent growth · sell at horizon
- IRR
- 15.1%
- Equity multiple
- 2.24×
- Total profit
- $121,313
- Equity at exit
- $314,407
- IRR
- 14.5%
- Equity multiple
- 5.10×
- Total profit
- $400,728
- Equity at exit
- $678,030
Cash invested: $97,720 (down + closing). Projections, not guarantees.
Landlord ↔ Tenant lean methodology
- Overall (STATE)
- 87 Strongly Landlord-Friendly
- State Tennessee
- 87 Strongly Landlord-Friendly · R+13
- County
- — inherits STATE
- City
- — inherits STATE
ZIP-level market 37876
- Home prices YoY
- 2.4%
- Rents YoY
- -2.6%
- Active inventory
- 1142
- Price-to-rent
- 21.8×
Monthly cashflow live
- Estimated rent
- $1,332 medium interval (Pro) →
- Mortgage (P&I)
- −$1,830
- Tax from tax record
- −$92 /mo · $1,105/yr
- Insurance
- −$145
- HOA
- −$0
- Vacancy / Maint / Mgmt
- −$280
- Net cashflow
- $-1,015
Break-even live
Sensitivity live
| Price | -10% $-818 | -5% $-917 | +0% $-1,015 | +5% $-1,114 | +10% $-1,213 |
|---|---|---|---|---|---|
| Rent | -10% $-1,121 | -5% $-1,068 | +0% $-1,015 | +5% $-963 | +10% $-910 |
| Rate | -1.0pp $-840 | -0.5pp $-927 | base $-1,015 | +0.5pp $-1,106 | +1.0pp $-1,198 |
UW: 25.0% down · 7.5% · 30yr · 1.5% tax · 5.0% vac · 8.0% maint · 8.0% mgmt
Financing live
Cash to close
- Down payment
- $87,250
- Closing costs
- $10,470
- Reserves months
- —
- Total cash needed
- —
Loan-product check · same deal, 3 products live
Conventional
25% down · 7.5% · 30yr
- Down + closing
- —
- Monthly P&I
- —
- Monthly cashflow
- —
- DSCR
- —
- Eligible?
- —
Personal DTI + credit; lowest rate.
DSCR
20% down · 8.5% · 30yr
- Down + closing
- —
- Monthly P&I
- —
- Monthly cashflow
- —
- DSCR
- —
- Eligible?
- —
No personal income docs; deal must DSCR.
Hard money
10% down · 12.0% · 12mo
- Down + closing
- —
- Monthly P&I
- —
- Monthly cashflow
- —
- DSCR
- —
- Eligible?
- —
Short-term bridge; refi at stabilization.
Listing history 35 events
-
2026-06-22days on market $349,000 Active 89 DOM
-
2026-06-19days on market $349,000 Active 87 DOM
-
2026-06-18days on market $349,000 Active 86 DOM
-
2026-06-17days on market $349,000 Active 85 DOM
-
2026-06-16days on market $349,000 Active 84 DOM
-
2026-06-15days on market $349,000 Active 83 DOM
-
2026-06-14days on market $349,000 Active 81 DOM
-
2026-06-13days on market $349,000 Active 80 DOM
-
2026-06-10days on market $349,000 Active 78 DOM
-
2026-06-09days on market $349,000 Active 77 DOM
-
2026-06-08days on market $349,000 Active 76 DOM
-
2026-06-07days on market $349,000 Active 75 DOM
-
2026-06-02days on market $349,000 Active 70 DOM
-
2026-06-01days on market $349,000 Active 69 DOM
-
2026-05-31days on market $349,000 Active 68 DOM
-
2026-05-30days on market $349,000 Active 67 DOM
-
2026-04-30price $349,000 939-char remark
Show marketing remark (939 chars)
Charming Mountain Retreat nestled in the Great Smoky Mountains! This fully furnished cabin features cathedral ceilings, an impressive great room with a cozy stone fireplace, an open layout, and a large wall of windows that flood the space with natural sunlight and frame a beautiful view of the serene outdoors. The fully stocked kitchen offers all appliances and a breakfast bar with seating. Just off the great room is the ensuite bedroom featuring a soaker tub with a jacuzzi, and a 2nd cozy gas fireplace. Access to the back screened-in porch is available from the bedroom and the main great room. You and your guests will love relaxing and taking in the peaceful views in the hot tub on the private screened-in back porch, as well as on the covered front porch. This lovely furnished mountain home has a zero-step entry, making it easily accessible for you and all your guests. So much to love about this home. Come see for yourself.
-
2026-03-24$369,000 Active 939-char remark
Show marketing remark (939 chars)
Charming Mountain Retreat nestled in the Great Smoky Mountains! This fully furnished cabin features cathedral ceilings, an impressive great room with a cozy stone fireplace, an open layout, and a large wall of windows that flood the space with natural sunlight and frame a beautiful view of the serene outdoors. The fully stocked kitchen offers all appliances and a breakfast bar with seating. Just off the great room is the ensuite bedroom featuring a soaker tub with a jacuzzi, and a 2nd cozy gas fireplace. Access to the back screened-in porch is available from the bedroom and the main great room. You and your guests will love relaxing and taking in the peaceful views in the hot tub on the private screened-in back porch, as well as on the covered front porch. This lovely furnished mountain home has a zero-step entry, making it easily accessible for you and all your guests. So much to love about this home. Come see for yourself.
-
2021-06-09soldstatus $340,000
-
2021-06-07soldstatus $340,000
-
2021-06-07soldstatus $340,000 Closed
-
2021-06-07soldstatus $340,000
-
2021-05-04historical Pending - Continue to Show
-
2021-03-28status Active
-
2021-03-12historical Pending - Continue to Show
-
2021-03-11status Active
-
2021-02-27historical Pending - Continue to Show
-
2021-02-26$350,000 Active
-
2021-02-09historical
-
2021-01-04price $345,000
-
2020-10-27price $318,000
-
2020-08-16price $297,000
-
2020-05-30$279,000 Active
-
2020-05-30$345,000
-
2015-05-21soldstatus $120,000
ⓘ Source: listings_history table (triggers on properties + properties_extension) + one-shot
backfill from property_details.listing_events for pre-trigger history.
Tax reassessment forecast TN · Resets to sale price
- Current annual tax
- $1,105 · $92/mo
- Projected year-2 tax
- $2,478 · $206/mo
- Expected delta
- +$1,373/yr (+$114/mo · 124.2%)
ⓘ Screening estimate from a state-policy table — verify with the county assessor before closing.
Climate risk First Street
- Flood 6/10 Major FEMA zone X (unshaded) · 75% chance over 30 yrs
- Wildfire 6/10 Major
- Heat 5/10 Major 7 d/yr ≥102°F today · 22 d/yr by 30 yrs out
- Wind 2/10 Low
- Air quality 2/10 Low 1 unhealthy d/yr today · 1 by 30 yrs out
Nearby sold comps map
Loading sold comps map…
Walkable amenities ~0.75 mi
Loading nearby amenities…
Taxation est. · year 1
- Rental income
- $15,985
- − Mortgage interest
- −$19,549
- − Property taxes
- −$1,105
- − Insurance
- −$1,745
- − Repairs & maintenance
- −$1,279
- − Management
- −$1,279
- − Depreciation
- −$10,153
- Taxable loss
- −$19,124
- Est. tax savings @ 24.0%
- +$4,590
- After-tax cash flow
- $-7,594/yr
For passive investors: Depreciation is non-cash, so a rental often shows a tax loss while cash-flowing — sheltering income. Rental losses are passive: they offset passive income freely, and up to $25,000/yr can offset ordinary (W-2) income if you actively participate and your MAGI is under $100k (phasing out to $0 by $150k); unused losses carry forward. On sale, claimed depreciation is recaptured at up to 25%, and gains may owe capital-gains tax (a 1031 exchange can defer both). Figures are a year-1 estimate at your 24.0% rate — not tax advice; consult a CPA.
Schools (NCES district)
- District
- Sevier County
- NCES district ID
- 4703780
- Math proficiency
- 31% ▼ -6.00%
- Reading proficiency
- 28% ▼ -4.00%
- Median HH income
- $42,730
- Composite
- 25.12/100
- National rank
- #7527
- State rank
- #62 of 139 in TN
Livability — Pigeon Forge
- Score
- 72/100
- State rank
- #36
- US rank
- #6327
Category grades
Schools grade is shown separately in the Schools card above.
Census & demographics
- County
- Sevier County · 80,402 people
- City population
- 21,767
- Metro
- Sevierville, TN
- Population (ZIP)
- 33,561
- Household income
- $58,277
- Rent vs Own
- Severe rent burden
- 611.0
Population outlook (Sevier County) Hauer SSP2
- Today (2025)
- 107,903 people
- By 2030
- 113,633 · +5.3%
- By 2040
- 123,969 · +14.9%
- By 2050
- 132,123 · +22.4%
- By 2075
- 148,524 · +37.6%
- By 2100
- 153,436 · +42.2%
Race, ethnicity, and origin ACS 2023
- Neighborhood character
- Predominantly White (89%)
- Race & ethnicity
- White 89% Hispanic / Latino 5% Two or more races 5% Black 1%
- Common ancestry
- Slovak 5% Serbian 4% Romanian 2%
- Foreign-born
- 3% · Canada
- Languages at home
- 95% English-only · Spanish 3% Russian/Polish/Slavic 1%
Political lean MEDSL · Sevier
- 2024 margin
- Solid R (+61.1) · D 18.9% · R 80.1% · Other 1.0%
- 2008→2024 swing
- -13.1pp toward R · 2008: -48.1pp · 2024: -61.1pp
- All cycles
- 2024: R+61.1 2020: R+57.6 2016: R+61.7 2012: R+54.8 2008: R+48.1
Not yet ingested
- Civics
- —
Market trends
- HPI YoY
- ▲ 11.06%
- Current HPI
- 477.19
- Rent YoY
- ▼ -2.57%
- Metro
- Sevierville, TN
- State GDP YoY
- ▲ 2.78%
- F500 in state
- 22
Industry mix (Fortune 500 HQ in TN)
| Industry | F500 HQs | Revenue |
|---|---|---|
| Healthcare | 3 | $91B |
|
||
| Retail | 3 | $72B |
|
||
| Transportation / Logistics | 1 | $88B |
|
||
| Paper / Packaging | 1 | $19B |
|
||
| Insurance | 1 | $13B |
|
||
| Energy | 1 | $12B |
|
||
Price history
+190.8% since first listed19 events — show timeline
- 2026-04-30 Price Changed $349,000 Knoxville MLS
- 2026-03-24 Listed $369,000 Knoxville MLS
- 2021-06-09 Sold (Public Records) $340,000 Public Records
- 2021-06-07 Sold (MLS) $340,000 REALTRACS as Distributed by MLS Grid
- 2021-06-07 Sold (MLS) $340,000 Knoxville MLS
- 2021-06-07 Sold (MLS) $340,000 GSMAR
- 2021-05-04 Contingent — Knoxville MLS
- 2021-03-28 Relisted — Knoxville MLS
- 2021-03-12 Contingent — Knoxville MLS
- 2021-03-11 Relisted — Knoxville MLS
- 2021-02-27 Contingent — Knoxville MLS
- 2021-02-26 Listed $350,000 Knoxville MLS
- 2021-02-09 Listing Removed — Knoxville MLS
- 2021-01-04 Price Changed $345,000 Knoxville MLS
- 2020-10-27 Price Changed $318,000 Knoxville MLS
- 2020-08-16 Price Changed $297,000 Knoxville MLS
- 2020-05-30 Listed $279,000 Knoxville MLS
- 2020-05-30 Listed $345,000 GSMAR
- 2015-05-21 Sold (MLS) $120,000 GSMAR
Property tax history
+6.6%/yrLatest (2025): $1,105 · +0.0% YoY. Source: county tax records.
Cash-flow waterfall
monthlySold comps — $/sqft
last 12 mo · ≤1 miLoading sold comps…