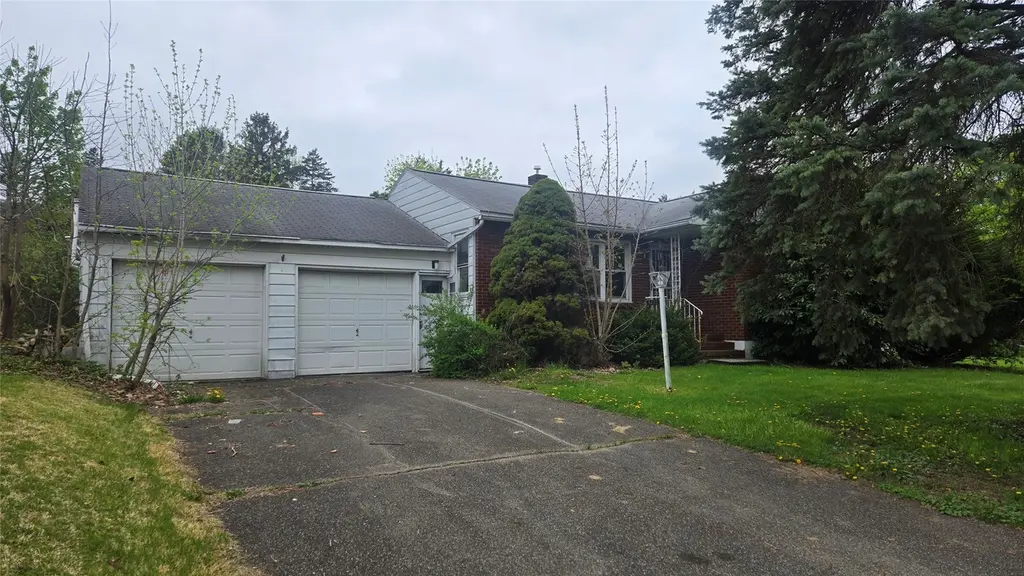
1211 Leona Ave · Endicott, NY
Flood risk 1/10 · Minimal
- FEMA flood zone
- X
- Chance of flooding over 30 yrs
- 0.0%
- Est. flood insurance / yr
- $473 – $860
Fire risk 2/10 · Minimal
- Est. fire insurance / yr
- $691 – $1,283
Heat risk 3/10 · Minor
- Hot days now (above 94°F)
- 7 days/yr
- Hot days in 30 yrs
- 16 days/yr
Wind risk 2/10 · Minimal
- Chance of severe wind over 30 yrs
- 1.0%
Air-quality risk 2/10 · Minimal
- Unhealthy air days now
- 0 days/yr
- Unhealthy air days in 30 yrs
- 1 days/yr
Risk factors via First Street. Map © Google.
Why this score? — see what drove the C- grade
The composite is a weighted blend of 9 inputs, each scored 0–100. Each bar is that input's sub-score; the figure is the points it added to the 100-point composite (weight × sub-score).
- ARV discount +15.0/15.0
- Cash flow +12.5/30.0
- 1% rule +6.1/10.0
- Rent growth +4.3/5.0
- Schools +4.3/10.0
- DSCR +3.7/10.0
- Livability +3.5/5.0
- Condition / age +2.5/5.0
- Appreciation +0.0/10.0
$129,800
🖨 Deal sheet (PDF) 📄 Offer letter ✓ Due diligence
Listing remarks
Home available again! Don't miss this opportunity! Don't pass up on this ranch in Endicott. Sitting on a corner lot, this home features 2 bedrooms and a bathroom, but extends out back with a large family room. The family room leads to a nice private lot.
Key facts
- Large family room
- Private lot
- Corner lot
Tags
Property features AI
Exterior
- Parking: Attached garage; 2 garage spaces
- Utilities: Public water; Public sewer
- Home design: Single family residence; Residential property
- Construction: Vinyl siding
- Exterior features: Covered porch; Level lot; Workshop
Interior
- Kitchen: Range; Free-standing range; Dishwasher; Refrigerator
- Flooring: Carpet; Vinyl
- Bathrooms: 1 full bathroom
- Heating & cooling: Forced air heating
- Interior features: Range; Dishwasher; Electric water heater; Free-standing range; Refrigerator; Carpet flooring; Vinyl flooring; Basement
- Laundry & utility: Electric water heater
Neighborhood map
What this means for you Summary
Snapshot
- This is a 2-bed/1.0-bath single-family listed at $130k.
Deal economics
- At list price, monthly cash flow is $-18 ($-216/yr) — negative.
- To cash-flow at today's rent, offer at most $127k (2.5% below list).
- Meets the 1% rule at list price ($1k rent vs $130k).
- Recommended offer: $127k (2.5% below list) — sets the bar for cash-flow.
Location & tenants
- Location reads 70/100 on livability (#438 in NY) — a middle-class / working-renter tenant base. Strengths: cost of living A+, health & safety A+, housing A; Watch: amenities D, crime F, commute F.
- Union-Endicott Central School District (suburban): math 43% / reading 57% proficiency, ranked #387 of 590 in NY (top 66%) — acceptable for families but not a draw, mixed tenant base, ~2y average lease.
- Zoned schools: Ann G Mcguinness Elementar School (math 37% / reading 47%, grade F, #1,361 of 2,108 statewide, top 67%, 317 students, 47% FRL); Jennie F Snapp Middle School (math 31% / reading 51%, grade F, #402 of 729 statewide, top 56%, 822 students, 65% FRL); Union-Endicott High School (math 91% / reading 90%, grade A+, #231 of 1,100 statewide, top 21%, 999 students, 41% FRL).
- Market conditions: Rents rising fast (+7.1%/yr); 217 active listings in the ZIP; 6 comparable units currently listed for rent nearby; rentals lingering (median 46d on market — plan ~5-8 weeks vacancy on turnover, expect pricing pressure); 67% of comp listings sitting > 30 days — soft ceiling on asking rent; 340 units permitted in Broome County in 2024 (269 in 5+ unit buildings).
Forward outlook
- Local home prices are declining (-3.0%/yr); year-one equity from $897 of loan paydown is wiped out by about $4k of value loss. Plan a longer hold.
- Broome County population projected at -13% by 2050 — secular population decline; favor cash flow + early exit over multi-decade hold.
Negotiation context
- It's been on market 22 days — a 2% lower offer ($128k) is reasonable based on typical stale-listing flexibility.
- 2 sale attempts with the ask held roughly flat each time — persistent listings suggest the price (not the market) is what's stuck; bring a comps-based counter.
- Current owner paid $75k; list at $130k implies a 73% gain — meaningful room to come down on a strong offer.
Risks & watch-outs
- Watch-outs: property tax is 3.9% of price; built in 1954 — expect roof / HVAC / electrical / plumbing capex.
Questions for the listing agent
- What do current leases actually rent for vs. the listed asking? Can we see a recent rent roll and the last 12 months of T-12 income?
- Built in 1954 — when were the roof, HVAC, electrical panel, plumbing, and water heater last replaced?
- Property tax is high relative to price — has the assessment been appealed recently, and will the sale trigger a re-assessment?
- Is there a deadline driving the sale (1031 exchange, divorce, estate, relocation)? That informs how much negotiation room exists.
- Schools are D-rated, which usually means shorter tenancies and higher turnover. Who's the typical renter profile here, and what's been the actual vacancy rate?
- Crime grade is F in this area — have there been break-ins, vandalism, or insurance claims at this property in the last 3 years? What carrier currently insures it and at what premium?
- What's the average days-on-market for RENTAL listings here right now (not sales)? A rising rental-DOM trend means longer vacancies and softer asking-rent achievability than the comps imply.
- What's the recent tenant-quality profile in this submarket — average credit score on applications, eviction rate, late-payment / NSF rate, and stable-employment percentage? A property-management company in the area should have these aggregated.
- How much new for-sale + rental construction is in the pipeline within 1–3 miles? Heavy new supply typically softens prices + rents 12–24 months out; constrained supply supports both.
Investment metrics
- 1% rule
- 1.11% ✓
- Cap rate
- 6.13%
- Cash-on-cash
- -0.59%
- DSCR
- 0.97
- GRM
- 7.5
CMA / ARV
- ARV (median comp)
- $191,389
- List price
- $129,800
- Delta
- -32.18%
- Verdict
- UNDERPRICED
- Comps
- 20 within 1.0 mi
Show comp detail 12 sales within ~0.75 mi
| Address | Dist | Beds/Ba | Sqft | Sold | Price | $/sf | Match |
|---|---|---|---|---|---|---|---|
| 720 Grant St | 0.11mi | 2/1.0 | 1,360 (-5%) | 9mo | $132,500 | $97 | 79 |
| 812 Morlando Dr | 0.33mi | 3/1.0 (+1) | 1,368 (-4%) | 5mo | $183,000 | $134 | 68 |
| 804 Glendale Dr | 0.37mi | 2/1.0 | 1,282 (-10%) | 7mo | $65,000 | $51 | 60 |
| 904 Day Hollow Rd | 0.32mi | 3/2.0 (+1) | 1,440 (+1%) | 20mo | $165,000 | $115 | 58 |
| 505 N Page Ave | 0.64mi | 3/1.0 (+1) | 1,364 (-5%) | 3mo | $158,500 | $116 | 55 |
| 923 Neal Rd | 0.59mi | 3/1.0 (+1) | 1,457 (+2%) | 14mo | $178,080 | $122 | 53 |
| 319 Birdsall St | 0.67mi | 3/1.5 (+1) | 1,414 (-1%) | 8mo | $135,000 | $95 | 53 |
| 913 Sarah Ln | 0.49mi | 3/1.5 (+1) | 1,509 (+5%) | 10mo | $125,000 | $83 | 53 |
| 1017 Day Hollow Rd | 0.74mi | 3/1.0 (+1) | 1,344 (-6%) | 1mo | $174,900 | $130 | 49 |
| 304 Birdsall St | 0.73mi | 3/1.5 (+1) | 1,536 (+7%) | 6mo | $150,000 | $98 | 42 |
| 961 Day Hollow Rd | 0.61mi | 3/2.0 (+1) | 1,542 (+8%) | 13mo | $180,250 | $117 | 39 |
| 401 Birdsall St | 0.67mi | 3/2.0 (+1) | 1,294 (-10%) | 16mo | $140,000 | $108 | 31 |
Match score weights: distance 35% · size 25% · config 20% · recency 20%. Top-matched comps best support the ARV.
Projected returns pro-forma
-3.0% appreciation · 7.09% rent growth · sell at horizon
- IRR
- -11.4%
- Equity multiple
- 0.56×
- Total profit
- $-15,821
- Equity at exit
- $19,354
- IRR
- 4.0%
- Equity multiple
- 1.36×
- Total profit
- $13,064
- Equity at exit
- $11,223
Cash invested: $36,344 (down + closing). Projections, not guarantees.
Landlord ↔ Tenant lean methodology
- Overall (STATE)
- 15 Strongly Tenant-Friendly
- State New York
- 15 Strongly Tenant-Friendly · D+10
- County
- — inherits STATE
- City
- — inherits STATE
ZIP-level market 13760
- Home prices YoY
- -32.7%
- Rents YoY
- 7.1%
- Active inventory
- 217
- Price-to-rent
- 7.5×
Monthly cashflow live
- Estimated rent
- $1,442 high interval (Pro) →
- Mortgage (P&I)
- −$681
- Tax from tax record
- −$422 /mo · $5,067/yr
- Insurance
- −$54
- HOA
- −$0
- Vacancy / Maint / Mgmt
- −$303
- Net cashflow
- $-18
Break-even live
Sensitivity live
| Price | -10% $55 | -5% $19 | +0% $-18 | +5% $-55 | +10% $-91 |
|---|---|---|---|---|---|
| Rent | -10% $-132 | -5% $-75 | +0% $-18 | +5% $39 | +10% $96 |
| Rate | -1.0pp $47 | -0.5pp $15 | base $-18 | +0.5pp $-52 | +1.0pp $-86 |
UW: 25.0% down · 7.5% · 30yr · 1.5% tax · 5.0% vac · 8.0% maint · 8.0% mgmt
Financing live
Cash to close
- Down payment
- $32,450
- Closing costs
- $3,894
- Reserves months
- —
- Total cash needed
- —
Loan-product check · same deal, 3 products live
Conventional
25% down · 7.5% · 30yr
- Down + closing
- —
- Monthly P&I
- —
- Monthly cashflow
- —
- DSCR
- —
- Eligible?
- —
Personal DTI + credit; lowest rate.
DSCR
20% down · 8.5% · 30yr
- Down + closing
- —
- Monthly P&I
- —
- Monthly cashflow
- —
- DSCR
- —
- Eligible?
- —
No personal income docs; deal must DSCR.
Hard money
10% down · 12.0% · 12mo
- Down + closing
- —
- Monthly P&I
- —
- Monthly cashflow
- —
- DSCR
- —
- Eligible?
- —
Short-term bridge; refi at stabilization.
Rent comps 6 comps
| Address | Beds | Baths | Sqft | Rent | $/sqft | DOM | Units | Dist |
|---|---|---|---|---|---|---|---|---|
| 1 Jane Lacey Dr Endicott, NY | 1.0–3.0 | 1.0–1.5 | 900 | $1,170 | $1.30 | 23d | 1 | 0.80mi |
| 723 Prescott Ave Endicott, NY | 3.0 | 2.0 | 1544 | $2,200 | $1.42 | 45d | 1 | 1.19mi |
| 804 Broad St Unit 2 Endicott, NY | 3.0 | 1.0 | 975 | $1,500 | $1.54 | 45d | 1 | 1.42mi |
| 1211 Pine St #1 Endicott, NY | 3.0 | 1.0 | 952 | $1,400 | $1.47 | 45d | 1 | 1.43mi |
| 507 Hill Ave Unit 1 Endicott, NY | 2.0 | 1.0 | 1072 | $1,450 | $1.35 | 45d | 1 | 1.43mi |
| 916 Irving Ave Unit 1 Endicott, NY | 2.0 | 1.0 | 1200 | $1,500 | $1.25 | 23d | 1 | 1.50mi |
Listing history 12 events
-
2026-06-22days on market $129,800 Active 22 DOM
-
2026-06-19days on market $129,800 Active 20 DOM
-
2026-06-18days on market $129,800 Active 19 DOM
-
2026-06-17days on market $129,800 Active 18 DOM
-
2026-06-16days on market $129,800 Active 17 DOM
-
2026-06-15days on market $129,800 Active 16 DOM
-
2026-06-14days on market $129,800 Active 14 DOM
-
2026-06-13remarks 258-char remark
-
2026-06-13status $129,800 Active 13 DOM
-
2026-05-12status Pending 203-char remark
-
2026-04-27$129,800 Active 203-char remark
-
2004-06-14soldstatus $75,000
ⓘ Source: listings_history table (triggers on properties + properties_extension) + one-shot
backfill from property_details.listing_events for pre-trigger history.
Tax reassessment forecast NY · Partial reset (capped growth)
- Current annual tax
- $5,067 · $422/mo
- Projected year-2 tax
- $5,067 · $422/mo
- Expected delta
- $0/yr ($0/mo · 0.0%)
ⓘ Screening estimate from a state-policy table — verify with the county assessor before closing.
Climate risk First Street
- Flood 1/10 Low FEMA zone X · 0% chance over 30 yrs
- Wildfire 2/10 Low
- Heat 3/10 Moderate 7 d/yr ≥94°F today · 16 d/yr by 30 yrs out
- Wind 2/10 Low 100% chance of damaging wind over 30 yrs
- Air quality 2/10 Low 0 unhealthy d/yr today · 1 by 30 yrs out
Nearby sold comps map
Loading sold comps map…
Walkable amenities ~0.75 mi
Loading nearby amenities…
Taxation est. · year 1
- Rental income
- $17,301
- − Mortgage interest
- −$7,271
- − Property taxes
- −$5,067
- − Insurance
- −$649
- − Repairs & maintenance
- −$1,384
- − Management
- −$1,384
- − Depreciation
- −$3,776
- Taxable loss
- −$2,230
- Est. tax savings @ 24.0%
- +$535
- After-tax cash flow
- $319/yr
For passive investors: Depreciation is non-cash, so a rental often shows a tax loss while cash-flowing — sheltering income. Rental losses are passive: they offset passive income freely, and up to $25,000/yr can offset ordinary (W-2) income if you actively participate and your MAGI is under $100k (phasing out to $0 by $150k); unused losses carry forward. On sale, claimed depreciation is recaptured at up to 25%, and gains may owe capital-gains tax (a 1031 exchange can defer both). Figures are a year-1 estimate at your 24.0% rate — not tax advice; consult a CPA.
Schools (NCES district)
- District
- Union-Endicott Central School District
- NCES district ID
- 3610710
- Math proficiency
- 43% ▼ -9.00%
- Reading proficiency
- 57% ▲ 11.00%
- Median HH income
- $49,265
- Composite
- 42.66/100
- National rank
- #3176
- State rank
- #387 of 590 in NY
Livability — Endicott
- Score
- 70/100
- State rank
- #438
- US rank
- #7657
Category grades
Schools grade is shown separately in the Schools card above.
Census & demographics
- County
- Broome County · 126,805 people
- City population
- 42,896
- Metro
- Binghamton, NY
- Population (ZIP)
- 42,896
- Household income
- $66,095
- Rent vs Own
- Severe rent burden
- 1480.0
Population outlook (Broome County) Hauer SSP2
- Today (2025)
- 187,989 people
- By 2030
- 183,066 · -2.6%
- By 2040
- 172,228 · -8.4%
- By 2050
- 163,161 · -13.2%
- By 2075
- 153,641 · -18.3%
- By 2100
- 140,851 · -25.1%
Race, ethnicity, and origin ACS 2023
- Neighborhood character
- Predominantly White (84%)
- Race & ethnicity
- White 84% Two or more races 7% Hispanic / Latino 6% Black 4% Asian 2%
- Hispanic origin (detail)
- Puerto Rican 2%
- Common ancestry
- Romanian 6% Lithuanian 2% Slovak 2%
- Foreign-born
- 5% · Canada, China
- Languages at home
- 94% English-only · Spanish 2% Other Indo-European 1% Russian/Polish/Slavic 1%
Political lean MEDSL · Broome
- 2024 margin
- Toss-up / Even · D 50.2% · R 49.8%
- 2008→2024 swing
- -7.6pp toward R · 2008: 8.0pp · 2024: 0.4pp
- All cycles
- 2024: D+0.4 2020: D+3.5 2016: R+3.7 2012: D+4.6 2008: D+8.0
Not yet ingested
- Civics
- —
Market trends
- HPI YoY
- ▼ -131.29%
- Current HPI
- 270.2661
- Rent YoY
- ▲ 7.09%
- Metro
- Binghamton, NY
- State GDP YoY
- ▲ 2.60%
- F500 in state
- 92
Industry mix (Fortune 500 HQ in NY)
| Industry | F500 HQs | Revenue |
|---|---|---|
| Financial Services | 10 | $950B |
|
||
| Consumer Goods | 9 | $162B |
|
||
| Insurance | 4 | $225B |
|
||
| Telecommunications | 2 | $144B |
|
||
| Pharmaceuticals | 2 | $112B |
|
||
| Media / Entertainment | 2 | $69B |
|
||
Price history
+73.1% since first listed4 events — show timeline
- 2026-06-12 Relisted — GBAOR
- 2026-05-12 Pending — GBAOR
- 2026-04-27 Listed $129,800 GBAOR
- 2004-06-14 Sold (Public Records) $75,000 Public Records
Property tax history
+7.4%/yrLatest (2025): $5,067 · +3.4% YoY. Source: county tax records.
Cash-flow waterfall
monthlySold comps — $/sqft
last 12 mo · ≤1 miLoading sold comps…