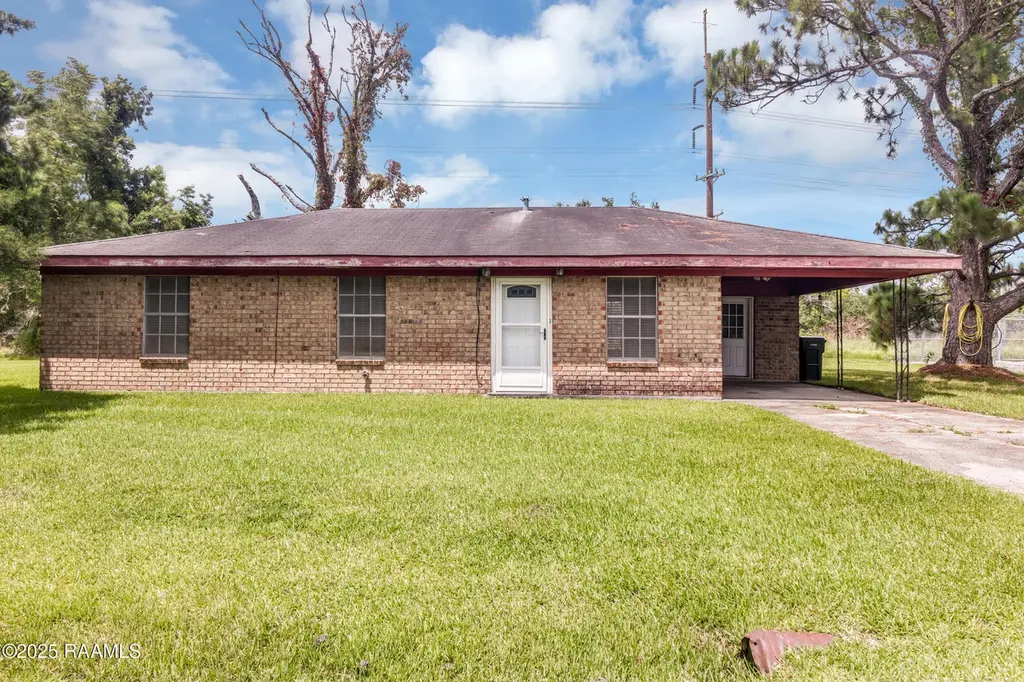
1102 Macho Grande St · New Iberia, LA
Flood risk 6/10 · Moderate
- FEMA flood zone
- A
- Chance of flooding over 30 yrs
- 0.69%
- Est. flood insurance / yr
- $1,009 – $1,996
Fire risk 1/10 · Minimal
- Est. fire insurance / yr
- $1,269 – $2,357
Heat risk 9/10 · Severe
- Hot days now (above 108°F)
- 7 days/yr
- Hot days in 30 yrs
- 21 days/yr
Wind risk 9/10 · Severe
- Chance of severe wind over 30 yrs
- 99.0%
Air-quality risk 2/10 · Minimal
- Unhealthy air days now
- 1 days/yr
- Unhealthy air days in 30 yrs
- 1 days/yr
Risk factors via First Street. Map © Google.
Why this score? — see what drove the B+ grade
The composite is a weighted blend of 9 inputs, each scored 0–100. Each bar is that input's sub-score; the figure is the points it added to the 100-point composite (weight × sub-score).
- Cash flow +30.0/30.0
- ARV discount +15.0/15.0
- DSCR +10.0/10.0
- 1% rule +9.9/10.0
- Livability +3.7/5.0
- Schools +3.2/10.0
- Rent growth +2.5/5.0
- Condition / age +2.5/5.0
- Appreciation +0.0/10.0
$110,000
🖨 Deal sheet (PDF) 📄 Offer letter ✓ Due diligence
Listing remarks MLS
Investor Special! 3 Bedroom 1 bath home in New Iberia with 1.46 acres on a dead end road.
Key facts
- 1.46 acre lot
- Parking
- Listed 317 days
Neighborhood map
What this means for you Summary
Snapshot
- This is a 3-bed/1.0-bath other listed at $110k.
Deal economics
- At list price, monthly cash flow is $527 ($6k/yr) — positive.
- The deal already cash-flows at list — no discount required.
- Meets the 1% rule at list price ($2k rent vs $110k).
- Recommended offer: $97k (12.0% below list) — sets the bar for market timing.
- Cap rate 13.4% vs local median 5.8% in New Iberia — top-decile yield for the area; either an underpriced asset or a hidden risk that comps aren't pricing in. Stress-test before assuming the spread holds.
Location & tenants
- Location reads 73/100 on livability (#33 in LA) — a middle-class / working-renter tenant base. Strengths: cost of living A+, housing A+, health & safety A+; Watch: commute D+, crime F, employment F.
- Iberia Parish (other): math 32% / reading 43% proficiency, ranked #27 of 98 in LA (top 28%) — families likely to look elsewhere, expect single-tenant / working-renter base with shorter leases; 66% free/reduced lunch — lower-income household profile, screen leases tightly.
- Market conditions: 237 active listings in the ZIP; 4 comparable units currently listed for rent nearby; rentals at typical pace (median 15d on market — plan ~3-4 weeks tenant-placement turnaround); 94 units permitted in Iberia Parish in 2024 (0 in 5+ unit buildings).
Forward outlook
- Local home prices are declining (-3.0%/yr); year-one equity from $761 of loan paydown is wiped out by about $3k of value loss. Plan a longer hold.
- Iberia County population projected to shrink 4% by 2050 — rents likely to lag national; underwrite the cash flow, not the appreciation.
- At projected returns (-3.0% appreciation + 3.0% rent growth), your $31k cash investment doubles in ~6 years — after that, you're playing with house money.
Negotiation context
- It's been on market 317 days — a 12% lower offer ($97k) is reasonable based on typical stale-listing flexibility.
- 3 sale attempts since 2y ago with the ask held roughly flat each time — persistent listings suggest the price (not the market) is what's stuck; bring a comps-based counter.
Risks & watch-outs
- Watch-outs: flood insurance adds $125/mo.
- Climate carrying-cost: in FEMA flood zone A (mandatory federal flood insurance); severe wind risk, 99% chance of damaging wind over 30y; extreme-heat days projected 7→21/yr by 2055 (HVAC capex compounding) — expect insurance premiums to compound above CPI over the hold.
Questions for the listing agent
- It's been on market 317 days. Have you received any prior offers? Is the seller open to a 12% concession, seller financing, or rate buy-down credit?
- What's the actual annual flood-insurance premium (NFIP or private), and is the property in a SFHA with mandatory coverage?
- Why hasn't it sold? Are there any deal-killer items the seller is aware of (foundation, flood, title, zoning, code violations)?
- Is there a deadline driving the sale (1031 exchange, divorce, estate, relocation)? That informs how much negotiation room exists.
- Schools are B-rated — typically a magnet for longer-tenancy family renters. What's the average tenant stay here, and is there a school-zone premium baked into asking?
- Crime grade is F in this area — have there been break-ins, vandalism, or insurance claims at this property in the last 3 years? What carrier currently insures it and at what premium?
- What's the average days-on-market for RENTAL listings here right now (not sales)? A rising rental-DOM trend means longer vacancies and softer asking-rent achievability than the comps imply.
- What's the recent tenant-quality profile in this submarket — average credit score on applications, eviction rate, late-payment / NSF rate, and stable-employment percentage? A property-management company in the area should have these aggregated.
- How much new for-sale + rental construction is in the pipeline within 1–3 miles? Heavy new supply typically softens prices + rents 12–24 months out; constrained supply supports both.
Investment metrics
- 1% rule
- 1.49% ✓
- Cap rate
- 13.41%
- Cash-on-cash
- 25.41%
- DSCR
- 2.13
- GRM
- 5.6
CMA / ARV
- ARV (median comp)
- $132,320
- List price
- $110,000
- Delta
- -16.87%
- Verdict
- UNDERPRICED
- Comps
- 20 within 1.0 mi
Projected returns pro-forma
-3.0% appreciation · 3.0% rent growth · sell at horizon
- IRR
- 12.9%
- Equity multiple
- 1.51×
- Total profit
- $15,774
- Equity at exit
- $16,401
- IRR
- 21.8%
- Equity multiple
- 2.85×
- Total profit
- $57,088
- Equity at exit
- $9,511
Cash invested: $30,800 (down + closing). Projections, not guarantees.
Landlord ↔ Tenant lean methodology
- Overall (STATE)
- 90 Strongly Landlord-Friendly
- State Louisiana
- 90 Strongly Landlord-Friendly · R+12
- County
- — inherits STATE
- City
- — inherits STATE
ZIP-level market 70560
- Home prices YoY
- -29.8%
- Active inventory
- 237
- Price-to-rent
- 5.6×
Monthly cashflow live
- Estimated rent
- $1,644 medium interval (Pro) →
- Mortgage (P&I)
- −$577
- Tax from tax record
- −$24 /mo · $286/yr
- Insurance
- −$46
- Flood insurance flood zone
- −$125 /mo · $1,502/yr
- HOA
- −$0
- Vacancy / Maint / Mgmt
- −$345
- Net cashflow
- $527
Break-even live
Sensitivity live
| Price | -10% $589 | -5% $558 | +0% $527 | +5% $496 | +10% $465 |
|---|---|---|---|---|---|
| Rent | -10% $397 | -5% $462 | +0% $527 | +5% $592 | +10% $657 |
| Rate | -1.0pp $582 | -0.5pp $555 | base $527 | +0.5pp $499 | +1.0pp $470 |
UW: 25.0% down · 7.5% · 30yr · 1.5% tax · 5.0% vac · 8.0% maint · 8.0% mgmt
Financing live
Cash to close
- Down payment
- $27,500
- Closing costs
- $3,300
- Reserves months
- —
- Total cash needed
- —
Loan-product check · same deal, 3 products live
Conventional
25% down · 7.5% · 30yr
- Down + closing
- —
- Monthly P&I
- —
- Monthly cashflow
- —
- DSCR
- —
- Eligible?
- —
Personal DTI + credit; lowest rate.
DSCR
20% down · 8.5% · 30yr
- Down + closing
- —
- Monthly P&I
- —
- Monthly cashflow
- —
- DSCR
- —
- Eligible?
- —
No personal income docs; deal must DSCR.
Hard money
10% down · 12.0% · 12mo
- Down + closing
- —
- Monthly P&I
- —
- Monthly cashflow
- —
- DSCR
- —
- Eligible?
- —
Short-term bridge; refi at stabilization.
Rent comps 4 comps
| Address | Beds | Baths | Sqft | Rent | $/sqft | DOM | Units | Dist |
|---|---|---|---|---|---|---|---|---|
| 211 San Jose St New Iberia, LA | 3.0 | 2.0 | 1397 | $1,595 | $1.14 | 14d | 1 | 0.72mi |
| 919 Russo St New Iberia, LA | 3.0 | 2.0 | 1520 | $1,800 | $1.18 | 22d | 1 | 0.95mi |
| 309 Springfield St New Iberia, LA | 3.0 | 2.0 | 1192 | $1,500 | $1.26 | 14d | 1 | 1.21mi |
| 2118 W Old Spanish Trl New Iberia, LA | 1.0–3.0 | 1.0–2.0 | 1013 | $1,708 | $1.69 | 14d | 23 | 1.45mi |
Listing history 23 events
-
2026-06-18days on market $110,000 Active 317 DOM
-
2026-06-17days on market $110,000 Active 316 DOM
-
2026-06-16days on market $110,000 Active 315 DOM
-
2026-06-15days on market $110,000 Active 314 DOM
-
2026-06-14days on market $110,000 Active 312 DOM
-
2026-06-13days on market $110,000 Active 311 DOM
-
2026-06-10days on market $110,000 Active 309 DOM
-
2026-06-09days on market $110,000 Active 308 DOM
-
2026-06-08days on market $110,000 Active 307 DOM
-
2026-06-07days on market $110,000 Active 306 DOM
-
2026-06-05days on market $110,000 Active 303 DOM
-
2026-06-03days on market $110,000 Active 302 DOM
-
2026-06-02days on market $110,000 Active 301 DOM
-
2026-06-01days on market $110,000 Active 300 DOM
-
2026-05-31days on market $110,000 Active 299 DOM
-
2026-05-30days on market $110,000 Active 298 DOM
-
2026-01-20status Active 90-char remark
Show marketing remark (90 chars)
Investor Special! 3 Bedroom 1 bath home in New Iberia with 1.46 acres on a dead end road.
-
2025-07-16$110,000 Active 90-char remark
Show marketing remark (90 chars)
Investor Special! 3 Bedroom 1 bath home in New Iberia with 1.46 acres on a dead end road.
-
2024-09-25price $145,000
-
2024-06-14price $155,000
-
2024-03-27price $160,000
-
2024-03-26$169,000 Active
-
1995-03-22soldstatus
ⓘ Source: listings_history table (triggers on properties + properties_extension) + one-shot
backfill from property_details.listing_events for pre-trigger history.
Tax reassessment forecast LA · Resets to sale price
- Current annual tax
- $286 · $24/mo
- Projected year-2 tax
- $605 · $50/mo
- Expected delta
- +$319/yr (+$27/mo · 111.6%)
ⓘ Screening estimate from a state-policy table — verify with the county assessor before closing.
Climate risk First Street
- Flood 6/10 Major FEMA zone A · 69% chance over 30 yrs
- Wildfire 1/10 Low
- Heat 9/10 Extreme 7 d/yr ≥108°F today · 21 d/yr by 30 yrs out
- Wind 9/10 Extreme 99% chance of damaging wind over 30 yrs
- Air quality 2/10 Low 1 unhealthy d/yr today · 1 by 30 yrs out
Nearby sold comps map
Loading sold comps map…
Walkable amenities ~0.75 mi
Loading nearby amenities…
Taxation est. · year 1
- Rental income
- $19,728
- − Mortgage interest
- −$6,162
- − Property taxes
- −$286
- − Insurance
- −$2,052
- − Repairs & maintenance
- −$1,578
- − Management
- −$1,578
- − Depreciation
- −$3,200
- Taxable income
- $4,871
- Est. tax owed @ 24.0%
- −$1,169
- After-tax cash flow
- $5,155/yr
For passive investors: Depreciation is non-cash, so a rental often shows a tax loss while cash-flowing — sheltering income. Rental losses are passive: they offset passive income freely, and up to $25,000/yr can offset ordinary (W-2) income if you actively participate and your MAGI is under $100k (phasing out to $0 by $150k); unused losses carry forward. On sale, claimed depreciation is recaptured at up to 25%, and gains may owe capital-gains tax (a 1031 exchange can defer both). Figures are a year-1 estimate at your 24.0% rate — not tax advice; consult a CPA.
Schools (NCES district)
- District
- Iberia Parish
- NCES district ID
- 2200720
- Math proficiency
- 32% ▼ -43.00%
- Reading proficiency
- 43% ▼ -35.00%
- Median HH income
- $43,289
- Composite
- 31.74/100
- National rank
- #5904
- State rank
- #27 of 98 in LA
Livability — New Iberia
- Score
- 73/100
- State rank
- #33
- US rank
- #5376
Category grades
Schools grade is shown separately in the Schools card above.
Census & demographics
- Population (ZIP)
- 37,589
Population outlook (Iberia County) Hauer SSP2
- Today (2025)
- 74,632 people
- By 2030
- 74,368 · -0.4%
- By 2040
- 73,223 · -1.9%
- By 2050
- 71,728 · -3.9%
- By 2075
- 69,028 · -7.5%
- By 2100
- 65,018 · -12.9%
Race, ethnicity, and origin ACS 2023
- Neighborhood character
- Diverse neighborhood (Simpson 0.61)
- Race & ethnicity
- White 52% Black 35% Two or more races 8% Hispanic / Latino 6% Asian 2%
- Hispanic origin (detail)
- Mexican 2%
- Common ancestry
- Lithuanian 11% Italian 1% Serbian 1%
- Foreign-born
- 3% · Canada
- Languages at home
- 93% English-only · French/Haitian/Cajun 3% Spanish 2% Other Asian/Pacific 1%
Political lean MEDSL · Iberia
- 2024 margin
- Solid R (+34.1) · D 32.4% · R 66.5% · Other 1.1%
- 2008→2024 swing
- -11.1pp toward R · 2008: -23.0pp · 2024: -34.1pp
- All cycles
- 2024: R+34.1 2020: R+31.2 2016: R+31.4 2012: R+26.2 2008: R+23.0
Not yet ingested
- Civics
- —
Market trends
- HPI YoY
- ▼ -65.82%
- Current HPI
- 154.9018
- Rent YoY
- —
- Metro
- —
- State GDP YoY
- ▲ 3.29%
- F500 in state
- 10
Industry mix (Fortune 500 HQ in LA)
| Industry | F500 HQs | Revenue |
|---|---|---|
| Telecommunications | 2 | $23B |
|
||
| Utilities | 1 | $12B |
|
||
| Wholesale / Distribution | 1 | $5B |
|
||
| Advertising | 1 | $2B |
|
||
Price history
-34.9% since first listed7 events — show timeline
- 2026-01-20 Relisted — AcadianaMLS
- 2025-07-16 Listed $110,000 AcadianaMLS
- 2024-09-25 Price Changed $145,000 AcadianaMLS
- 2024-06-14 Price Changed $155,000 AcadianaMLS
- 2024-03-27 Price Changed $160,000 AcadianaMLS
- 2024-03-26 Listed $169,000 AcadianaMLS
- 1995-03-22 Sold (Public Records) — Public Records
Property tax history
-5.0%/yrLatest (2025): $286 · +1.7% YoY. Source: county tax records.
Cash-flow waterfall
monthlySold comps — $/sqft
last 12 mo · ≤1 miLoading sold comps…