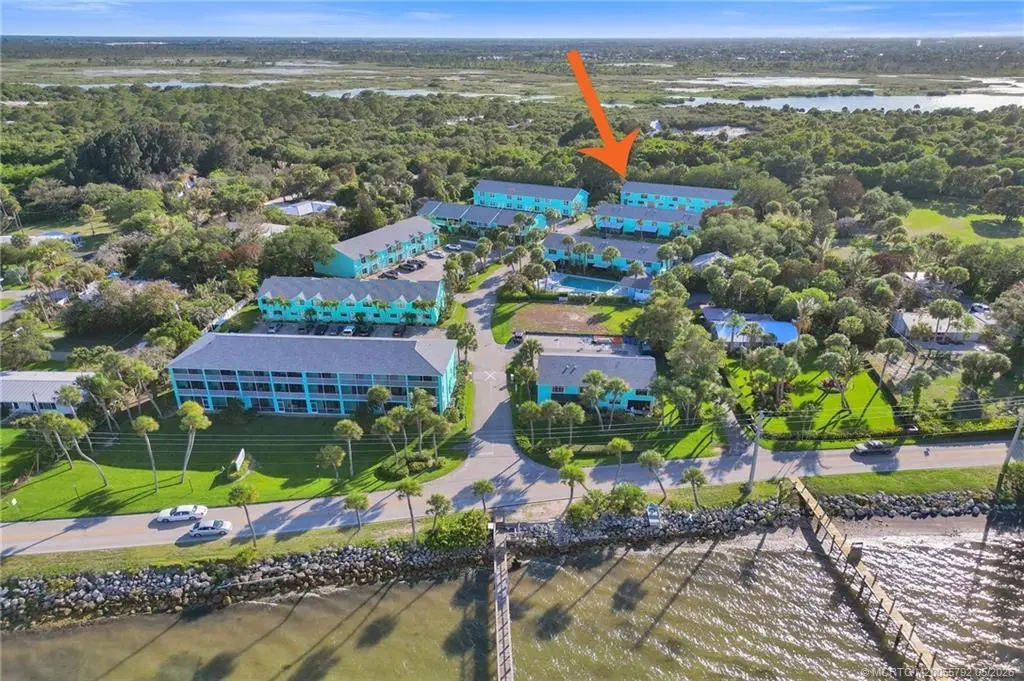
13513 S Indian River Dr · Port St. Lucie, FL
Flood risk 7/10 · Major
- FEMA flood zone
- X (unshaded)
- Chance of flooding over 30 yrs
- 0.94%
- Est. flood insurance / yr
- $507 – $1,088
Fire risk 2/10 · Minimal
- Est. fire insurance / yr
- $947 – $1,759
Heat risk 10/10 · Severe
- Hot days now (above 106°F)
- 7 days/yr
- Hot days in 30 yrs
- 23 days/yr
Wind risk 10/10 · Severe
- Chance of severe wind over 30 yrs
- 99.0%
Air-quality risk 2/10 · Minimal
- Unhealthy air days now
- 1 days/yr
- Unhealthy air days in 30 yrs
- 2 days/yr
Risk factors via First Street. Map © Google.
Why this score? — see what drove the D grade
The composite is a weighted blend of 9 inputs, each scored 0–100. Each bar is that input's sub-score; the figure is the points it added to the 100-point composite (weight × sub-score).
- Cash flow +12.8/30.0
- ARV discount +7.5/15.0
- 1% rule +6.9/10.0
- DSCR +3.8/10.0
- Condition / age +3.8/5.0
- Schools +3.7/10.0
- Rent growth +2.8/5.0
- Livability +2.5/5.0
- Appreciation +0.0/10.0
$225,999
🖨 Deal sheet (PDF) 📄 Offer letter ✓ Due diligence
Listing remarks
Here is a special one. Updated corner unit with extra privacy, no neighbor on one side, an additional window for natural light, and the only private patio in the entire development. Easy access to your designated spot with no tight turns, plus ample guest parking. The layout features the kitchen, living/family room, and a full bath downstairs. Upstairs holds two bedrooms and two full baths, including a primary suite with its own private bath. Don't worry about landscaping, garbage, high-speed internet, exterior insurance, and general exterior maintenance—all roofs were redone last year. The waterfront community is well-run, fully funded, and all maintenance is up to date. Beautiful gr
Key facts
- Waterfront community
- Private patio
- Designated spot
Tags
Property features AI
Finance
- Financial info: Pets allowed with number and size limits
- HOA & community: Homeowners association with monthly fee; Association fee includes common areas, cable TV, electricity, gas, insurance and internet; Community amenities include clubhouse, playground and pool; non-gated community
Exterior
- Utilities: Electricity connected (3-phase)
- Home design: Two-story property; Frame and stucco construction; Resale property
- Construction: Frame and stucco construction
- Exterior features: Cabana; Community pool; Community spa (in-ground); Waterfront property with bayfront and Intracoastal access, ocean access and no fixed bridges
Interior
- Bedrooms: Space for 2 bedrooms (bedrooms possible: 2)
- Bathrooms: Two full bathrooms; One half bathroom
- Heating & cooling: Central heating; Central air conditioning
- Interior features: Two-story interior; Ceiling fans
Neighborhood map
What this means for you Summary
Snapshot
- This is a 2-bed/2.5-bath condo listed at $226k. Condition is rated good.
Deal economics
- At list price, monthly cash flow is $-86 ($-1k/yr) — negative.
- To cash-flow at today's rent, offer at most $214k (5.5% below list).
- Meets the 1% rule at list price ($3k rent vs $226k).
- Recommended offer: $214k (5.5% below list) — sets the bar for cash-flow.
- Cap rate 6.2% vs local median 3.9% in Port St. Lucie — top-decile yield for the area; either an underpriced asset or a hidden risk that comps aren't pricing in. Stress-test before assuming the spread holds.
Location & tenants
- Location reads: area grade D — affects rentability + tenant quality, not the cash-flow math above.
- St. Lucie (urban): math 40% / reading 48% proficiency, ranked #51 of 73 in FL (top 70%) — families likely to look elsewhere, expect single-tenant / working-renter base with shorter leases.
- Zoned schools: Manatee Academy K-8 (math 53% / reading 51%, grade C-, #990 of 2,144 statewide, top 48%, 1,664 students, 65% FRL); Southern Oaks Middle School (math 39% / reading 43%, grade F, #353 of 571 statewide, top 63%, 894 students, 76% FRL); Fort Pierce Central High School (math 15% / reading 45%, grade F, #441 of 667 statewide, top 67%, 3,091 students, 62% FRL).
- Market conditions: Rents rising (+1.0%/yr); 538 active listings in the ZIP; 8 comparable units currently listed for rent nearby; rentals at typical pace (median 25d on market — plan ~3-4 weeks tenant-placement turnaround); 4,868 units permitted in St. Lucie County in 2024 (268 in 5+ unit buildings).
- At $2,681/mo this rent would consume 46% of the median local household income ($70k/yr) (locally 946% of renters already pay >50% of income on rent) — very limited rent-growth headroom before tenants either downsize or default.
Forward outlook
- Local home prices are declining (-3.0%/yr); year-one equity from $2k of loan paydown is wiped out by about $7k of value loss. Plan a longer hold.
- St. Lucie County population projected at +20% by 2050 — long-run rental-demand tailwind backs the buy-and-hold thesis.
Negotiation context
- It's been on market 25 days — a 2% lower offer ($223k) is reasonable based on typical stale-listing flexibility.
- 4 sale attempts since 22y ago with the ask held roughly flat each time — persistent listings suggest the price (not the market) is what's stuck; bring a comps-based counter.
- Current owner paid $120k; list at $226k implies a 88% gain — meaningful room to come down on a strong offer.
Risks & watch-outs
- Watch-outs: flood insurance adds $66/mo; HOA is 21% of rent.
- Climate carrying-cost: major flood risk; severe wind risk, 99% chance of damaging wind over 30y; extreme-heat days projected 7→23/yr by 2055 (HVAC capex compounding) — expect insurance premiums to compound above CPI over the hold.
Questions for the listing agent
- What do current leases actually rent for vs. the listed asking? Can we see a recent rent roll and the last 12 months of T-12 income?
- What's the actual annual flood-insurance premium (NFIP or private), and is the property in a SFHA with mandatory coverage?
- What does the HOA fee cover, when was the last increase, and are there any pending special assessments or reserve-fund shortfalls?
- Any open or pending special assessments — roof, HVAC, plumbing, elevator, façade? What's the per-unit balance and payoff schedule, and is the seller paying it off at close or rolling it to the buyer?
- Is there a deadline driving the sale (1031 exchange, divorce, estate, relocation)? That informs how much negotiation room exists.
- The area grade is low — what's the realistic commute time and amenity access for the typical tenant pool here? Any planned neighborhood developments (good or bad) we should know about?
- What's the average days-on-market for RENTAL listings here right now (not sales)? A rising rental-DOM trend means longer vacancies and softer asking-rent achievability than the comps imply.
- What's the recent tenant-quality profile in this submarket — average credit score on applications, eviction rate, late-payment / NSF rate, and stable-employment percentage? A property-management company in the area should have these aggregated.
- How much new apartment / multifamily construction is in the pipeline within 1–3 miles? Heavy new supply (>2% of stock underway) typically softens rents 12–24 months out; light construction supports rent growth.
Investment metrics
- 1% rule
- 1.19% ✓
- Cap rate
- 6.19%
- Cash-on-cash
- -0.38%
- DSCR
- 0.98
- GRM
- 7.0
CMA / ARV
No comps found within radius.
Projected returns pro-forma
-3.0% appreciation · 1.0% rent growth · sell at horizon
- IRR
- -22.0%
- Equity multiple
- 0.26×
- Total profit
- $-46,976
- Equity at exit
- $33,697
- IRR
- -24.5%
- Equity multiple
- -0.06×
- Total profit
- $-67,071
- Equity at exit
- $19,540
Cash invested: $63,280 (down + closing). Projections, not guarantees.
Landlord ↔ Tenant lean methodology
- Overall (STATE)
- 87 Strongly Landlord-Friendly
- State Florida
- 87 Strongly Landlord-Friendly · R+3
- County
- — inherits STATE
- City
- — inherits STATE
ZIP-level market 34957
- Rents YoY
- 1.0%
- Active inventory
- 538
- Price-to-rent
- 7.0×
Monthly cashflow live
- Estimated rent
- $2,681 high interval (Pro) →
- Mortgage (P&I)
- −$1,185
- Tax est. 1.5%
- −$282 /mo · $3,390/yr
- Insurance
- −$94
- Flood insurance flood zone
- −$66 /mo · $798/yr
- HOA
- −$576
- Vacancy / Maint / Mgmt
- −$563
- Net cashflow
- $-86
Break-even live
Sensitivity live
| Price | -10% $70 | -5% $-8 | +0% $-86 | +5% $-164 | +10% $-243 |
|---|---|---|---|---|---|
| Rent | -10% $-298 | -5% $-192 | +0% $-86 | +5% $20 | +10% $125 |
| Rate | -1.0pp $27 | -0.5pp $-29 | base $-86 | +0.5pp $-145 | +1.0pp $-204 |
UW: 25.0% down · 7.5% · 30yr · 1.5% tax · 5.0% vac · 8.0% maint · 8.0% mgmt
Financing live
Cash to close
- Down payment
- $56,500
- Closing costs
- $6,780
- Reserves months
- —
- Total cash needed
- —
Loan-product check · same deal, 3 products live
Conventional
25% down · 7.5% · 30yr
- Down + closing
- —
- Monthly P&I
- —
- Monthly cashflow
- —
- DSCR
- —
- Eligible?
- —
Personal DTI + credit; lowest rate.
DSCR
20% down · 8.5% · 30yr
- Down + closing
- —
- Monthly P&I
- —
- Monthly cashflow
- —
- DSCR
- —
- Eligible?
- —
No personal income docs; deal must DSCR.
Hard money
10% down · 12.0% · 12mo
- Down + closing
- —
- Monthly P&I
- —
- Monthly cashflow
- —
- DSCR
- —
- Eligible?
- —
Short-term bridge; refi at stabilization.
Rent comps 8 comps
| Address | Beds | Baths | Sqft | Rent | $/sqft | DOM | Units | Dist |
|---|---|---|---|---|---|---|---|---|
| 1150 NE County Line Rd Jensen Beach, FL | 3.0 | 2.0 | 1306 | $2,400 | $1.84 | 25d | 1 | 0.56mi |
| 4215 NE Carrol Ct Jensen Beach, FL | 2.0 | 1.0 | 1304 | $3,300 | $2.53 | 25d | 1 | 1.06mi |
| 4220 NE Indian River Dr #2 Jensen Beach, FL | 2.0 | 1.5 | 900 | $2,200 | $2.44 | 25d | 1 | 1.16mi |
| 1161 Nettles Blvd Unit 1546132P Jensen Beach, FL | 2.0 | 2.0 | 710 | $4,838 | $6.81 | 15d | 1 | 1.33mi |
| 1077 Nettles Blvd Jensen Beach, FL | 2.0 | 2.0 | 854 | $3,500 | $4.10 | 15d | 1 | 1.36mi |
| 3663 NE Barbara Dr Jensen Beach, FL | 2.0 | 1.0 | 991 | $2,450 | $2.47 | 25d | 1 | 1.46mi |
| 13 Nettles Blvd Jensen Beach, FL | 2.0 | 2.0 | 730 | $4,400 | $6.03 | 25d | 1 | 1.49mi |
| 1315 NE Flora Pl Jensen Beach, FL | 3.0 | 2.0 | 1400 | $3,000 | $2.14 | 25d | 1 | 1.50mi |
HOA detail condo
- Monthly dues
- $576 · $6,912/yr
- Likely covers
- watertrashinternetlandscapingexterior maint.
- Assessments
- None detected in remarks — confirm with the listing agent.
Listing history 27 events
-
2026-06-21days on market $225,999 Active 25 DOM
-
2026-06-18days on market $225,999 Active 22 DOM
-
2026-06-17days on market $225,999 Active 21 DOM
-
2026-06-16days on market $225,999 Active 20 DOM
-
2026-06-15price $225,999 Active 19 DOM
-
2026-06-15days on market $226,000 Active 19 DOM
-
2026-06-14days on market $226,000 Active 17 DOM
-
2026-06-13pricedays on market $226,000 Active 16 DOM
-
2026-06-10days on market $234,995 Active 14 DOM
-
2026-06-09days on market $234,995 Active 13 DOM
-
2026-06-09price $234,995 Active 12 DOM
-
2026-06-08days on market $234,997 Active 12 DOM
-
2026-06-07days on market $234,997 Active 11 DOM
-
2026-06-05days on market $234,997 Active 8 DOM
-
2026-06-03days on market $234,997 Active 7 DOM
-
2026-06-02days on market $234,997 Active 6 DOM
-
2026-06-01days on market $234,997 Active 5 DOM
-
2026-05-31days on market $234,997 Active 4 DOM
-
2026-05-30days on market $234,997 Active 3 DOM
-
2026-05-29price $234,997
-
2026-05-27$234,998 Active
-
2014-11-21historical
-
2013-11-21$104,400
-
2007-12-26historical
-
2007-07-28$165,000
-
2004-04-09soldstatus $119,900
-
2004-02-11$119,900
ⓘ Source: listings_history table (triggers on properties + properties_extension) + one-shot
backfill from property_details.listing_events for pre-trigger history.
Climate risk First Street
- Flood 7/10 Severe FEMA zone X (unshaded) · 94% chance over 30 yrs
- Wildfire 2/10 Low
- Heat 10/10 Extreme 7 d/yr ≥106°F today · 23 d/yr by 30 yrs out
- Wind 10/10 Extreme 99% chance of damaging wind over 30 yrs
- Air quality 2/10 Low 1 unhealthy d/yr today · 2 by 30 yrs out
Nearby sold comps map
Loading sold comps map…
Walkable amenities ~0.75 mi
Loading nearby amenities…
Taxation est. · year 1
- Rental income
- $32,171
- − Mortgage interest
- −$12,659
- − Property taxes
- −$3,390
- − Insurance
- −$1,927
- − Repairs & maintenance
- −$2,574
- − Management
- −$2,574
- − HOA
- −$6,912
- − Depreciation
- −$6,575
- Taxable loss
- −$4,440
- Est. tax savings @ 24.0%
- +$1,066
- After-tax cash flow
- $29/yr
For passive investors: Depreciation is non-cash, so a rental often shows a tax loss while cash-flowing — sheltering income. Rental losses are passive: they offset passive income freely, and up to $25,000/yr can offset ordinary (W-2) income if you actively participate and your MAGI is under $100k (phasing out to $0 by $150k); unused losses carry forward. On sale, claimed depreciation is recaptured at up to 25%, and gains may owe capital-gains tax (a 1031 exchange can defer both). Figures are a year-1 estimate at your 24.0% rate — not tax advice; consult a CPA.
Condition & rehab AI · 12 photos
This corner unit is in good condition with cosmetic updates needed, particularly in the kitchen and flooring. The private patio and waterfront access make it a special find.
Repairs flagged
- Minor kitchen cabinets — dated and could be replaced
- Minor kitchen countertops — could be updated
Value-add opportunities
- Resale update kitchen cabinets and countertops — modernizing the kitchen would appeal to buyers
- Resale paint interior walls — fresh paint can make a significant difference in a home's appearance
- Both update flooring — new flooring would improve both resale and rental value
Renovation cost estimate screening
| Repair item | Severity | Est. cost |
|---|---|---|
| kitchen cabinets · dated and could be replaced | Minor | $500–3,000 |
| kitchen countertops · could be updated | Minor | $500–3,000 |
| Total estimated repair cost · 2 items | $1,000–6,000 |
Value-add ROI direction
- Resale update kitchen cabinets and countertops — modernizing the kitchen would appeal to buyers ↑
- Resale paint interior walls — fresh paint can make a significant difference in a home's appearance ↑
- Both update flooring — new flooring would improve both resale and rental value ↑
ⓘ Cost ranges are severity-bucket heuristics (US national rule-of-thumb). Get contractor quotes + a written scope before underwriting a rehab budget.
Schools (NCES district)
- District
- St. Lucie
- NCES district ID
- 1201770
- Math proficiency
- 40% ▼ -11.00%
- Reading proficiency
- 48% ▼ -4.00%
- Median HH income
- $44,737
- Composite
- 37.28/100
- National rank
- #4449
- State rank
- #51 of 73 in FL
Livability — Port St. Lucie
No livability data for this city. (Only ~50 U.S. cities are tracked.)
Census & demographics
- County
- Martin County · 165,223 people
- City population
- 221,051
- Metro
- Port St. Lucie, FL
- Population (ZIP)
- 23,462
- Household income
- $70,403
- Rent vs Own
- Severe rent burden
- 946.0
Population outlook (St. Lucie County) Hauer SSP2
- Today (2025)
- 338,016 people
- By 2030
- 355,687 · +5.2%
- By 2040
- 385,521 · +14.1%
- By 2050
- 406,106 · +20.1%
- By 2075
- 441,054 · +30.5%
- By 2100
- 436,885 · +29.2%
Race, ethnicity, and origin ACS 2023
- Neighborhood character
- Predominantly White (85%)
- Race & ethnicity
- White 85% Hispanic / Latino 7% Two or more races 6% Asian 2% Black 2%
- Hispanic origin (detail)
- Mexican 1% Puerto Rican 2% Cuban 1%
- Common ancestry
- Romanian 4% Slovak 3% Lithuanian 3%
- Foreign-born
- 10% · Canada, Jamaica
- Languages at home
- 90% English-only · Spanish 5% Other Indo-European 2% Tagalog/Filipino 1%
Political lean MEDSL · St. Lucie
- 2024 margin
- Lean R (+9.1) · D 45.1% · R 54.2%
- 2008→2024 swing
- -21.2pp toward R · 2008: 12.1pp · 2024: -9.1pp
- All cycles
- 2024: R+9.1 2020: R+1.6 2016: R+2.5 2012: D+7.9 2008: D+12.1
Not yet ingested
- Civics
- —
Market trends
- HPI YoY
- ▼ -319.66%
- Current HPI
- 340.0172
- Rent YoY
- ▲ 1.00%
- Metro
- Port St. Lucie, FL
- State GDP YoY
- ▲ 3.28%
- F500 in state
- 36
Industry mix (Fortune 500 HQ in FL)
| Industry | F500 HQs | Revenue |
|---|---|---|
| Industrial Technology | 2 | $29B |
|
||
| Insurance | 2 | $17B |
|
||
| Retail | 1 | $60B |
|
||
| Technology Distribution | 1 | $58B |
|
||
| Homebuilding | 1 | $35B |
|
||
| Technology Manufacturing | 1 | $35B |
|
||
Price history
+96.0% since first listed8 events — show timeline
- 2026-05-29 Price Changed $234,997 MCRTC
- 2026-05-27 Listed $234,998 MCRTC
- 2014-11-21 Listing Removed — MCRTC
- 2013-11-21 Listed $104,400 MCRTC
- 2007-12-26 Listing Removed — Beaches MLS
- 2007-07-28 Listed $165,000 Beaches MLS
- 2004-04-09 Sold (MLS) $119,900 MCRTC
- 2004-02-11 Listed $119,900 MCRTC
Cash-flow waterfall
monthlySold comps — $/sqft
last 12 mo · ≤1 miLoading sold comps…