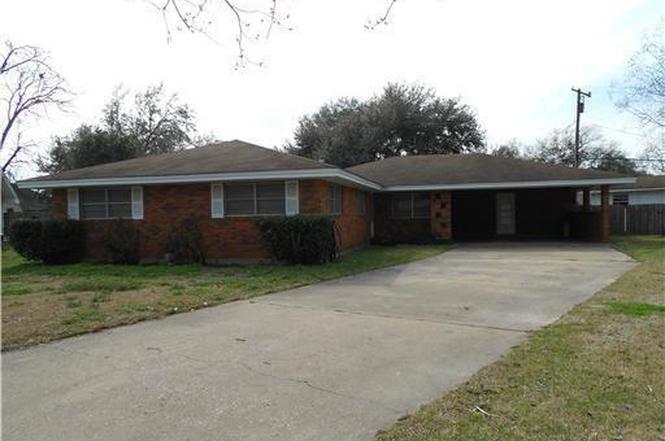
716 Highpoint Cir · Alexandria, LA
Flood risk 1/10 · Minimal
- FEMA flood zone
- X (shaded)
- Chance of flooding over 30 yrs
- 0.0%
- Est. flood insurance / yr
- $507 – $1,088
Fire risk 1/10 · Minimal
- Est. fire insurance / yr
- $1,269 – $2,357
Heat risk 8/10 · Major
- Hot days now (above 111°F)
- 7 days/yr
- Hot days in 30 yrs
- 19 days/yr
Wind risk 8/10 · Major
- Chance of severe wind over 30 yrs
- 98.0%
Air-quality risk 2/10 · Minimal
- Unhealthy air days now
- 1 days/yr
- Unhealthy air days in 30 yrs
- 1 days/yr
Risk factors via First Street. Map © Google.
Why this score? — see what drove the D+ grade
The composite is a weighted blend of 9 inputs, each scored 0–100. Each bar is that input's sub-score; the figure is the points it added to the 100-point composite (weight × sub-score).
- Cash flow +15.8/30.0
- ARV discount +13.9/15.0
- DSCR +4.9/10.0
- 1% rule +4.1/10.0
- Livability +3.2/5.0
- Schools +3.1/10.0
- Rent growth +2.5/5.0
- Condition / age +2.5/5.0
- Appreciation +0.0/10.0
$155,000
🖨 Deal sheet (PDF) 📄 Offer letter ✓ Due diligence
Listing remarks
NICE AFFORDABLE 4 BEDROOM HOME IN NICE LOCATION CONVENIENT TO SHOPPING WITH INGROUD POOLBEAUTIFUL LOT, AND STORAGE.
Key facts
- 0.36 acre lot
- Parking
- Pool
Neighborhood map
What this means for you Summary
Snapshot
- This is a 3-bed/2.0-bath single-family listed at $155k.
Deal economics
- At list price, monthly cash flow is $71 ($849/yr) — positive.
- The deal already cash-flows at list — no discount required.
- To meet the 1% rule (rent ≥ 1% of price), the offer needs to be $141k (9.2% below list).
- Recommended offer: $141k (9.2% below list) — sets the bar for 1% rule.
- Cap rate 6.8% vs local median 4.8% in Alexandria — top-decile yield for the area; either an underpriced asset or a hidden risk that comps aren't pricing in. Stress-test before assuming the spread holds.
Location & tenants
- Location reads 64/100 on livability (#160 in LA) — a middle-class / working-renter tenant base. Strengths: cost of living A+, housing A+, health & safety A+; Watch: crime F, amenities F, commute F.
- Rapides Parish (urban): math 29% / reading 44% proficiency, ranked #31 of 98 in LA (top 32%) — families likely to look elsewhere, expect single-tenant / working-renter base with shorter leases; 64% free/reduced lunch — lower-income household profile, screen leases tightly.
- Market conditions: 177 active listings in the ZIP; 3 comparable units currently listed for rent nearby; rentals lingering (median 46d on market — plan ~5-8 weeks vacancy on turnover, expect pricing pressure); 100% of comp listings sitting > 30 days — soft ceiling on asking rent; 239 units permitted in Rapides Parish in 2024 (0 in 5+ unit buildings).
Forward outlook
- Local home prices are declining (-3.0%/yr); year-one equity from $1k of loan paydown is wiped out by about $5k of value loss. Plan a longer hold.
- Rapides County population projected to shrink 6% by 2050 — rents likely to lag national; underwrite the cash flow, not the appreciation.
Negotiation context
- It's been on market 75 days — a 6% lower offer ($146k) is reasonable based on typical stale-listing flexibility.
- 2 sale attempts since 12y ago; this cycle's ask is 4% above the opening price — seller raised mid-cycle; expect resistance to lowballs.
Risks & watch-outs
- Climate carrying-cost: severe wind risk, 98% chance of damaging wind over 30y; extreme-heat days projected 7→19/yr by 2055 (HVAC capex compounding) — expect insurance premiums to compound above CPI over the hold.
Questions for the listing agent
- It's been on market 75 days. Have you received any prior offers? Is the seller open to a 9% concession, seller financing, or rate buy-down credit?
- Why hasn't it sold? Are there any deal-killer items the seller is aware of (foundation, flood, title, zoning, code violations)?
- Is there a deadline driving the sale (1031 exchange, divorce, estate, relocation)? That informs how much negotiation room exists.
- Crime grade is F in this area — have there been break-ins, vandalism, or insurance claims at this property in the last 3 years? What carrier currently insures it and at what premium?
- The area grade is low — what's the realistic commute time and amenity access for the typical tenant pool here? Any planned neighborhood developments (good or bad) we should know about?
- What's the average days-on-market for RENTAL listings here right now (not sales)? A rising rental-DOM trend means longer vacancies and softer asking-rent achievability than the comps imply.
- What's the recent tenant-quality profile in this submarket — average credit score on applications, eviction rate, late-payment / NSF rate, and stable-employment percentage? A property-management company in the area should have these aggregated.
- How much new for-sale + rental construction is in the pipeline within 1–3 miles? Heavy new supply typically softens prices + rents 12–24 months out; constrained supply supports both.
Investment metrics
- 1% rule
- 0.91% ✗
- Cap rate
- 6.84%
- Cash-on-cash
- 1.96%
- DSCR
- 1.09
- GRM
- 9.2
CMA / ARV
- ARV (on-the-fly)
- $180,684
- Comps found
- 6
Show comp detail 6 sales within ~0.75 mi
| Address | Dist | Beds/Ba | Sqft | Sold | Price | $/sf | Match |
|---|---|---|---|---|---|---|---|
| 536 Bob White Ln | 0.13mi | 3/1.5 | 1,295 (-10%) | 1mo | $159,000 | $123 | 75 |
| 4916 Bluebird Ln | 0.28mi | 3/2.0 | 1,596 (+11%) | 3mo | $175,000 | $110 | 66 |
| 505 Highpoint Dr | 0.25mi | 3/2.0 | 1,568 (+9%) | 16mo | $200,000 | $128 | 59 |
| 301 Ragan Dr | 0.62mi | 3/2.0 | 1,521 (+6%) | 3mo | $209,900 | $138 | 59 |
| 5604 Sarah Constant Ct | 0.53mi | 3/2.0 | 1,254 (-13%) | 2mo | $158,000 | $126 | 53 |
| 6012 Esterwood Dr | 0.68mi | 4/2.0 (+1) | 1,600 (+12%) | 2mo | $173,000 | $108 | 42 |
Match score weights: distance 35% · size 25% · config 20% · recency 20%. Top-matched comps best support the ARV.
Projected returns pro-forma
-3.0% appreciation · 3.0% rent growth · sell at horizon
- IRR
- -13.2%
- Equity multiple
- 0.53×
- Total profit
- $-20,607
- Equity at exit
- $23,111
- IRR
- -4.2%
- Equity multiple
- 0.72×
- Total profit
- $-12,129
- Equity at exit
- $13,402
Cash invested: $43,400 (down + closing). Projections, not guarantees.
Landlord ↔ Tenant lean methodology
- Overall (STATE)
- 90 Strongly Landlord-Friendly
- State Louisiana
- 90 Strongly Landlord-Friendly · R+12
- County
- — inherits STATE
- City
- — inherits STATE
ZIP-level market 71303
- Home prices YoY
- -29.8%
- Active inventory
- 177
- Price-to-rent
- 9.2×
Monthly cashflow live
- Estimated rent
- $1,407 medium interval (Pro) →
- Mortgage (P&I)
- −$813
- Tax from tax record
- −$163 /mo · $1,962/yr
- Insurance
- −$65
- HOA
- −$0
- Lot rent
- −$0
- Vacancy / Maint / Mgmt
- −$296
- Net cashflow
- $71
Break-even live
Sensitivity live
| Price | -10% $159 | -5% $115 | +0% $71 | +5% $27 | +10% $-17 |
|---|---|---|---|---|---|
| Rent | -10% $-40 | -5% $15 | +0% $71 | +5% $126 | +10% $182 |
| Rate | -1.0pp $149 | -0.5pp $110 | base $71 | +0.5pp $31 | +1.0pp $-10 |
UW: 25.0% down · 7.5% · 30yr · 1.5% tax · 5.0% vac · 8.0% maint · 8.0% mgmt
Financing live
Cash to close
- Down payment
- $38,750
- Closing costs
- $4,650
- Reserves months
- —
- Total cash needed
- —
Loan-product check · same deal, 3 products live
Conventional
25% down · 7.5% · 30yr
- Down + closing
- —
- Monthly P&I
- —
- Monthly cashflow
- —
- DSCR
- —
- Eligible?
- —
Personal DTI + credit; lowest rate.
DSCR
20% down · 8.5% · 30yr
- Down + closing
- —
- Monthly P&I
- —
- Monthly cashflow
- —
- DSCR
- —
- Eligible?
- —
No personal income docs; deal must DSCR.
Hard money
10% down · 12.0% · 12mo
- Down + closing
- —
- Monthly P&I
- —
- Monthly cashflow
- —
- DSCR
- —
- Eligible?
- —
Short-term bridge; refi at stabilization.
Rent comps 3 comps
| Address | Beds | Baths | Sqft | Rent | $/sqft | DOM | Units | Dist |
|---|---|---|---|---|---|---|---|---|
| 5440 Downing St Alexandria, LA | 2.0–3.0 | 1.5–2.0 | 1090 | $985 | $0.90 | 46d | 4 | 0.67mi |
| 381 Windermere Blvd Alexandria, LA | 2.0 | 2.0 | 1391 | $1,350 | $0.97 | 46d | 1 | 0.81mi |
| 5445 Provine Pl Alexandria, LA | 1.0–3.0 | 1.0–2.0 | 928 | $1,949 | $2.10 | 46d | 17 | 1.07mi |
Listing history 5 events
-
2026-03-24status Pending
-
2026-03-24price $155,000
-
2025-09-09$148,500 Active
-
2014-05-08soldstatus $151,000
-
2014-03-03$151,500
ⓘ Source: listings_history table (triggers on properties + properties_extension) + one-shot
backfill from property_details.listing_events for pre-trigger history.
Tax reassessment forecast LA · Resets to sale price
- Current annual tax
- $1,962 · $163/mo
- Projected year-2 tax
- $1,962 · $163/mo
- Expected delta
- $0/yr ($0/mo · 0.0%)
ⓘ Screening estimate from a state-policy table — verify with the county assessor before closing.
Climate risk First Street
- Flood 1/10 Low FEMA zone X (shaded) · 0% chance over 30 yrs
- Wildfire 1/10 Low
- Heat 8/10 Severe 7 d/yr ≥111°F today · 19 d/yr by 30 yrs out
- Wind 8/10 Severe 98% chance of damaging wind over 30 yrs
- Air quality 2/10 Low 1 unhealthy d/yr today · 1 by 30 yrs out
Nearby sold comps map
Loading sold comps map…
Walkable amenities ~0.75 mi
Loading nearby amenities…
Taxation est. · year 1
- Rental income
- $16,886
- − Mortgage interest
- −$8,682
- − Property taxes
- −$1,962
- − Insurance
- −$775
- − Repairs & maintenance
- −$1,351
- − Management
- −$1,351
- − Depreciation
- −$4,509
- Taxable loss
- −$1,744
- Est. tax savings @ 24.0%
- +$419
- After-tax cash flow
- $1,268/yr
For passive investors: Depreciation is non-cash, so a rental often shows a tax loss while cash-flowing — sheltering income. Rental losses are passive: they offset passive income freely, and up to $25,000/yr can offset ordinary (W-2) income if you actively participate and your MAGI is under $100k (phasing out to $0 by $150k); unused losses carry forward. On sale, claimed depreciation is recaptured at up to 25%, and gains may owe capital-gains tax (a 1031 exchange can defer both). Figures are a year-1 estimate at your 24.0% rate — not tax advice; consult a CPA.
Schools (NCES district)
- District
- Rapides Parish
- NCES district ID
- 2201290
- Math proficiency
- 29% ▼ -34.00%
- Reading proficiency
- 44% ▼ -29.00%
- Median HH income
- $41,057
- Composite
- 30.68/100
- National rank
- #6179
- State rank
- #31 of 98 in LA
Livability — Alexandria
- Score
- 64/100
- State rank
- #160
- US rank
- #13698
Category grades
Schools grade is shown separately in the Schools card above.
Census & demographics
- Census place
- Alexandria, LA
- County
- Rapides Parish · 59,791 people
- City population
- 25,138
- Metro
- Alexandria, LA
- Population (ZIP)
- 25,138
- Household income
- $67,156
- Rent vs Own
- Severe rent burden
- 1098.0
Population outlook (Rapides County) Hauer SSP2
- Today (2025)
- 133,047 people
- By 2030
- 132,333 · -0.5%
- By 2040
- 129,355 · -2.8%
- By 2050
- 124,535 · -6.4%
- By 2075
- 110,338 · -17.1%
- By 2100
- 88,641 · -33.4%
Race, ethnicity, and origin ACS 2023
- Neighborhood character
- Diverse neighborhood (Simpson 0.55)
- Race & ethnicity
- White 57% Black 36% Hispanic / Latino 3% Two or more races 3% Asian 2%
- Common ancestry
- Lithuanian 6% Italian 1% Serbian 1%
- Foreign-born
- 4% · China, Canada
- Languages at home
- 94% English-only · Spanish 2% Other Indo-European 1% Arabic 1%
Political lean MEDSL · Rapides
- 2024 margin
- Solid R (+36.8) · D 31.0% · R 67.7% · Other 1.3%
- 2008→2024 swing
- -8.1pp toward R · 2008: -28.7pp · 2024: -36.8pp
- All cycles
- 2024: R+36.8 2020: R+32.1 2016: R+32.5 2012: R+29.6 2008: R+28.7
Not yet ingested
- Civics
- —
Market trends
- HPI YoY
- ▼ -77.84%
- Current HPI
- 183.4342
- Rent YoY
- —
- Metro
- Alexandria, LA
- State GDP YoY
- ▲ 3.29%
- F500 in state
- 10
Industry mix (Fortune 500 HQ in LA)
| Industry | F500 HQs | Revenue |
|---|---|---|
| Telecommunications | 2 | $23B |
|
||
| Utilities | 1 | $12B |
|
||
| Wholesale / Distribution | 1 | $5B |
|
||
| Advertising | 1 | $2B |
|
||
Price history
+2.3% since first listed5 events — show timeline
- 2026-03-24 Pending — AcadianaMLS
- 2026-03-24 Price Changed $155,000 AcadianaMLS
- 2025-09-09 Listed $148,500 AcadianaMLS
- 2014-05-08 Sold (Public Records) $151,000 Public Records
- 2014-03-03 Listed $151,500 AcadianaMLS
Property tax history
+0.2%/yrLatest (2025): $1,962 · +9.3% YoY. Source: county tax records.
Cash-flow waterfall
monthlySold comps — $/sqft
last 12 mo · ≤1 miLoading sold comps…