1350 E Sample Rd #306 · Pompano Beach, FL
Flood risk No data
- FEMA flood zone
- —
- Chance of flooding over 30 yrs
- —
- Est. flood insurance / yr
- —
Fire risk No data
- Est. fire insurance / yr
- —
Heat risk No data
- Hot days now (above threshold)
- —
- Hot days in 30 yrs
- —
Wind risk No data
- Chance of severe wind over 30 yrs
- —
Air-quality risk No data
- Unhealthy air days now
- —
- Unhealthy air days in 30 yrs
- —
Risk factors via First Street. Map © Google.
Why this score? — see what drove the D grade
The composite is a weighted blend of 9 inputs, each scored 0–100. Each bar is that input's sub-score; the figure is the points it added to the 100-point composite (weight × sub-score).
- Cash flow +12.0/30.0
- ARV discount +7.5/15.0
- 1% rule +5.2/10.0
- Schools +4.1/10.0
- Livability +3.7/5.0
- DSCR +3.5/10.0
- Rent growth +2.9/5.0
- Condition / age +2.5/5.0
- Appreciation +0.0/10.0
$169,900
🖨 Deal sheet 📄 Offer letter ✓ Due diligence
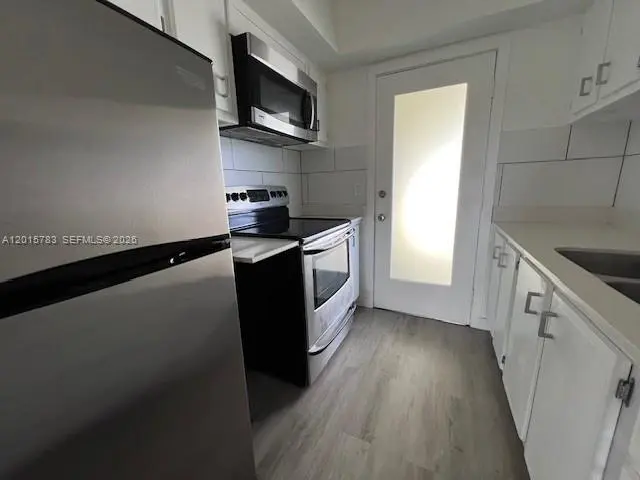
Listing remarks
Beautifully renovated third-floor unit in a charming and quiet community! This 1-bedroom, 1-bathroom apartment offers a spacious layout with newer vinyl flooring. The sleek kitchen features stainless steel appliances, quartz countertops, a double steel sink, and plenty of cabinet space. Extra features include large spacious closets and assigned parking. Enjoy the convenience of an additional large storage closet, access to a community laundry room, and a recreation area. Located just east of I-95, this prime location is less than half a mile from US-1 and Lighthouse Point, offering easy access to shopping, dining, and entertainment.
Key facts
- Quartz countertops
- Double steel sink
- Spacious layout
Tags
Property features AI
Finance
- Financial info: Lease considered; No pets allowed
- HOA & community: Monthly association fee of $225; Association covers cable TV, insurance, grounds maintenance, sewer and water; Community amenities include laundry and elevator(s)
Exterior
- Parking: One parking space
- Security: Smoke detector(s)
- Utilities: Has heating and cooling
- Home design: 3 stories; Entry on third floor; Attached property
- Construction: Block construction; Resale property
- Exterior features: Courtyard
Interior
- Kitchen: Electric range; Refrigerator
- Bedrooms: Bedroom located on the main level
- Flooring: Vinyl
- Bathrooms: 1 full bathroom
- Heating & cooling: Central heating; Central air conditioning
- Interior features: Unfurnished; Bedroom on main level; Living/Dining room; Third floor entry
- Laundry & utility: Common area laundry
Neighborhood map
What this means for you Summary
Snapshot
- This is a 1-bed/1.0-bath condo listed at $170k.
Deal economics
- At list price, monthly cash flow is $-41 ($-491/yr) — negative.
- To cash-flow at today's rent, offer at most $163k (4.3% below list).
- Meets the 1% rule at list price ($2k rent vs $170k).
- Recommended offer: $163k (4.3% below list) — sets the bar for cash-flow.
- Cap rate 6.0% vs local median 3.1% in Pompano Beach — top-decile yield for the area; either an underpriced asset or a hidden risk that comps aren't pricing in. Stress-test before assuming the spread holds.
Location & tenants
- Location reads 74/100 on livability (#284 in FL, #4,541 nationally) — a middle-class / working-renter tenant base. Strengths: commute A+, housing A+, cost of living B+; Watch: schools D+, employment D+, amenities F.
- Broward (suburban): math 42% / reading 53% proficiency, ranked #46 of 73 in FL (top 63%) — families likely to look elsewhere, expect single-tenant / working-renter base with shorter leases.
- Market conditions: Rents rising (+1.8%/yr); 591 active listings in the ZIP; 25 comparable units currently listed for rent nearby; rentals at typical pace (median 24d on market — plan ~3-4 weeks tenant-placement turnaround); 2,111 units permitted in Broward County in 2024 (1,265 in 5+ unit buildings).
Forward outlook
- Local home prices are declining (-3.0%/yr); year-one equity from $1k of loan paydown is wiped out by about $5k of value loss. Plan a longer hold.
- Broward County population projected at +34% by 2050 — long-run rental-demand tailwind backs the buy-and-hold thesis.
Negotiation context
- It's been on market 41 days — a 3% lower offer ($165k) is reasonable based on typical stale-listing flexibility.
- 4 sale attempts since 3y ago with the ask held roughly flat each time — persistent listings suggest the price (not the market) is what's stuck; bring a comps-based counter.
- Current owner paid $86k; list at $170k implies a 98% gain — meaningful room to come down on a strong offer.
Questions for the listing agent
- What do current leases actually rent for vs. the listed asking? Can we see a recent rent roll and the last 12 months of T-12 income?
- It's been on market 41 days. Have you received any prior offers? Is the seller open to a 4% concession, seller financing, or rate buy-down credit?
- Built in 1965 — when were the roof, HVAC, electrical panel, plumbing, and water heater last replaced?
- What does the HOA fee cover, when was the last increase, and are there any pending special assessments or reserve-fund shortfalls?
- Any open or pending special assessments — roof, HVAC, plumbing, elevator, façade? What's the per-unit balance and payoff schedule, and is the seller paying it off at close or rolling it to the buyer?
- Is there a deadline driving the sale (1031 exchange, divorce, estate, relocation)? That informs how much negotiation room exists.
- Schools are D-rated, which usually means shorter tenancies and higher turnover. Who's the typical renter profile here, and what's been the actual vacancy rate?
- The area grade is low — what's the realistic commute time and amenity access for the typical tenant pool here? Any planned neighborhood developments (good or bad) we should know about?
- What's the average days-on-market for RENTAL listings here right now (not sales)? A rising rental-DOM trend means longer vacancies and softer asking-rent achievability than the comps imply.
- What's the recent tenant-quality profile in this submarket — average credit score on applications, eviction rate, late-payment / NSF rate, and stable-employment percentage? A property-management company in the area should have these aggregated.
- How much new apartment / multifamily construction is in the pipeline within 1–3 miles? Heavy new supply (>2% of stock underway) typically softens rents 12–24 months out; light construction supports rent growth.
Investment metrics
- 1% rule
- 1.02% ✓
- Cap rate
- 6.00%
- Cash-on-cash
- -1.03%
- DSCR
- 0.95
- GRM
- 8.2
CMA / ARV
No comps found within radius.
Projected returns pro-forma
-3.0% appreciation · 1.75% rent growth · sell at horizon
- IRR
- -19.6%
- Equity multiple
- 0.32×
- Total profit
- $-32,116
- Equity at exit
- $25,333
- IRR
- -15.6%
- Equity multiple
- 0.18×
- Total profit
- $-39,231
- Equity at exit
- $14,690
Cash invested: $47,572 (down + closing). Projections, not guarantees.
Landlord ↔ Tenant lean methodology
- Overall (STATE)
- 87 Strongly Landlord-Friendly
- State Florida
- 87 Strongly Landlord-Friendly · R+3
- County
- — inherits STATE
- City
- — inherits STATE
ZIP-level market 33064
- Home prices YoY
- -18.7%
- Rents YoY
- 1.8%
- Active inventory
- 591
- Price-to-rent
- 8.2×
Monthly cashflow live
- Estimated rent
- $1,729 high interval (Pro) →
- Mortgage (P&I)
- −$891
- Tax from tax record
- −$220 /mo · $2,643/yr
- Insurance
- −$71
- HOA
- −$225
- Vacancy / Maint / Mgmt
- −$363
- Net cashflow
- $-41
Break-even live
UW: 25.0% down · 7.5% · 30yr · 1.5% tax · 5.0% vac · 8.0% maint · 8.0% mgmt
Financing live
Cash to close
- Down payment
- $42,475
- Closing costs
- $5,097
- Reserves months
- —
- Total cash needed
- —
Loan-product check · same deal, 3 products live
Conventional
25% down · 7.5% · 30yr
- Down + closing
- —
- Monthly P&I
- —
- Monthly cashflow
- —
- DSCR
- —
- Eligible?
- —
Personal DTI + credit; lowest rate.
DSCR
20% down · 8.5% · 30yr
- Down + closing
- —
- Monthly P&I
- —
- Monthly cashflow
- —
- DSCR
- —
- Eligible?
- —
No personal income docs; deal must DSCR.
Hard money
10% down · 12.0% · 12mo
- Down + closing
- —
- Monthly P&I
- —
- Monthly cashflow
- —
- DSCR
- —
- Eligible?
- —
Short-term bridge; refi at stabilization.
Rent comps 25 comps
| Address | Beds | Baths | Sqft | Rent | $/sqft | DOM | Units | Dist |
|---|---|---|---|---|---|---|---|---|
| 1150 E Sample Rd #202 Pompano Beach, FL | 1.0 | 1.0 | 640 | $1,650 | $2.58 | 24d | 1 | 0.11mi |
| 1480 E Sample Rd Pompano Beach, FL | 1.0 | 1.0 | 640 | $1,550 | $2.42 | 15d | 2 | 0.15mi |
| 1480 E Sample Rd #207 Pompano Beach, FL | 1.0 | 1.0 | 640 | $1,600 | $2.50 | 24d | 1 | 0.15mi |
| 3300 NE 10th Ter Pompano Beach, FL | 1.0 | 1.0 | 674 | $1,525 | $2.26 | 15d | 1 | 0.22mi |
| 1671 NE 33rd St Apt 1 Pompano Beach, FL | 1.0 | 1.0 | 750 | $1,650 | $2.20 | 24d | 1 | 0.41mi |
| 1671 NE 33rd St Unit 3 Pompano Beach, FL | 2.0 | 2.0 | 750 | $2,200 | $2.93 | 24d | 1 | 0.41mi |
| 1330 NE 41st Dr #2 Pompano Beach, FL | 1.0 | 1.0 | 400 | $1,750 | $4.38 | 11d | 1 | 0.50mi |
| 1751 NE 31st St Pompano Beach, FL | 1.0 | 1.0 | 642 | $1,595 | $2.48 | 15d | 1 | 0.56mi |
| 2900 NE 17th Ave Pompano Beach, FL | 1.0 | 1.0 | 650 | $1,745 | $2.68 | 11d | 1 | 0.61mi |
| 1512 NE 28th St Pompano Beach, FL | 2.0 | 1.0 | 624 | $2,500 | $4.01 | 24d | 1 | 0.65mi |
| 1901 NE 29th St #2 Lighthouse Point, FL | 1.0 | 1.0 | 700 | $1,600 | $2.29 | 24d | 1 | 0.73mi |
| 2633 NE 13th Ave Unit 1 Pompano Beach, FL | 2.0 | 1.0 | 650 | $2,300 | $3.54 | 20d | 1 | 0.76mi |
| 3700 NE 22nd Ave Unit 3720-11 Lighthouse Point, FL | 1.0 | 1.0 | 650 | $1,825 | $2.81 | 24d | 1 | 0.80mi |
| 2120 NE 41st St Unit C Lighthouse Point, FL | 1.0 | 1.0 | 650 | $1,675 | $2.58 | 24d | 1 | 0.85mi |
| 2115 NE 42nd Ct Unit 206N Lighthouse Point, FL | 1.0 | 1.0 | 560 | $1,600 | $2.86 | 24d | 1 | 0.97mi |
| 4611 N Federal Hwy Pompano Beach, FL | 1.0–3.0 | 1.0–2.0 | 969 | $2,110 | $2.18 | 1d | 9 | 1.08mi |
| 2234 NE 27th St Lighthouse Point, FL | 1.0 | 1.0 | 500 | $2,250 | $4.50 | 24d | 1 | 1.13mi |
| 1850 NE 48th St Pompano Beach, FL | 1.0–3.0 | 1.0–1.5 | 827 | $1,650 | $1.99 | 24d | 1 | 1.13mi |
| 1960 NE 48th St Unit 9 Pompano Beach, FL | 1.0 | 1.0 | 700 | $1,500 | $2.14 | 22d | 1 | 1.18mi |
| 3109 NW 2nd Ter Unit 4-156 Pompano Beach, FL | 1.0 | 1.0 | 680 | $1,600 | $2.35 | 15d | 1 | 1.35mi |
| 3109 NW 2nd Ter Unit 4-156 Pompano Beach, FL | 1.0 | 1.0 | 680 | $1,600 | $2.35 | 24d | 1 | 1.35mi |
| 341 NW 35th Ct Unit 1 Pompano Beach, FL | — | 1.0 | 655 | $1,300 | $1.98 | 24d | 1 | 1.41mi |
| 300 NW 30th Ct #202 Pompano Beach, FL | 1.0 | 1.0 | 633 | $1,650 | $2.61 | 24d | 1 | 1.43mi |
| 401 NW 34th St Pompano Beach, FL | 2.0 | 1.0–1.5 | 704 | $1,982 | $2.81 | 2d | 16 | 1.47mi |
| 201 S Golf Blvd #298 Pompano Beach, FL | 2.0 | 1.0 | 750 | $1,600 | $2.13 | 15d | 1 | 1.47mi |
HOA detail condo
- Monthly dues
- $225 · $2,700/yr
- Likely covers
- parking
- Assessments
- None detected in remarks — confirm with the listing agent.
Listing history 23 events
-
2026-06-18days on market $169,900 Active 41 DOM
-
2026-06-17days on market $169,900 Active 40 DOM
-
2026-06-16days on market $169,900 Active 39 DOM
-
2026-06-15days on market $169,900 Active 38 DOM
-
2026-06-13days on market $169,900 Active 36 DOM
-
2026-06-09days on market $169,900 Active 32 DOM
-
2026-06-08days on market $169,900 Active 31 DOM
-
2026-06-07days on market $169,900 Active 30 DOM
-
2026-06-04days on market $169,900 Active 27 DOM
-
2026-06-03days on market $169,900 Active 26 DOM
-
2026-06-02days on market $169,900 Active 25 DOM
-
2026-06-01days on market $169,900 Active 24 DOM
-
2026-05-31days on market $169,900 Active 23 DOM
-
2026-05-08$169,900 Active
-
2026-04-11$1,650
-
2025-07-30historical
-
2025-02-04$169,900 Active
-
2023-11-10historical $1,600
-
2023-09-26$1,600
-
2020-07-24soldstatus $86,000
-
2004-04-21soldstatus $61,800
-
1978-05-01soldstatus $21,000
-
1968-09-01soldstatus $8,500
ⓘ Source: listings_history table (triggers on properties + properties_extension) + one-shot
backfill from property_details.listing_events for pre-trigger history.
Tax reassessment forecast FL · Resets to sale price
- Current annual tax
- $2,643 · $220/mo
- Projected year-2 tax
- $2,643 · $220/mo
- Expected delta
- $0/yr ($0/mo · 0.0%)
ⓘ Screening estimate from a state-policy table — verify with the county assessor before closing.
Nearby sold comps map
Loading sold comps map…
Walkable amenities ~0.75 mi
Loading nearby amenities…
Taxation est. · year 1
- Rental income
- $20,750
- − Mortgage interest
- −$9,517
- − Property taxes
- −$2,643
- − Insurance
- −$850
- − Repairs & maintenance
- −$1,660
- − Management
- −$1,660
- − HOA
- −$2,700
- − Depreciation
- −$4,943
- Taxable loss
- −$3,221
- Est. tax savings @ 24.0%
- +$773
- After-tax cash flow
- $282/yr
For passive investors: Depreciation is non-cash, so a rental often shows a tax loss while cash-flowing — sheltering income. Rental losses are passive: they offset passive income freely, and up to $25,000/yr can offset ordinary (W-2) income if you actively participate and your MAGI is under $100k (phasing out to $0 by $150k); unused losses carry forward. On sale, claimed depreciation is recaptured at up to 25%, and gains may owe capital-gains tax (a 1031 exchange can defer both). Figures are a year-1 estimate at your 24.0% rate — not tax advice; consult a CPA.
Schools (NCES district)
- District
- Broward
- NCES district ID
- 1200180
- Math proficiency
- 42% ▼ -18.00%
- Reading proficiency
- 53% ▼ -5.00%
- Median HH income
- $52,139
- Composite
- 40.88/100
- National rank
- #3621
- State rank
- #46 of 73 in FL
Livability — Pompano Beach
- Score
- 74/100
- State rank
- #284
- US rank
- #4541
Category grades
Schools grade is shown separately in the Schools card above.
Census & demographics
- Census place
- Pompano Beach, FL
- County
- Broward County · 1,963,430 people
- City population
- 155,861
- Metro
- Miami-Fort Lauderdale-Pompano Beach, FL
- Population (ZIP)
- 64,563
- Household income
- $71,301
- Rent vs Own
- Severe rent burden
- 2907.0
Population outlook (Broward County) Hauer SSP2
- Today (2025)
- 2,207,033 people
- By 2030
- 2,360,704 · +7.0%
- By 2040
- 2,661,208 · +20.6%
- By 2050
- 2,946,698 · +33.5%
- By 2075
- 3,602,273 · +63.2%
- By 2100
- 3,970,984 · +79.9%
Race, ethnicity, and origin ACS 2023
- Neighborhood character
- Highly diverse neighborhood (Simpson 0.75)
- Race & ethnicity
- White 34% Hispanic / Latino 27% Black 25% Two or more races 24% Asian 2%
- Hispanic origin (detail)
- Mexican 4% Puerto Rican 4% Cuban 4% Dominican 2%
- Common ancestry
- Hispanic 13% Estonian 10% Romanian 1%
- Foreign-born
- 43% · Canada, Jamaica, Dominican Republic
- Languages at home
- 45% English-only · Spanish 23% French/Haitian/Cajun 16% Other Indo-European 13%
Political lean MEDSL · Broward
- 2024 margin
- D (+17.0) · D 58.0% · R 41.0%
- 2008→2024 swing
- -17.8pp toward R · 2008: 34.7pp · 2024: 17.0pp
- All cycles
- 2024: D+17.0 2020: D+29.8 2016: D+35.0 2012: D+34.9 2008: D+34.7
Not yet ingested
- Civics
- —
Market trends
- HPI YoY
- ▼ -109.09%
- Current HPI
- 474.7007
- Rent YoY
- ▲ 1.75%
- Metro
- Miami-Fort Lauderdale-Pompano Beach, FL
- State GDP YoY
- ▲ 3.28%
- F500 in state
- 36
Industry mix (Fortune 500 HQ in FL)
| Industry | F500 HQs | Revenue |
|---|---|---|
| Industrial Technology | 2 | $29B |
|
||
| Insurance | 2 | $17B |
|
||
| Retail | 1 | $60B |
|
||
| Technology Distribution | 1 | $58B |
|
||
| Homebuilding | 1 | $35B |
|
||
| Technology Manufacturing | 1 | $35B |
|
||
Price history
+1898.8% since first listed10 events — show timeline
- 2026-05-08 Listed $169,900 MARMLS
- 2026-04-11 Listed for Rent $1,650 MARMLS
- 2025-07-30 Listing Removed — MARMLS
- 2025-02-04 Listed $169,900 MARMLS
- 2023-11-10 Rental Removed $1,600 MARMLS
- 2023-09-26 Listed for Rent $1,600 MARMLS
- 2020-07-24 Sold (Public Records) $86,000 Public Records
- 2004-04-21 Sold (Public Records) $61,800 Public Records
- 1978-05-01 Sold (Public Records) $21,000 Public Records
- 1968-09-01 Sold (Public Records) $8,500 Public Records
Property tax history
+13.1%/yrLatest (2025): $2,643 · +9.1% YoY. Source: county tax records.
Cash-flow waterfall
monthlySold comps — $/sqft
last 12 mo · ≤1 miLoading sold comps…