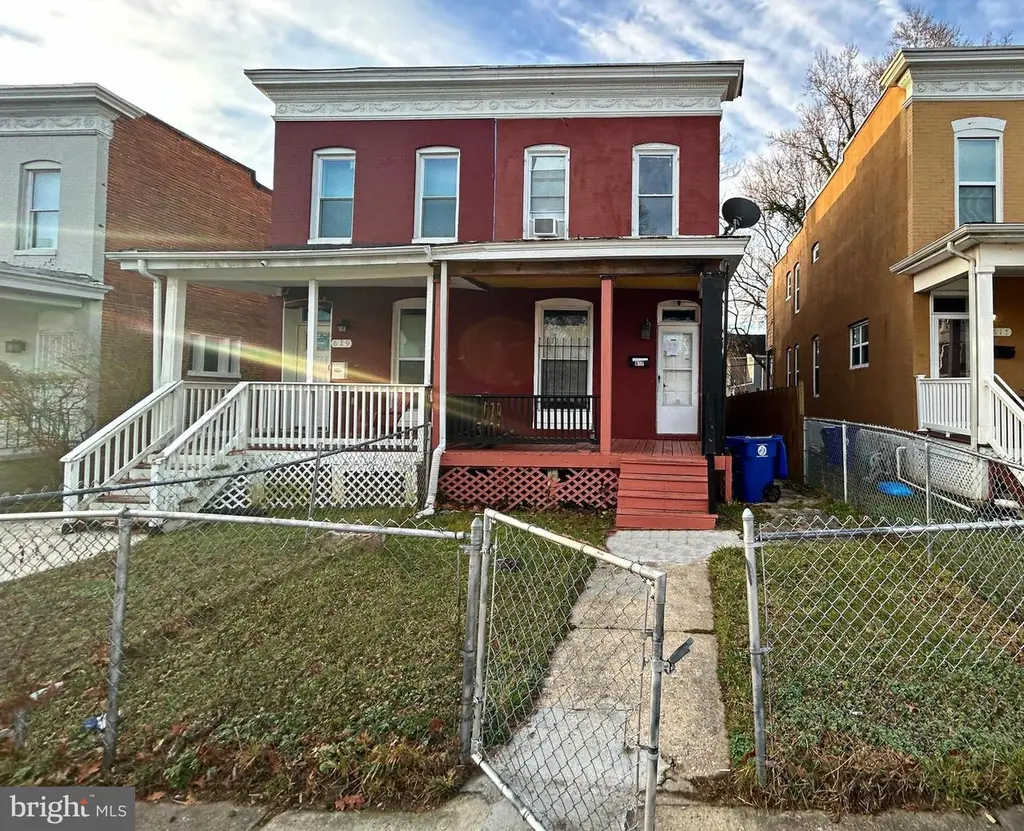
617 Dumbarton Ave · Baltimore, MD
Flood risk 1/10 · Minimal
- FEMA flood zone
- X (unshaded)
- Chance of flooding over 30 yrs
- 0.0%
- Est. flood insurance / yr
- $473 – $860
Fire risk 1/10 · Minimal
- Est. fire insurance / yr
- $755 – $1,403
Heat risk 7/10 · Major
- Hot days now (above 103°F)
- 7 days/yr
- Hot days in 30 yrs
- 15 days/yr
Wind risk 6/10 · Moderate
- Chance of severe wind over 30 yrs
- 27.0%
Air-quality risk 4/10 · Minor
- Unhealthy air days now
- 6 days/yr
- Unhealthy air days in 30 yrs
- 7 days/yr
Risk factors via First Street. Map © Google.
Why this score? — see what drove the B+ grade
The composite is a weighted blend of 9 inputs, each scored 0–100. Each bar is that input's sub-score; the figure is the points it added to the 100-point composite (weight × sub-score).
- Cash flow +30.0/30.0
- ARV discount +15.0/15.0
- 1% rule +10.0/10.0
- DSCR +10.0/10.0
- Livability +3.8/5.0
- Rent growth +2.9/5.0
- Condition / age +2.5/5.0
- Schools +1.0/10.0
- Appreciation +0.0/10.0
$99,900
🖨 Deal sheet (PDF) 📄 Offer letter ✓ Due diligence
Listing remarks
Discover the charm of this semi-detached colonial home in the neighborhood of Pen Lucy. Built in 1918, this home blends classic architecture with modern living, offering 1,890 sq. ft. of versatile space. Step inside to discover a warm interior featuring hardwood floors and crown moldings that enhance the home's timeless appeal. The spacious living room with its exposed brick walls is great place for entertaining while the separate dining room is perfect for formal dining. Relax in the cozy bathroom equipped with a tub shower, ensuring a soothing retreat after a long day. The home boasts three well-appointed bedrooms, providing ample space for rest and relaxation. An unfinished full basement
Key facts
- Exposed brick walls
- Separate dining room
- Crown moldings
Tags
Property features AI
Finance
- Other: Ownership interest: Ground Rent
- Financial info: Ground rent exists; $60 paid semi-annually; Below-grade area approximately 630 (unfinished)
Exterior
- Parking: On-street parking
- Utilities: Public water; Public sewer; Hot water: Electric and natural gas; Heating fuel: Natural gas and other
- Home design: Semi-detached; Above-grade and below-grade living areas; Estimated year built
- Construction: Brick construction; Concrete perimeter foundation
- Exterior features: Front yard; Rear yard; Deck(s); Porch(es); Sidewalks; Street lights; Fully fenced
Interior
- Kitchen: Eat-in kitchen with table space
- Bedrooms: Three bedrooms on the upper level
- Flooring: Hardwood; Tile/brick
- Bathrooms: One full bathroom
- Heating & cooling: 90% forced air heating; Window cooling units; Ceiling fans
- Interior features: Crown moldings; Dining area; Eat-in kitchen; Kitchen table space; Ceiling fans; Tub with shower; Drywall walls and ceilings; Wood floors
- Laundry & utility: Basement with interior access and connecting stairway (unfinished)
Neighborhood map
What this means for you Summary
Snapshot
- This is a 3-bed/1.0-bath townhouse listed at $100k.
Deal economics
- At list price, monthly cash flow is $704 ($8k/yr) — positive.
- The deal already cash-flows at list — no discount required.
- Meets the 1% rule at list price ($2k rent vs $100k).
- Recommended offer: $98k (1.5% below list) — sets the bar for market timing.
Location & tenants
- Location reads 76/100 on livability (#90 in MD, #3,396 nationally) — a middle-class / working-renter tenant base. Strengths: amenities A+, commute A+, housing A+; Watch: crime F.
- Baltimore City Public Schools (urban): math 7% / reading 16% proficiency, ranked #24 of 24 in MD (top 100%) — low school quality limits family demand, transient renter base, plan for 1-2y turnover; 79% free/reduced lunch — lower-income household profile, screen leases tightly.
- Zoned schools: Elmer A. Henderson: A Johns Hopkins Partnership (math 2% / reading 16%, grade F, #650 of 860 statewide, top 77%, 642 students, 80% FRL); Baltimore Polytechnic Institute (math 71% / reading 84%, grade A-, #22 of 222 statewide, top 10%, 1,555 students, 43% FRL) — zoned schools average 62% FRL vs 79% district-wide (17 pts lower); this property's tenant base skews higher-income than the district average.
- Zoned-school proficiency averages 43% at this address vs 12% district-wide (+32 pts) — the actual schools serving this property are materially stronger than the Baltimore City Public Schools average implies; a family-tenant draw the district grade alone would hide.
- Market conditions: Rents rising (+1.6%/yr); 333 active listings in the ZIP; 40 comparable units currently listed for rent nearby; rentals at typical pace (median 23d on market — plan ~3-4 weeks tenant-placement turnaround); 42% of comp listings sitting > 30 days — soft ceiling on asking rent; 1,273 units permitted in Baltimore city in 2024 (1,104 in 5+ unit buildings).
Forward outlook
- Local home prices are declining (-3.0%/yr); year-one equity from $691 of loan paydown is wiped out by about $3k of value loss. Plan a longer hold.
- Baltimore County population projected to shrink 4% by 2050 — rents likely to lag national; underwrite the cash flow, not the appreciation.
- At projected returns (-3.0% appreciation + 1.6% rent growth), your $28k cash investment doubles in ~5 years — after that, you're playing with house money.
Negotiation context
- It's been on market 30 days — a 2% lower offer ($98k) is reasonable based on typical stale-listing flexibility.
- 7 sale attempts since 22y ago with the ask held roughly flat each time — persistent listings suggest the price (not the market) is what's stuck; bring a comps-based counter.
- Current owner paid $60k; list at $100k implies a 66% gain — meaningful room to come down on a strong offer.
Risks & watch-outs
- Watch-outs: property tax is 3.2% of price; built in 1918 — expect roof / HVAC / electrical / plumbing capex.
- Climate carrying-cost: major wind risk, 27% chance of damaging wind over 30y; extreme-heat days projected 7→15/yr by 2055 (HVAC capex compounding) — expect insurance premiums to compound above CPI over the hold.
Questions for the listing agent
- Built in 1918 — when were the roof, HVAC, electrical panel, plumbing, and water heater last replaced?
- Property tax is high relative to price — has the assessment been appealed recently, and will the sale trigger a re-assessment?
- Is there a deadline driving the sale (1031 exchange, divorce, estate, relocation)? That informs how much negotiation room exists.
- Schools are D-rated, which usually means shorter tenancies and higher turnover. Who's the typical renter profile here, and what's been the actual vacancy rate?
- Crime grade is F in this area — have there been break-ins, vandalism, or insurance claims at this property in the last 3 years? What carrier currently insures it and at what premium?
- What's the average days-on-market for RENTAL listings here right now (not sales)? A rising rental-DOM trend means longer vacancies and softer asking-rent achievability than the comps imply.
- What's the recent tenant-quality profile in this submarket — average credit score on applications, eviction rate, late-payment / NSF rate, and stable-employment percentage? A property-management company in the area should have these aggregated.
- How much new for-sale + rental construction is in the pipeline within 1–3 miles? Heavy new supply typically softens prices + rents 12–24 months out; constrained supply supports both.
Investment metrics
- 1% rule
- 1.95% ✓
- Cap rate
- 14.75%
- Cash-on-cash
- 30.21%
- DSCR
- 2.34
- GRM
- 4.3
CMA / ARV
- ARV (median comp)
- $188,736
- List price
- $99,900
- Delta
- -47.07%
- Verdict
- UNDERPRICED
- Comps
- 20 within 1.0 mi
Show comp detail 12 sales within ~0.75 mi
| Address | Dist | Beds/Ba | Sqft | Sold | Price | $/sf | Match |
|---|---|---|---|---|---|---|---|
| 827 Belgian Ave | 0.21mi | 3/2.0 | 1,260 (0%) | 2mo | $130,000 | $103 | 85 |
| 646 E 37th St | 0.29mi | 3/2.0 | 1,284 (+2%) | 0mo | $94,000 | $73 | 79 |
| 604 E 35th St E | 0.48mi | 3/1.0 | 1,260 (0%) | 1mo | $94,000 | $75 | 77 |
| 515 E 35th St | 0.51mi | 3/1.5 | 1,260 (0%) | 1mo | $135,999 | $108 | 74 |
| 608 Chestnut Hill Ave | 0.26mi | 2/1.0 (-1) | 1,156 (-8%) | 1mo | $73,000 | $63 | 69 |
| 3633 Elkader Rd | 0.41mi | 2/1.5 (-1) | 1,304 (+4%) | 1mo | $265,000 | $203 | 67 |
| 3825 Elkader Rd | 0.30mi | 4/2.0 (+1) | 1,352 (+7%) | 1mo | $275,000 | $203 | 64 |
| 3807 Elkader Rd | 0.33mi | 4/2.0 (+1) | 1,352 (+7%) | 0mo | $235,000 | $174 | 63 |
| 800 Radnor Ave | 0.66mi | 3/1.5 | 1,224 (-3%) | 2mo | $99,900 | $82 | 61 |
| 609 Melville Ave | 0.45mi | 4/2.0 (+1) | 1,364 (+8%) | 1mo | $120,000 | $88 | 55 |
| 4100 N Charles St #1110 | 0.68mi | 2/2.0 (-1) | 1,363 (+8%) | 0mo | $339,000 | $249 | 46 |
| 4100 N Charles St N #803 | 0.68mi | 2/2.0 (-1) | 1,421 (+13%) | 2mo | $305,000 | $215 | 37 |
Match score weights: distance 35% · size 25% · config 20% · recency 20%. Top-matched comps best support the ARV.
Projected returns pro-forma
-3.0% appreciation · 1.63% rent growth · sell at horizon
- IRR
- 23.2%
- Equity multiple
- 1.93×
- Total profit
- $26,132
- Equity at exit
- $14,895
- IRR
- 30.2%
- Equity multiple
- 3.52×
- Total profit
- $70,422
- Equity at exit
- $8,638
Cash invested: $27,972 (down + closing). Projections, not guarantees.
Landlord ↔ Tenant lean methodology
- Overall (CITY)
- 12 Strongly Tenant-Friendly
- State Maryland
- 27 Tenant-Leaning · D+14
- County
- — inherits STATE
- City Baltimore
- 12 Strongly Tenant-Friendly · D+58
ZIP-level market 21218
- Rents YoY
- 1.6%
- Active inventory
- 333
- Price-to-rent
- 4.3×
Monthly cashflow live
- Estimated rent
- $1,944 high interval (Pro) →
- Mortgage (P&I)
- −$524
- Tax from tax record
- −$266 /mo · $3,194/yr
- Insurance
- −$42
- HOA
- −$0
- Lot rent
- −$0
- Vacancy / Maint / Mgmt
- −$408
- Net cashflow
- $704
Break-even live
Sensitivity live
| Price | -10% $761 | -5% $732 | +0% $704 | +5% $676 | +10% $648 |
|---|---|---|---|---|---|
| Rent | -10% $551 | -5% $627 | +0% $704 | +5% $781 | +10% $858 |
| Rate | -1.0pp $754 | -0.5pp $730 | base $704 | +0.5pp $678 | +1.0pp $652 |
UW: 25.0% down · 7.5% · 30yr · 1.5% tax · 5.0% vac · 8.0% maint · 8.0% mgmt
Financing live
Cash to close
- Down payment
- $24,975
- Closing costs
- $2,997
- Reserves months
- —
- Total cash needed
- —
Loan-product check · same deal, 3 products live
Conventional
25% down · 7.5% · 30yr
- Down + closing
- —
- Monthly P&I
- —
- Monthly cashflow
- —
- DSCR
- —
- Eligible?
- —
Personal DTI + credit; lowest rate.
DSCR
20% down · 8.5% · 30yr
- Down + closing
- —
- Monthly P&I
- —
- Monthly cashflow
- —
- DSCR
- —
- Eligible?
- —
No personal income docs; deal must DSCR.
Hard money
10% down · 12.0% · 12mo
- Down + closing
- —
- Monthly P&I
- —
- Monthly cashflow
- —
- DSCR
- —
- Eligible?
- —
Short-term bridge; refi at stabilization.
Rent comps 40 comps
| Address | Beds | Baths | Sqft | Rent | $/sqft | DOM | Units | Dist |
|---|---|---|---|---|---|---|---|---|
| 513 E 41st St Baltimore, MD | 4.0 | 1.5 | 1620 | $1,900 | $1.17 | 46d | 1 | 0.12mi |
| 4033 Greenmount Ave Baltimore, MD | 2.0 | 2.5 | 1860 | $2,550 | $1.37 | 26d | 1 | 0.14mi |
| 3721 Ellerslie Ave Baltimore, MD | 1.0–3.0 | 1.0–2.0 | 924 | $1,603 | $1.73 | 0d | 1 | 0.24mi |
| 4303 York Rd #3 Baltimore, MD | 2.0 | 1.0 | 1680 | $1,400 | $0.83 | 46d | 1 | 0.25mi |
| 612 Chestnut Hill Ave Unit 1 Baltimore, MD | 2.0 | 1.0 | 900 | $1,999 | $2.22 | 46d | 1 | 0.26mi |
| 720 Springfield Ave Baltimore, MD | 3.0 | 1.0 | 1160 | $2,000 | $1.72 | 46d | 1 | 0.26mi |
| 706 E 43rd St Baltimore, MD | 4.0 | 1.5 | 1596 | $1,899 | $1.19 | 4d | 1 | 0.29mi |
| 815 Gilrubin Ct Baltimore, MD | 2.0 | 1.0 | 900 | $1,695 | $1.88 | 46d | 1 | 0.30mi |
| 812 Nat Ct Apt 12 Baltimore, MD | 2.0 | 1.0 | 900 | $1,295 | $1.44 | 46d | 1 | 0.32mi |
| 925 Chestnut Hill Ave Baltimore, MD | 3.0 | 1.0 | 1280 | $1,895 | $1.48 | 0d | 1 | 0.35mi |
| 4407 Old York Rd Baltimore, MD | 3.0 | 1.5 | 1356 | $1,574 | $1.16 | 46d | 1 | 0.40mi |
| 4407 Old York Rd Baltimore, MD | 3.0 | 1.5 | 1356 | $1,574 | $1.16 | 22d | 1 | 0.40mi |
| 721 E 36th St Unit Na Baltimore, MD | 2.0 | 1.0 | 1156 | $1,650 | $1.43 | 46d | 1 | 0.42mi |
| 3529 Greenmount Ave Baltimore, MD | 3.0 | 2.0 | 1316 | $1,575 | $1.20 | 46d | 1 | 0.46mi |
| 531 Willow Ave Unit Na Baltimore, MD | 4.0 | 1.0 | 1300 | $1,800 | $1.38 | 22d | 1 | 0.47mi |
| 724 E 35th St Baltimore, MD | 3.0 | 1.5 | 1368 | $2,000 | $1.46 | 17d | 1 | 0.50mi |
| 3616 Yolando Rd Baltimore, MD | 3.0 | 2.0 | 1360 | $1,900 | $1.40 | 0d | 1 | 0.52mi |
| 835 E Cold Spring Ln Baltimore, MD | 2.0 | 1.5 | 997 | $1,400 | $1.40 | 26d | 1 | 0.53mi |
| 1040 E 33rd St Baltimore, MD | 1.0–2.0 | 1.0–2.0 | 775 | $1,525 | $1.97 | 0d | 9 | 0.62mi |
| 3601 Greenway #101 Baltimore, MD | 2.0 | 2.0 | 1470 | $2,700 | $1.84 | 6d | 1 | 0.63mi |
| 804 Radnor Ave Baltimore, MD | 3.0 | 1.0 | 1654 | $2,000 | $1.21 | 46d | 1 | 0.66mi |
| 348 E University Pkwy Baltimore, MD | 4.0 | 2.0 | 1809 | $2,400 | $1.33 | 46d | 1 | 0.67mi |
| 1 E University Pkwy Baltimore, MD | 1.0–3.0 | 1.0–2.0 | 1045 | $2,500 | $2.39 | 7d | 2 | 0.70mi |
| 514 Radnor Ave Baltimore, MD | 3.0 | 1.5 | 1575 | $1,500 | $0.95 | 47d | 1 | 0.70mi |
| 3811 Canterbury Rd Baltimore, MD | 2.0 | 1.0–2.0 | 975 | $2,495 | $2.56 | 15d | 5 | 0.71mi |
| 1504 Upshire Rd Unit 1E Baltimore, MD | 2.0 | 1.0 | 1000 | $1,400 | $1.40 | 46d | 1 | 0.72mi |
| 3501 Saint Paul St Baltimore, MD | 2.0 | 1.0 | 673 | $2,030 | $3.02 | 0d | 186 | 0.72mi |
| 3222 Ellerslie Ave Baltimore, MD | 4.0 | 1.5 | 1550 | $1,950 | $1.26 | 46d | 1 | 0.73mi |
| 3221 Guilford Ave Apt A Baltimore, MD | 3.0 | 1.5 | 1025 | $2,925 | $2.85 | 20d | 1 | 0.78mi |
| 108 W 39th St Baltimore, MD | 2.0 | 1.0–2.0 | 1350 | $2,189 | $1.62 | 0d | 12 | 0.80mi |
| 616 Montpelier St Baltimore, MD | 3.0 | 1.0 | 1150 | $1,750 | $1.52 | 13d | 1 | 0.81mi |
| 105 W 39th St Baltimore, MD | 2.0 | 1.0 | 753 | $2,250 | $2.99 | 7d | 1 | 0.81mi |
| 1539 Ralworth Rd Baltimore, MD | 3.0 | 2.0 | 1580 | $1,950 | $1.23 | 17d | 1 | 0.82mi |
| 1502 Fernley Rd Baltimore, MD | 3.0 | 2.0 | 1350 | $2,800 | $2.07 | 46d | 1 | 0.84mi |
| 3201 Saint Paul St Baltimore, MD | 1.0–2.0 | 1.5–2.0 | 1532 | $3,200 | $2.09 | 0d | 2 | 0.85mi |
| 1260 Rossiter Ave Baltimore, MD | 2.0 | 1.0 | 710 | $1,250 | $1.76 | 0d | 36 | 0.86mi |
| 510 Winston Ave Baltimore, MD | 4.0 | 2.0 | 1600 | $2,800 | $1.75 | 22d | 1 | 0.86mi |
| 543 Chateau Ave Baltimore, MD | 3.0 | 2.0 | 1152 | $1,900 | $1.65 | 7d | 1 | 0.87mi |
| 416 Winston Ave Unit 426-01 Baltimore, MD | 2.0 | 1.0 | 890 | $1,250 | $1.40 | 46d | 1 | 0.88mi |
| 1617 Argonne Dr Baltimore, MD | 4.0 | 2.0 | 1200 | $2,550 | $2.12 | 46d | 1 | 0.88mi |
Listing history 25 events
-
2026-06-22days on market $99,900 Active 30 DOM
-
2026-06-21days on market $99,900 Active 29 DOM
-
2026-06-18days on market $99,900 Active 26 DOM
-
2026-06-17statusdays on market $99,900 Active 25 DOM
-
2026-04-28$99,900 Active 1309-char remark
-
2025-12-12historical
-
2025-12-03price $125,000
-
2025-12-03price $130,000
-
2025-11-17price $135,000
-
2025-11-10price $140,000
-
2025-10-17$160,000 Active
-
2011-07-01historical Expired
-
2011-07-01historical
-
2011-01-29Active
-
2011-01-28$100,000
-
2005-08-18soldstatus $60,000
-
2005-08-04soldstatus $60,000
-
2005-07-06soldstatus $45,000
-
2005-06-30historical
-
2005-05-13$60,000
-
2004-07-30soldstatus $32,000
-
2004-05-07historical
-
2004-03-10$20,000
-
1994-05-05soldstatus $22,000
-
1993-09-15soldstatus $22,000
ⓘ Source: listings_history table (triggers on properties + properties_extension) + one-shot
backfill from property_details.listing_events for pre-trigger history.
Tax reassessment forecast MD · Partial reset (capped growth)
- Current annual tax
- $3,194 · $266/mo
- Projected year-2 tax
- $3,194 · $266/mo
- Expected delta
- $0/yr ($0/mo · 0.0%)
ⓘ Screening estimate from a state-policy table — verify with the county assessor before closing.
Climate risk First Street
- Flood 1/10 Low FEMA zone X (unshaded) · 0% chance over 30 yrs
- Wildfire 1/10 Low
- Heat 7/10 Severe 7 d/yr ≥103°F today · 15 d/yr by 30 yrs out
- Wind 6/10 Major 27% chance of damaging wind over 30 yrs
- Air quality 4/10 Moderate 6 unhealthy d/yr today · 7 by 30 yrs out
Nearby sold comps map
Loading sold comps map…
Walkable amenities ~0.75 mi
Loading nearby amenities…
Taxation est. · year 1
- Rental income
- $23,329
- − Mortgage interest
- −$5,596
- − Property taxes
- −$3,194
- − Insurance
- −$500
- − Repairs & maintenance
- −$1,866
- − Management
- −$1,866
- − Depreciation
- −$2,906
- Taxable income
- $7,401
- Est. tax owed @ 24.0%
- −$1,776
- After-tax cash flow
- $6,674/yr
For passive investors: Depreciation is non-cash, so a rental often shows a tax loss while cash-flowing — sheltering income. Rental losses are passive: they offset passive income freely, and up to $25,000/yr can offset ordinary (W-2) income if you actively participate and your MAGI is under $100k (phasing out to $0 by $150k); unused losses carry forward. On sale, claimed depreciation is recaptured at up to 25%, and gains may owe capital-gains tax (a 1031 exchange can defer both). Figures are a year-1 estimate at your 24.0% rate — not tax advice; consult a CPA.
Schools (NCES district)
- District
- Baltimore City Public Schools
- NCES district ID
- 2400090
- Math proficiency
- 7% ▼ -9.00%
- Reading proficiency
- 16% ▼ -5.00%
- Median HH income
- $42,108
- Composite
- 10.08/100
- National rank
- #9805
- State rank
- #24 of 24 in MD
Livability — Baltimore
- Score
- 76/100
- State rank
- #90
- US rank
- #3396
Category grades
Schools grade is shown separately in the Schools card above.
Census & demographics
- Census place
- Baltimore, MD
- County
- Baltimore City · 558,601 people
- City population
- 588,727
- Metro
- Baltimore-Columbia-Towson, MD
- Population (ZIP)
- 44,014
- Household income
- $62,488
- Rent vs Own
- Severe rent burden
- 2564.0
Population outlook (Baltimore County) Hauer SSP2
- Today (2025)
- 624,249 people
- By 2030
- 621,541 · -0.4%
- By 2040
- 609,756 · -2.3%
- By 2050
- 597,249 · -4.3%
- By 2075
- 552,236 · -11.5%
- By 2100
- 513,934 · -17.7%
Race, ethnicity, and origin ACS 2023
- Neighborhood character
- Diverse neighborhood (Simpson 0.58)
- Race & ethnicity
- Black 60% White 26% Two or more races 6% Hispanic / Latino 5% Asian 5%
- Hispanic origin (detail)
- Common ancestry
- Romanian 2% Italian 1% Scotch-Irish 1%
- Foreign-born
- 10% · Canada, China, South Korea
- Languages at home
- 87% English-only · Spanish 4% French/Haitian/Cajun 2% Chinese 2%
Political lean MEDSL · Baltimore
- 2024 margin
- Solid D (+73.0) · D 85.2% · R 12.2% · Other 2.6%
- 2008→2024 swing
- -2.5pp toward R · 2008: 75.5pp · 2024: 73.0pp
- All cycles
- 2024: D+73.0 2020: D+76.6 2016: D+74.6 2012: D+76.4 2008: D+75.5
Not yet ingested
- Civics
- —
Market trends
- HPI YoY
- ▼ -463.14%
- Current HPI
- 292.3986
- Rent YoY
- ▲ 1.63%
- Metro
- Baltimore-Columbia-Towson, MD
- State GDP YoY
- ▲ 2.97%
- F500 in state
- 12
Industry mix (Fortune 500 HQ in MD)
| Industry | F500 HQs | Revenue |
|---|---|---|
| Aerospace / Defense | 1 | $71B |
|
||
| Utilities | 1 | $25B |
|
||
| Hotels | 1 | $24B |
|
||
| Consumer Goods | 1 | $7B |
|
||
| Real Estate | 1 | $6B |
|
||
| Chemicals | 1 | $2B |
|
||
Price history
+354.1% since first listed23 events — show timeline
- 2026-06-16 Relisted — BRIGHT MLS
- 2026-05-22 Pending — BRIGHT MLS
- 2026-04-28 Listed $99,900 BRIGHT MLS
- 2025-12-12 Listing Removed — BRIGHT MLS
- 2025-12-03 Price Changed $125,000 BRIGHT MLS
- 2025-12-03 Price Changed $130,000 BRIGHT MLS
- 2025-11-17 Price Changed $135,000 BRIGHT MLS
- 2025-11-10 Price Changed $140,000 BRIGHT MLS
- 2025-10-17 Listed $160,000 BRIGHT MLS
- 2011-07-01 Delisted — MRIS
- 2011-07-01 Listing Removed — BRIGHT MLS
- 2011-01-29 Listed — MRIS
- 2011-01-28 Listed $100,000 BRIGHT MLS
- 2005-08-18 Sold (Public Records) $60,000 Public Records
- 2005-08-04 Sold (MLS) $60,000 MRIS
- 2005-07-06 Sold (Public Records) $45,000 Public Records
- 2005-06-30 Delisted — MRIS
- 2005-05-13 Listed $60,000 MRIS
- 2004-07-30 Sold (MLS) $32,000 MRIS
- 2004-05-07 Delisted — MRIS
- 2004-03-10 Listed $20,000 MRIS
- 1994-05-05 Sold (Public Records) $22,000 Public Records
- 1993-09-15 Sold (Public Records) $22,000 Public Records
Property tax history
+3.4%/yrLatest (2025): $3,194 · +8.4% YoY. Source: county tax records.
Cash-flow waterfall
monthlySold comps — $/sqft
last 12 mo · ≤1 miLoading sold comps…